

Abstract
We examined whether self-restraint in early childhood predicted individual differences in three executive functions (EFs; inhibiting prepotent responses, updating working memory, and shifting task sets) in late adolescence in a sample of ~950 twins. At ages 14, 20, 24, and 36 months, the children were shown an attractive toy and told not to touch it for 30 seconds. Latency to touch the toy increased with age, and latent class growth modeling distinguished two groups of children that differed in their latencies to touch the toy at all 4 time points. Using confirmatory factor analysis, the three EFs (measured with latent variables at age 17 years) were decomposed into a Common EF factor (isomorphic to response inhibition ability) and two factors specific to updating and shifting, respectively. Less restrained children had significantly lower scores on the Common EF factor, equivalent scores on the Updating-specific factor, and higher scores on the Shifting-specific factor than the more restrained children. The less restrained group also had lower IQ scores, but this effect was entirely mediated by the EF components. Twin models indicated that the associations were primarily genetic in origin for the Common EF variable but split between genetics and nonshared environment for the Shifting-specific variable. These results suggest a biological relation between individual differences in self-restraint and EFs, one that begins early in life and persists into late adolescence.
Keywords: self-regulation, compliance, flexibility, executive attention, effortful control
Young children are not known for self-restraint. They often have difficulty delaying gratification, controlling emotions, and, more generally, doing things they do not want to do and not doing things they do want to do. A sizeable literature describes the development of self-restraint as measured by responses to situations demanding compliance with “do” or “don’t” commands (Kochanska, Coy, & Murray, 2001) or delay of gratification (Mischel, Shoda, & Rodriguez, 1989). In addition to demonstrating the importance of environmental and socialization factors (e.g., adults labeling the child as “patient,” thereby conveying an expectation of behavior; Toner, Moore, & Emmons, 1980), this literature supports the idea that early self-restraint depends substantially on “effortful control,” a trait-like (Kochanska & Knaack, 2003), genetic (Rothbart & Rueda, 2005) aspect of temperament related to the development of the frontal lobes and executive functions (EFs; Eisenberg, Smith, Sadovsky, & Spinrad, 2004; Posner & Rothbart, 2000; Rueda, Posner, & Rothbart, 2005).
Although there is evidence that aspects of self-restraint are linked to EFs in both childhood (e.g., Kochanska, et al., 2001; Posner & Rothbart, 2009) and adolescence (e.g., Nigg et al., 2006; Young et al., 2009), it is still unclear whether these associations are longitudinal across a long age range. Moreover, the relation of individual differences in developmental patterns of self-restraint across childhood to later EFs has not been examined. The current study fills these gaps in the literature by addressing three primary questions: (1) Are there distinct developmental trajectories for growth in self-restraint that may predict future EFs? (2) If early individual differences in self-restraint and in growth trajectories of restraint provide a preview of later EFs, are some EFs more strongly related to self-restraint than others? And (3) What is the etiology of these relations — are genetic influences on EFs (Friedman et al., 2008) evident even in early childhood behavior? To address these questions, we report a longitudinal twin analysis examining how toddlers’ self-restraint, measured in a compliance task from ages 14 to 36 months, relates to individual differences in multiple EFs, measured with latent variables at age 17 years.
Development of Early Childhood Self-Regulation and Executive Functions
The first question involves individual differences in the development of self-restraint as predictors of EFs. Results from studies that focused on the early (preschool) development of restraint support the conclusion that absolute levels of self-restraint increase with development, though there is also stability with respect to individual differences across time points. Kochanska and colleagues have extensively investigated both “do” and “don’t” compliance tasks, which entailed cleaning up toys with the mother and observing a mother’s prohibition against touching “off-limits” toys, respectively. Children show considerable growth in their abilities to comply with “do” or “don’t” commands, particularly in the first four years of life (e.g., Kochanska, Tjebkes, & Forman, 1998; Kochanska et al., 2001; Schneider-Rosen & Wenz-Gross, 1990). Kochanska et al. (2001) found that compliance with maternal requests (at 14, 22, 33, and 45 months of age) increased across time, but also showed modest stable individual differences, in that compliance task performance correlated across time and was also predicted by “restraint” (not touching an attractive plant placed nearby) at age 8–10 months (Kochanska et al., 1998). Vazsonyi and Huang (2010) also found improvements in self-control (parent-rated) from ages 4.5 to 10.5 years, along with considerable stability (reflected in time-to-time correlations between .49 and .70).
Moreover, self-restraint seems to correlate with EFs longitudinally, at least across short time spans of a few years. Kochanska et al. (2001) found that compliance with “don’t” commands was related to inhibitory abilities (stopping responses, resisting interference, slowing down motor actions, lowering voice, as well as delaying eating candy or opening a gift). These relations were both concurrent and longitudinal, with “don’t” compliance at 14 months correlating .25 (N=101) with inhibitory control at 45 months. These longitudinal relations suggest that self-restraint may have trait-like qualities.
Studies examining more long-term relations indicate that early individual differences in self-restraint, particularly delay of gratification, also predict later cognitive and social outcomes in adolescence such as behavior problems, drug use, and academic performance (e.g., Block, Block, & Keyes, 1988; Caspi, Henry, McGee, Moffit, & Silva, 1995; Mischel, Shoda, & Peake, 1988). For example, Mischel et al. (1988) found that children who were able to delay gratification longer when they were 4 years old were rated higher on a number of cognitive, academic, and social competencies by their parents 10 years later. Block et al. (1988) found that preschool teachers’ ratings of children aged 3–4 years on “ego-undercontrol” (unable to delay gratification, more emotionally labile, etc.) predicted those children’s drug use at age 14.
As many self-regulation problems have also been linked to EF deficiencies (e.g., Nigg et al., 2006; Young et al., 2009), individual differences in EFs might mediate these links. Before exploring such a possibility, though, it is important to know whether early self-restraint does in fact predict EFs beyond early childhood. However, most longitudinal studies of the relations of self-restraint to EFs have spanned relatively short time periods. As mentioned earlier, early self-restraint’s relations to later EFs extend at least a few years (e.g., Kochanska et al., 2001), but it is still possible that early self-regulation abilities might not forecast later individual differences in EFs in adulthood. One study that has examined this relationship across a long time range found mixed results (Eigsti et al., 2006): Though the amount of time preschoolers directed their attention away from a tempting reward in a delay of gratification task predicted later “efficiency” on a go/no-go test at age 18 (speed on go trials), it was not related to more traditional go/no-go indicators of inhibitory ability (false alarms or misses). Eigsti et al. (2006) also did not find a relation between the actual amount of time the children could delay gratification and overall go/no-go performance. Such weak associations may be a result of measurement issues, as noted by Eigsti et al. (2006), but they may not be surprising given that the development of EFs and self-regulation continues well into adolescence. Adolescence is a period of substantial brain maturation and reorganization, particularly in areas important for EFs (Crone, 2009; Steinberg, 2005). Such drastic developmental changes may weaken links between early childhood behavior and later EF abilities.
In the current study, we investigated the development of self-restraint and later EFs at two levels. At the first level, we examined individual differences in the growth of self-restraint (compliance with an experimenter’s prohibition against not touching an attractive toy) from ages 14 to 36 months. Though the general pattern of increased self-restraint across time has been established in previous studies, individual differences in developmental trajectories across early childhood have not been systematically examined. That is, are there different profiles of development, and if so, what form do they take? One could imagine a number of different trajectories: children starting out at different levels and maintaining these differences across time (parallel trajectories), groups with faster development (different slopes), groups that “catch up” with their peers, etc. Hence, in this study we examined growth in self-restraint across 4 time points (14, 20, 24, and 36 months), using latent class growth modeling. This type of modeling allows empirical identification of groups characterized by different growth curves, the shape of those trajectories, and how many individuals fall into each group.
At a broader level, we examined whether different growth trajectories longitudinally predict EF abilities, measured with latent variables based on laboratory-based cognitive tasks at age 17. It is possible that individuals with better restraint and/or faster growth in self-restraint in early childhood end up with better EF abilities at age 17. However, it is also possible that children who start out low in self-restraint or develop restraint more slowly nevertheless eventually catch up to their peers, with little association with where they end up at the end of adolescence. By adding EF measures as distal outcome variables to the latent class growth model, we can test whether groups showing different developmental trajectories show significant differences in later EF abilities.
Multidimensionality of Executive Functions
The second question examined in this study concerns whether early self-restraint may differentially predict separable components of EFs. Many studies examining the relation of early self-restraint to “effortful control” have conceptualized EFs as a fairly general construct, encompassing inhibition, error detection, and planning (Rothbart & Rueda, 2005), though task-based (as opposed to parental questionnaire) individual difference measurements have tended to focus on inhibition-related (response inhibition or conflict) tasks (e.g., Kochanska et al., 2001; Kochanska, Murray, & Harlan, 2000; Posner & Rothbart, 2009). However, current research indicates that EFs show both “unity and diversity.” The unity is reflected in the fact that different EFs correlate (they tap a general EF ability); the diversity is reflected in the fact that they are separable (the correlations are significantly lower than 1.0). Empirical studies have demonstrated this general pattern in young adults (Fournier-Vicente, Larigauderie, & Gaonac’h, 2008; Friedman et al., 2008; Miyake et al., 2000) as well as children (Huizinga, Dolan, & van der Molen, 2006; Lehto, Juujärvi, Kooistra, & Pulkkinen, 2003; van der Sluis, de Jong, & van der Leij, 2007), even though specific factor structures varied somewhat across studies. Recent studies have also found this unity and diversity of EFs in terms of brain localization (Collette et al., 2005; Sylvester et al., 2003) and genetic influences (Friedman et al., 2008). Hence, in examining the longitudinal relation between early self-restraint (as measured by “don’t” compliance), we draw on a unity/diversity framework of EFs (Friedman et al., 2008; Miyake et al., 2000). Considering the unity and diversity of EFs has been important to understanding their relations to other constructs of interest, as they are differentially related to various aspects of behavior and cognition, such as attention and behavioral problems or IQ (Friedman et al., 2006, 2007, 2009; Young et al., 2009).
To capture individual differences in EFs, we used a latent variable approach. A latent variable is a statistical extraction of the variance common to multiple tasks selected to tap the same underlying construct. We consider the use of latent variables especially important to studying EFs, because it reduces the “task impurity” problem that is particularly salient for EF tasks (Burgess, 1997; Miyake et al., 2000; Phillips, 1997): Given that EFs by definition must operate within the context of lower-level, domain-specific processes, individual differences in these other non-EF processes may contribute substantially to individual differences in task performance. By selecting multiple tasks that differ in the non-EF requirements and extracting what is common, one can separate the EF-related from the non-EF-related individual differences, resulting in a purer measure of EF that is also relatively free of measurement error (Bollen, 1989).
In our research, we have studied three EFs that are arguably the most commonly discussed in the literature: inhibiting prepotent or automatic responses (Inhibiting), monitoring and updating the contents of working memory by adding new relevant information and deleting no-longer relevant information (Updating), and shifting between tasks or mental sets (Shifting). Because of the unity and diversity of EFs, each EF variable can really be thought of as a composite of multiple sources of variance, as illustrated in Figure 1: variance that is common to all three EFs (Common EF), and variance that is specific to that EF. Hence, one can represent the data in complementary ways; one is a “correlated factors” model of EFs, in which three EF latent variables are correlated, as shown in Figure 2A. In this model, each EF variable (Inhibiting, Updating, and Shifting) is represented as one ability, with the unity of EFs represented in the correlations among the EFs, and the diversity represented in the fact that these correlations are lower than 1.0, hence suggesting some separability. Recently, Friedman et al. (2008) implemented a latent variable model that captures the unity and diversity of EFs more directly. In this “nested factors” model (shown in Figure 2B), a “Common EF” factor loads directly on nine tasks selected to tap Inhibiting, Updating, and Shifting. This factor represents the unity of EFs. In addition, two specific factors load on the Updating and Shifting tasks, respectively, representing the fact that these two EFs involve abilities beyond what is common to all three EFs (i.e., diversity). Friedman et al. (2008) found that individual differences in Inhibiting were entirely explained by what is common to all three EFs; hence, there is no Inhibiting-specific factor.
Figure 1.

Schematic representation of the unity and diversity of three EFs. Each EF (e.g., Updating) is really a combination of what is common to all three EFs (Common EF), and what is specific to that EF (e.g., Updating-specific).
Figure 2.

Two complementary parameterizations of the EF data, updated from Friedman et al. (2008). Numbers on arrows are standardized factor loadings, those under the smaller arrows are residual variances, and those on curved double-headed arrows are inter-factor correlations. In the correlated factors model (Panel A), there are three correlated EF latent variables predicting three tasks each. In the nested factors model (Panel B), there is a Common EF latent variable on which all nine executive function tasks load, as well as two “nested” latent variables on which the updating and shifting tasks, respectively, also load. The Common EF variance turned out to be isomorphic with the Inhibiting latent variable (see Friedman et al., 2008), so there was no inhibiting-specific variance. Because the Common EF factor captures the variance common to all three EFss, the Updating-specific and Shifting-specific factors capture the variance that is unique to updating and shifting, respectively. Hence, they are uncorrelated with the Common EF factor and with each other. All parameters were statistically significant (p < .05). Antisac = antisaccade, Stop = stop-signal, Letter = letter memory, S2back = spatial 2-back, Number = number-letter, Color = color-shape, Category = category-switch.
Our interpretation of the Common EF variable is that it in large part reflects the ability to actively maintain goals and goal-related information, often in the face of interference (Friedman et al., 2008), and to use these goals to bias ongoing processing (i.e., top-down attention). This goal maintenance is a crucial requirement of all the tasks and may be particularly influential in response inhibition tasks and tasks that involve conflict (which many of our EF tasks do), a view consistent with goal-directed views of inhibitory control (Kane & Engle, 2003; Morton & Munakata, 2002). This strong influence of goal maintenance on response inhibition tasks may explain why there was no Inhibiting-specific variance in addition to Common EF explaining the correlations among inhibiting tasks (Friedman et al., 2008).
In the current study, we used this unity/diversity framework to examine how early self-regulation relates to common and specific variance in later EFs. Though these EF components do not necessarily map clearly onto EFs assessed in early developmental studies of self-restraint, there are similarities that may enable some predictions. Hughes and her colleagues (Brody, Taylor, & Hughes, 2002; Hughes, Dunn, & White, 1998) found that “hard to manage” children—those who scored at or above the 90th percentile for the hyperactivity or conduct disorder subscales of a parent-ratings on the Strengths and Difficulties Questionnaire at approximately age 4 years—showed poor inhibition at ages 4 years (a detour-reaching box task and a response conflict task) and 7 years (go-no-go). These findings, along with Kochanska and colleagues’ work associating “don’t” compliance with inhibitory abilities (e.g., Kochanska et al., 2001), suggest that early self-restraint may be most closely related to Common EF abilities. Indeed, it would make sense that the ability to actively maintain a key task goal (i.e., the “don’t touch” prohibition), an ability that we hypothesize reflects Common EF, would be critical to success in a “don’t” compliance task.
Regarding the diversity aspect of EFs, the existing literature does not afford clear predictions, because previous studies have not isolated what is specific in working memory updating and set shifting from variance attributable to Common EF. Moreover, the literature is somewhat inconsistent as to whether early self-regulation is related to working memory updating and set-shifting abilities, even without partialling out Common EF. For example, Hughes et al. (1998) found that the “hard to manage” children showed poorer performance in one measure of working memory/planning (the Tower of London task, but not an auditory sequencing task) and one measure of set-shifting (a task requiring putting colored marbles into tubes according to a specified sequence, but not a card sorting task). However, Brody et al. (2002) found in the same sample that the “hard to manage” children showed relatively intact working memory and planning (Tower of London) and set-shifting abilities (intradimensional/extradimensional set-shifting) at age 7. Given these inconsistencies, we did not have strong predictions about the relations of compliance task performance to Updating-specific and Shifting-specific abilities.
We also included a measure of full-scale IQ for comparison. Duckworth and Seligman’s (2005) finding that that 8th-graders’ “self-discipline” (measured as a composite of delay of gratification and self, parent, and teacher rated self-control) predicted academic achievement over and above IQ suggests that self-restraint may be measuring something different from or in addition to IQ. If this something is related to EFs, we would expect self-restraint to predict EFs even when the variance due to IQ is partialled out of those EF measures. Conversely, given that IQ is closely related to EFs, particularly Common EF and Updating-specific (Friedman et al., 2008), it is possible that a relation between self-restraint and IQ might be mediated by these EFs.
Etiology of Relations Between Self-Restraint and Executive Functions
The third question we examined involves the etiology (genetic, environmental, or both) of the relation between individual differences in early self-restraint and later EFs, if such a relation exists. The twin methodology can be used to address this issue through comparison of the twin relations for monozygotic (MZ, or identical) twins and dizygotic (DZ, or fraternal) twins. Because MZ twins share all their genes, whereas DZ twins share on average half of their segregating genes by descent, and because both types of twins are reared together (i.e., have the same shared familial environment), higher MZ correlations within twin pairs than DZ correlations for a behavioral measure suggest a genetic influence.
Structural equation “ACE” models (Neale & Cardon, 1992) provide estimates of the proportions of variance in performance due to additive genetic (A; heritability), shared family environmental (C), and nonshared environmental (E) influences. Extending these models to include other measures (multivariate ACE models) allows for the examination of genetic and environmental correlations. For example, the extent to which the genetic variance in one measure (i.e., the A component for self-restraint) correlates with the genetic variance in another (e.g., the A component for Common EF ability) represents the genetic correlation between the two constructs. Hence, in this study, we used multivariate ACE modeling to estimate the genetic and environmental contributions to the development of self-restraint and examined whether those genetic and environmental influences overlap with those for age-17 EFs.
To our knowledge, the heritability of a compliance task has not been examined, though a number of studies have documented environmental influences such as parenting style and emotional availability (e.g., Braungart-Rieker, Garwood, & Stifter, 1997; Kochanska et al., 2001; Lehman, Steier, Guidash, & Wanna, 2002; van der Mark, Bakermans-Kranenburg, & van Ijzendoorn, 2002). These results suggest that at least some individual difference in performance on a compliance task might stem from shared environmental influences. Parent reports of the their children’s inhibitory control in various situations showed shared environmental (26%) as well as nonshared environmental (16%) and genetic (58%) influences (Gagne & Saudino, 2010). However, Gagne and Saudino (2010) also found that a composite observational measure of the same children’s inhibitory control (including measures of delay tasks requiring children to wait before opening a gift or eating a snack and a task requiring children to pick only one toy from an selection of six) was 38% heritable in two-year olds, with the remaining variance (62%) due to nonshared environment. Hence, there is some evidence for genetic influences on self-restraint, but the nature of environmental influences (shared vs. nonshared) remains unclear and may depend on the specific task used and the methodology (parent report vs. observed).
As for EFs, twin studies of parent-reported effortful control from preschool to adult age ranges have resulted in heritability estimates from 43% to 79% (Goldsmith, Buss, & Lemery, 1997; Lemery-Chalfant, Doelger, & Hill, 2008; Yamagata et al., 2005), smaller estimates of shared environment (0% to 12%), and moderate estimates of non-shared environment (22% to 54%). Polderman et al. (2007) found moderate to high heritability (52% to 73%) for processing speed in selective attention, working memory, and sustained attention tasks at ages 5 and 12, with no significant influences of shared environment at either age. They also found that age 5 to age 12 relations in these measures were due to common genetic influences. Other studies have found evidence for heritability of performance on individual EF tasks such as the Stroop task at various ages (e.g., Polderman et al., 2009; Stins, van Baal, Polderman, Verhulst, & Boomsma, 2004), though some studies have found that AE and CE models for some tasks fit equally well (e.g., Groot, de Sonneville, Stins, & Boomsma, 2004; Polderman et al., 2007). Friedman et al. (2008) documented that individual differences in multiple EFs, measured as latent variables, are highly heritable at age 17 (76%–100%). Hence, to the extent that there is a link between early self-restraint and later EFs, this link is likely to be at least somewhat genetic in origin and is unlikely to reflect large contributions from shared environment.
Method
Participants
Participants were 945 individual twins (468 male; 477 female) from 473 families in the Colorado Longitudinal Twin Study (Rhea, Gross, Haberstick, & Corley, 2006). The total sample in the current analyses consisted of all individuals (out of 964 enrolled in the longitudinal study) with latency data for the self-restraint task at one or more time points (819 individuals) and/or cognitive (EFs or IQ) data (813 individuals). The cognitive data in the current study consisted of those from the 582 individuals reported in the Friedman et al. (2008) study and those from an additional 231 individuals who completed testing since those analyses (the remainder of the sample), for a total of 813 individuals from 409 families: 435 MZ (228 female, 207 male) twins and 378 DZ (192 female, 186 male) twins (7 co-twins did not participate). Because the results remain essentially the same as those reported by Friedman et al. (2008), the updated EF results are reported in Appendix A.
Of the 797 participants who completed the EF testing session, 114 were missing data for one or more EF tasks because of colorblindness, equipment malfunction, failure to understand or follow task instructions, or chance-level accuracy (see Table 1 for ns). Where appropriate (i.e., for the antisaccade, stop-signal, number-letter, color-shape, and category switch tasks), the criterion for chance performance for each task was calculated as the binomial probability that the participant would have obtained that score by chance, with p < .01. Included in this count of 114 were 11 participants for whom all EF data were unusable for the following reasons: There were problems in the testing environment (n = 2); the participants were unable to understand instructions (n = 1); or the participants’ data were suspect because they did not follow directions (n = 1); they showed chance-level performance on at least 5 individual tasks (n = 6); or they showed clear signs of fatigue (n = 1). Although these participants’ EF data were excluded from the analyses, their IQ data from the earlier session were included in the analyses.
Table 1.
Descriptive Statistics for the Cognitive Measures
| Task | N | Mean | SD | Min | Max | Skewness | Kurtosis | Reliability |
|---|---|---|---|---|---|---|---|---|
| Antisaccadea | 779 | 1.04 | 0.20 | 0.47 | 1.57 | −0.12 | −0.26 | .89b |
| Stop-signal | 741 | 282 ms | 63 | 151 | 489 | 1.13 | 1.51 | .75b |
| Stroop | 759 | 214 ms | 90 | 0 | 488 | 0.59 | 0.19 | .91b |
| Keep tracka | 774 | 0.94 | 0.18 | 0.38 | 1.49 | 0.31 | 0.56 | .65c |
| Letter memorya | 785 | 1.09 | 0.25 | 0.38 | 1.57 | 0.29 | −0.20 | .62c |
| Spatial 2-backa | 777 | 1.17 | 0.17 | 0.65 | 1.57 | −0.93 | 1.65 | .90c |
| Number letter | 776 | 331 ms | 183 | −14 | 923 | 1.04 | 1.12 | .86b |
| Color shape | 768 | 331 ms | 189 | −196 | 916 | 0.76 | 0.75 | .85b |
| Category switch | 766 | 333 ms | 181 | −34 | 899 | 0.98 | 0.92 | .83b |
| WAIS-IQ | 812 | 102 | 11 | 70 | 142 | 0.21 | 0.24 | .97d |
Note. Min = minimum; Max = maximum.
Accuracy scores were arcsine transformed.
Internal reliability was calculated by adjusting split-half or part1–part2 correlations with the Spearman–Brown prophecy formula.
Internal reliability was calculated using Cronbach’s alpha.
Internal reliability fromWechsler, 1997.
Zygosity was determined through repeated tester ratings combined with DNA genotyping. There were 259 monozygotic (MZ) and 212 dizygotic (DZ) families. In addition, there were two families of undetermined zygosity, but their data were not included in the genetic analyses (neither had cognitive data).
All research protocols were reviewed and approved by the University of Colorado’s Institutional Review Board. Parental permission and informed consent or assent was obtained from each participant or parent, as appropriate, at each assessment.
Materials, Design, and Procedure
Prohibition task
The prohibition task was administered in the children’s homes when they were 14, 20, 24, and 36 months old, along with a number of other tasks not analyzed here (the home visits lasted 2 to 2.5 hours and included observational measures of anger, empathy, social interaction, and language development; see Robinson, McGrath, & Corley, 2001). The participant was seated at a table or high chair next to the experimenter. A parent was present but instructed to remain neutral. The experimenter drew the child’s attention to an attractive toy (a glitter wand), made eye contact with the child, placed the toy on the table and said “Now, [child’s name], don’t touch,” then looked away. The experimenter released the prohibition by saying “It’s okay, you can touch it now” after the child touched the toy or after 30 seconds if the child did not touch. The dependent measure was the latency to touch the toy, with latencies ≥ 30 s indicating the child did not touch the toy before the prohibition was released.
Cognitive measures
Participants completed 11 subtests of the Wechsler Adult Intelligence Scale (WAIS) III (Wechsler, 1997) at approximately age 16 (M = 16.6, SD = 0.8, Range = 15.8 to 20.0) and completed the nine EF tasks at a separate testing session at approximately age 17 years (M = 17.3, SD = 0.6, Range = 15.8 to 20.1). Tasks were administered in a fixed order (no two tasks tapping the same EF presented sequentially), with breaks every 40–50 min.
The following descriptions summarize the essential characteristics of the EF tasks. More details can be found in the Friedman et al. (2008) article. All tasks were programmed in Psyscope 1.2.5 (Cohen, MacWhinney, Flatt, & Provist, 1993) and presented on Macintosh iBook laptops. Reaction times (RTs) were measured with a button box with ms accuracy. Stimuli appeared in a random order that was fixed for all participants. Each task included additional practice trials to ensure that the participants understood the instructions and knew the button-response mappings.
Inhibiting tasks
The Inhibiting tasks required participants to either withhold a response (stop-signal) or execute a subdominant response in the face of a more dominant response (Stroop and antisaccade). On each trial of the antisaccade task (Roberts, Hagan, & Heron, 1994), a small visual cue briefly flashed on one side of the computer screen for 150 ms, followed by a target (a box containing an arrow pointing left, right, or up) that appeared for 175 ms before being masked. To see the target for long enough to identify the direction of the arrow, participants had to inhibit the automatic tendency to saccade to the cue and instead immediately saccade in the opposite direction. The dependent measure was the proportion of correctly identified arrows out of 90 trials.
On each trial of the stop-signal task (Logan, 1994), participants classified one of 24 words as animals or nonanimals. After a block of 48 trials (used to build up a prepotent response and calculate average response speed), they completed 4 blocks of 96 trials each that also included stop signals (25% of trials)—auditory tones signaling the participant to withhold the response on that trial. Hence, the participants had to inhibit the tendency to categorize the word, which by that point had become somewhat automatized, on these trials. The stop signals appeared at 3 different delays after the onset of the word (50 ms after trial onset, 225 ms before the participant’s average RT, or 50 ms before his or her average RT). The dependent measure was stop-signal RT, the estimated time needed to stop the response (calculated by subtracting each delay from the RT corresponding to the percentile at which the participant could stop at that delay, then averaging across the three delays).
In the Stroop task (based on Stroop, 1935), participants named the font colors of incongruent color words (e.g., say “blue” when presented with the word RED printed in blue), filler non-color words, and strings of asterisks matched in length to the words (60 trials of each type). Hence, on incongruent trials they had to resist the dominant tendency to read the words. RTs were recorded via a microphone attached to the button box. The dependent measure was the difference between the average RTs for the incongruent and those for asterisks trials.
Updating tasks
The three Updating tasks required participants to actively maintain information in working memory, but also continuously update that information, adding new information and deleting or replacing old information when appropriate. At the beginning of each of the 12 trials of the keep track task (adapted from Yntema, 1963), participants were given 2, 3, or 4 target categories (e.g., animals and countries). After viewing a serial list of 15 words drawn from 6 categories, they had to recall the last exemplar of each target category. Because each list contained 2–3 exemplars of each category, they had to update which exemplars to remember during the lists. The target category names stayed on the screen during the list but disappeared for the recall period. The dependent measure was the proportion of the words correctly recalled out of 12 trials (maximum of 36 total words).
In each of 10 trials in the letter memory task (Morris & Jones, 1990), participants saw series (unpredictable lengths of 5, 7, or 9 letters long) of letters appear on the screen for 2.5 s each. At the end of the series, they reported the last 3 letters. The dependent measure was proportion correct (out of 30 letters). To ensure they used an updating strategy, for each letter, the participant had to say aloud the past three letters, adding the new letter and dropping no longer relevant letters.
In the spatial 2-back task, participants saw 10 squares scattered across the computer screen. On each trial, one square flashed for 500 ms followed by a 1500 ms blank period. The participant had to decide whether that square was the same as the one that had flashed 2 trials earlier. Twenty-five percent of the trials were 2-back trials, and there were no “lure” trials that matched the trials one or three trials back. The dependent measure was the proportion of correct responses (with omissions counted as errors) across four blocks of 24 trials each.
Shifting tasks
The three Shifting tasks required participants to flexibly switch between two categorization tasks, depending on a cue that appeared on the screen 150 ms before the stimulus. Participants used the same two buttons for each subtask. Hence, these tasks involved resolving response conflict as well as shifting mental set. There were two blocks of 48 trials each that contained equal proportions of switch (i.e., the cue changed from the preceding trial) and no-switch (the cue was the same as in the previous trial) trials in each block. The dependent measure was the switch cost, the difference between average RTs on switch and no-switch trials.
The number-letter task (adapted from Rogers & Monsell, 1995) required switching between categorizing the number or letter in a number-letter or letter-number pair (e.g., 7G) as odd/even or consonant/vowel, respectively. The pairs appeared in a square above or below the center of the screen (marked with a line), with position indicating which task to perform. In each trial of the color-shape task (Miyake, Emerson, Padilla, & Ahn, 2004), participants saw a colored rectangle with a shape in it. Depending on a cue letter, the participant had to categorize the color as red/green or the shape as circle/triangle. In the category-switch task (adapted from Mayr & Kliegl, 2000), participants saw a word (e.g., shark) that could be categorized along two dimensions (living/non-living, or bigger/smaller than a soccer ball). A symbol above the word indicated which dimension to use.
IQ
Full-scale IQ was computed from scaled scores for 11 subtests of the WAIS III (Wechsler, 1997).
Statistical Procedures
Data transformations and analyses
Latencies for the prohibition task were not normally distributed, making them inappropriate for confirmatory factor analysis. Hence, we binned the latencies to create categorical variables with three bins: 0–10s, 11–29s, and ≥30s (the last bin represents the children who did not touch before the prohibition was released). We also tried several other sets of cutoff points with more bins (up to five), with essentially the same results. Hence, we selected this small number of bins because it allows for the simplest description of the data.
Appropriate trimming and transformations were used to ensure normal distributions for the continuous EF variables, as described in detail in the Friedman et al. (2008) article. Briefly, we used the arcsine of the proportion correct for accuracy measures to improve normality, and RT measures depending on mean RTs (all except stop-signal) were subjected to within-subjects trimming robust to nonnormality (Wilcox & Keselman, 2003) to obtain the best measure of central tendency. RTs for error trials and RTs < 200 ms were eliminated, and for the three Shifting tasks, RTs for trial following errors were also eliminated (because the correct set might not have been achieved). Average accuracy was greater than 92% in all RT tasks. To reduce the influence of extreme scores and improve normality, observations farther than 3 SDs from the group mean were replaced with values 3 SDs from the mean for each variable used in the models except full-scale WAIS-IQ. This procedure affected no more than 2.0% of the observations for any measure. After these transformations and trimming, the variables showed acceptable skewness and kurtosis (Table 1). In all analyses, the directionality of the RT measures was reversed so that for all measures, higher scores indicated better performance.
Model estimation
We used Mplus 5.21 (Muthén & Muthén, 1998–2007) for the analyses, including participants with missing data for one or more measures. Genetic model fits including categorical data were assessed with WLSMV χ2 (weighted least squares, mean- and variance-adjusted chi-square) statistic. Because the χ2 is sensitive to sample size, we also used confirmatory fit index (CFI) > .95 and root-mean-square error of approximation (RMSEA) < .06 as indicators of good fit (Hu & Bentler, 1998), though CFI > .90 is commonly used as an indication of adequate fit. The latter two statistics were not available for the latent class growth model (which was a mixture model fit with maximum likelihood with numerical integration), so fit was assessed with the likelihood ratio χ2 for the ordinal outcomes. Statistical significance of parameters of interest was tested with χ2 difference (χ2diff) tests. For the genetic models using WLSMV, we used the difftest procedure in Mplus to calculate difference tests. To correct for the nonindependence of the twin pairs in the phenotypic analyses, we used Mplus’s TYPE=COMPLEX option to obtain a scaled χ2 and standard errors robust to nonindependence and used scaled χ2diff tests (Satorra & Bentler, 2001) for nested model comparisons.
Results and Discussion
Phenotypic Analyses
Development of self-restraint: growth modeling
The first question we asked was whether there are distinct developmental trajectories for growth in self-restraint that may predict future EFs. As shown in Table 2, the twins showed considerable growth in their tendency to comply with the “don’t touch” command, with about 11% waiting at least 30 s at 14 months to 65% waiting 30 s at 36 months. The polychoric correlations across ages suggested some stability in self-restraint, with an age 14 month to 36 month correlation of r(607) = .30, p < .001.
Table 2.
Descriptive Statistics and Polychoric Correlations for the Binned Latency Scores at Ages 14–36 Months
| Age | n | % in Latency Bins | Polychoric Correlationsa | |||||
|---|---|---|---|---|---|---|---|---|
| 0–10 s | 11–29 s | 30+ s | 14 mo. | 20 mo. | 24 mo. | 36 mo. | ||
| 14 months | 760 | 73.3 | 15.3 | 11.4 | -- | |||
| 20 months | 676 | 51.0 | 15.4 | 33.6 | .21 | -- | ||
| 24 months | 671 | 33.2 | 11.0 | 55.7 | .21 | .26 | -- | |
| 36 months | 658 | 22.2 | 13.2 | 64.6 | .30 | .19 | .36 | -- |
Note. Correlations estimated with Mplus based on all data (total N = 819).
All p < .05.
To characterize individual differences in the development of self-restraint, we used latent class growth modeling. This technique provides an efficient way of characterizing individual differences in growth trajectories through estimation of latent intercept and slope variables. All four time points load at 1.0 on the intercept variable, and all but the initial time point load on the slope. To capture the nonlinearity of the growth curves, we freed the loadings of the 20 and 24 month variables on the slope (rather than fixing them to represent a linear, quadratic, etc. curve). With this parameterization, the intercept can be interpreted as the initial level of self-restraint and stable variance associated with this initial level, while the slope represents changes across time. From these intercept and slope variables, a categorical “class” variable can be used to classify the trajectories into groups (as many groups as indicated by the data). Models with 1, 2, 3, and 4 classes were estimated, and the number of latent classes was determined by comparing the Bayesian Information Criterion (BIC) for models with different numbers of classes: The optimal number of classes is suggested by the model with the lowest BIC (Nylund, Asparouhov, & Muthén, 2007).
The latent class growth model suggested that two classes were needed to fit the data. A model with one class provided a poor fit, χ2(75) = 197.92, p < .001, BIC = 4993.03. In contrast, the two-class model provided a good fit, χ2(72) = 90.88, p = .066, BIC = 4906.12, with a nonsignificant chi-square and a lower BIC. Models with 3 and 4 classes provided higher BIC values (4920.25 and 4937.19, respectively) than the two-class model, indicating that more than two classes were unnecessary for capturing individual differences in growth.1
Figure 3 shows the growth trajectories for the two groups identified by the latent class model, in terms of each group’s probability of touching the toy between 0 and 10 s (top panel), between 11 and 29 s (middle panel), and after the prohibition was released (≥ 30 s; bottom panel). Odds ratios indicated that the two groups significantly differed in their latencies at every time point (all ratios > 3.81, zs > 3.46, ps < .001). As indicated by the low probabilities in the middle panel (latencies between 11 and 29 s), children tended to either touch the toy quickly or successfully wait. As shown in the top and bottom panels of Figure 3, the less-restrained group (Group 1: 45% of the sample) started out at 14 months more likely than the more restrained group (Group 2) to touch the toy within the first 10 s (top panel; 87% vs. 64%), and less likely to wait until the prohibition was released (bottom panel; 6% vs. 21%). As shown in the bottom panel, the less restrained group also seemed to show a shallower growth curve (ending up with only a 38% probability of waiting at least 30 s at age 36 months, vs. the 86% probability of waiting in the more restrained group).
Figure 3.
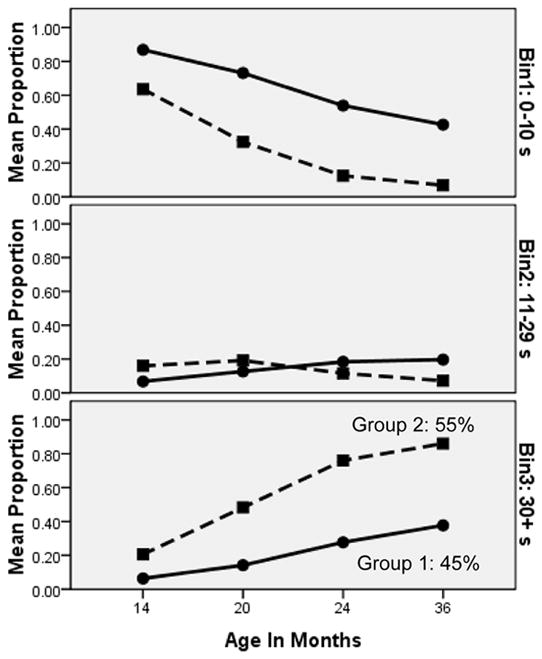
Growth trajectories for the two classes identified in the latent class growth model. Each panel shows the two groups’ trajectories on that particular latency bin, with the bottom panel showing the proportion waiting 30 s or more (until after the prohibition was released) to touch the toy. Group 1 (55% of the sample) showed more restraint, with a higher probability of being in the 30+ s bin and a lower probability of being in the 0–10 s bin at each time point.
The latent class model provides information about means for the latent intercept and slope variables for the different classes identified. The two groups both showed significant growth across time, indicated by significant means for their latent slope variables, both zs > 4.33, ps < .0001. To gain more insight about the nature of the differences between the two groups, we used model comparisons to assess whether these means significantly differed, by testing whether constraining them to be equal significantly worsened model fit. These comparisons indicated that the difference in the means of the latent intercepts was significant, χ2diff(1) = 70.80, p < .001, and the difference in the means of the latent slope variables was marginally significant, χ2diff(1) = 3.74, p = .053. Hence, the growth trajectory for the more restrained group started with a significantly higher intercept than that for the less restrained group, and the more restrained group also showed a marginally significantly faster rate of growth than the less restrained group.
Relationship of self-restraint to later EFs and IQ
The second question we examined was whether individual differences in the developmental trajectories of self-restraint predicted later EFs. To do so, we added the nested factors EF model (Figure 2B), along with WAIS-IQ for comparison, to the latent class growth model. Doing so is equivalent to regressing the EF components on class membership, resulting in an estimate of the mean difference (in SD units, equivalent to Cohen’s d) between the groups for each EF component (Muthén & Muthén, 1998–2007). As shown in Table 3 (top row), the more restrained group showed higher Common EF ability (0.60 SD) and WAIS-IQ (0.48 SD), lower Shifting-specific ability (−0.42 SD), and equivalent Updating-specific ability (0.05 SD) compared to the less restrained group. These effect sizes are equivalent to correlations of .29 with Common EF, .02 with Updating-specific, −.21 with Shifting-specific, and .23 with WAIS-IQ (Cohen, 1988).2
Table 3.
Standard Deviation Differences in Cognitive Ability Means Associated with Membership in the More Restrained Group (Within the Latent Class Growth Model) and Latencies at Ages 14–36 Months
| Prohibition Measure | Common EF | Updating- specific | Shifting- specific | WAIS-IQ |
|---|---|---|---|---|
| Restraint group membershipa | 0.60* | 0.05 | −0.44* | 0.48* |
|
| ||||
| Latency to touch at each ageb | ||||
| 14 months | 0.32† | 0.10 | −0.08 | 0.21† |
| 20 months | 0.28* | −0.15 | −0.20 | 0.14 |
| 24 months | 0.25 | 0.08 | −0.18 | 0.23* |
| 36 months | 0.28† | 0.04 | −0.13 | 0.25* |
p<.05,
p<.10, determined with chi-square difference tests.
SD difference in means for the more restrained class – less restrained class, estimated within the growth model.
SD difference in means for individuals waiting 30+ seconds – means for those waiting 0–10 seconds, corresponding to a linear contrast.
Results were similar when the EF latent variables and IQ were regressed on self-restraint at each time point (Table 3, lower rows), though the magnitudes of the effects were much smaller. The latter models all provided reasonable fits to the data, all χ2(33) < 75.01, p < .001, CFI > .965, RMSEA < .038.
As discussed earlier, this model represents the three EFs of Inhibiting, Updating, and Shifting in terms of their common and specific components. That is, Updating = Common EF + Updating-specific and Shifting = Common EF + Shifting-specific. This separation proved to be particularly important in understanding the relations of self-restraint to EFs. When the correlated factors EF model (Figure 2A) was included in the latent class growth model instead of the nested factors EF model, the more restrained group scored 0.64 SD higher on Inhibiting, 0.39 SD lower on Updating, and not significantly higher (0.14 SD) on Shifting than the less restrained group, χ2diff(1) = 9.48, p = .002 for Inhibiting; χ2diff(1) = 8.15, p = .004 for Updating; and χ2diff(1) = 0.75, p = .386 for Shifting. Hence, when the three EFs were treated as correlated factors, both Inhibiting and Updating were related to self-restraint, but Shifting was not. Comparing these results with those for the model with the three EFs separated into common and unique variance, it is clear that the association with Updating was due to the Common EF aspect of Updating and not to the Updating-specific aspect, and that the low positive association with Shifting was actually due to the fact that self-restraint predicts the two components of Shifting (i.e., Common EF and Shifting-specific) in opposite directions, resulting in a null overall effect.
The relationship between Restraint Group and IQ was expected, given that WAIS-IQ correlated with the three EFs (when WAIS-IQ was added to the model depicted in Figure 2B, it correlated .51, .49, and −.24 with the Common EF, Updating-specific, and Shifting-specific variables, respectively; all ps < .001). To examine whether the relation between Restraint Group and IQ was explained by IQ’s relation to the EFs, we tested whether Restraint Group predicted the variance in WAIS-IQ that was independent of the three EF components. To do so, we allowed each EF component to predict WAIS-IQ (i.e., regressed the EFs out of IQ), then tested whether the mean of the WAIS-IQ residual differed for the two classes. The results suggested that the three EF variables mediated the relationship between Restraint Group and IQ: The two restraint groups did not differ on the residual for WAIS-IQ (0.11 SD higher in the more restrained group), χ2diff(1) = 0.41, p = .522. The converse was not true, however. When we extracted the EF components after first allowing WAIS-IQ to predict all nine EF tasks (i.e., making the Common EF, Updating-specific, and Shifting-specific variables independent of IQ), the more restrained group still showed a significantly larger mean for the Common EF variable (0.46 SD), χ2diff(1) = 4.13, p = .042, and a marginally significantly smaller mean for the Shifting-specific variable (−0.45 SD), χ2diff(1) = 2.97, p = .085. Hence, early self-restraint taps Common EF control abilities that go beyond IQ, but does not seem to predict aspects of IQ that are unrelated to EF.
Genetic Analyses
The third question of the study concerns the etiology of the relations between self-restraint and EFs. To examine this question, we used structural equation ACE models (Neale & Cardon, 1992) to obtain estimates of the proportions of variance due to genetic and environmental influences. To ascertain the statistical significance of the ACE parameters, each parameter was dropped from the model (by setting it to zero), and the resulting chi-square compared to that for the full model. A significant chi-square difference indicates that the parameter needs to be retained to account for the data.
Examining outcome measures within the latent class model itself is optimal because it takes into account probabilities of class membership. However, there are difficulties with superimposing a twin model on a latent class model (e.g., Althoff, Retter, Boomsma, & Hudziak, 2009). Hence, following previous genetic studies (e.g., Xian et al., 2005), for the subsequent analyses, we assigned participants to their most likely class membership based on the probability values provided by Mplus for the growth model of the self-restraint variable (i.e., not including the EFs), and used the resulting Restraint Group categorical variable as the dependent measure.3
Univariate models of prohibition variables
To examine the etiology of individual differences in early self-restraint, we calculated twin correlations and estimated an ACE model on the prohibition task at each age as well as at the level of the Restraint Group variable. Table 4 shows the ACE estimates and MZ and DZ twin correlations. At 14, 20, and 36 months, and for the Restraint Group variable, the MZ correlations were larger than the DZ correlations, suggesting genetic influences. The heritability estimates for the prohibition measures across years were inconsistent, ranging from zero to 40%. In all cases, either the A or C parameters could be dropped from the model without a significant chi-square change, but dropping both A and C significantly harmed model fit. This situation indicates that nonshared environmental influences alone cannot explain the data, but power is too low for detecting both A and C variance in the same model. However, it is often the case that additional information (i.e., additional variables such as the EF variables) can lead to tighter confidence intervals, as is the case in the following analyses. These analyses focused on the Restraint Group membership variable, as that was an efficient combination of all the data and also showed the strongest relations to the EFs.
Table 4.
Genetic Analyses for the Prohibition Task at Each Time Point and Restraint Group Membership
| Measure | Twin Correlations | ACE estimates (%) | |||
|---|---|---|---|---|---|
| rMZ | rDZ | A | C | E | |
| 14 monthsa | .50* | .33* | 36 | 15 | 49* |
| 20 monthsb | .36* | .33* | 6 | 29 | 65* |
| 24 monthsc | .23* | .29* | 0 | 26 | 74* |
| 36 monthsd | .53* | .33* | 40 | 13 | 47* |
| Restraint Groupe | .50* | .41* | 19 | 31 | 50* |
Note. Tetrachoric correlations estimated with Mplus. For all ACE models, either the A or C components could be set to zero, but not both.
p<.05.
χ2(4) = 3.82; p = .432, CFI = 1.00, RMSEA = .000.
χ2(4) = 6.05; p = .196, CFI = .91, RMSEA = .054.
χ2(4) = 2.18; p = .702, CFI = 1.00, RMSEA = .000.
χ2(4) = 8.96; p = .062, CFI = .88, RMSEA = .085.
χ2(3) = 2.89; p = .409, CFI = 1.00, RMSEA = .000.
Multivariate models with EFs
To specify the etiology of the relation between self-restraint and later EFs, we estimated a multivariate genetic model of the three EF components and allowed its nonzero As and Es to also predict the Restraint Group membership variable. To aid model convergence, we dropped all C components from the EF model, as they were all estimated as zero or close to zero; this resulted in a nonsignificant change in fit, χ2diff (12) = 3.27, p = .993, compared to the EF model including all Cs (see Appendix A). We maintained the full ACE model of Restraint Group membership, as both the A and C estimates represented substantial portions of variance. From this model, we calculated the genetic and environmental correlations between the nonzero A and E variances for EFs and those for Restraint Group membership. The resulting correlational model is shown in Figure 4. This model fit the data well, χ2(93) = 94.85, p = .427, CFI = .997, RMSEA = .009.
Figure 4.

AE model of Restraint Group Membership and EFs. Numbers above the AEs for the latent variables and Restraint Group Membership are the percentages of those variables accounted for by genetic and environmental influences. Numbers on double-headed arrows are correlation coefficients between nonzero As and Es. Numbers on arrows are standardized factor loadings. Numbers under the lower AEs are estimates for task-specific variances. Boldface type and solid lines indicate p < .05. Anti = antisaccade, Stop = stop-signal, Keep = keep track, Letter = letter memory, S2ba = spatial 2-back, Num = number-letter, Col = color-shape, Cat = category-switch.
The genetic variance for Restraint Group membership was significantly positively correlated with the genetic variance for the Common EF factor (r = .49), but the nonshared environmental variance in Restraint Group membership was not significantly correlated with the nonshared environmental Common EF variance (r = .21). Both the genetic (r = −.34) and nonshared environmental (r = −.18) correlations between Restraint Group membership and the Shifting-specific factor were negative, though neither was significant, χ2diff (1) = 1.39, p = .239, and χ2diff (1) = 0.51, p = .474, respectively. However, when both the A and E correlations with the Shifting-specific variable were dropped, leaving no correlation between Restraint Group and the Shifting-specific factor, the model fit significantly worse, χ2diff (2) = 6.02, p = .049. Hence, the relationship between self-restraint and Shifting-specific abilities was significant, as in the phenotypic analysis, but was split between A and E components. Restraint Group membership and the Updating-specific factor were not genetically correlated.
Using the parameter estimates from this model, one can derive the expected phenotypic correlations between Restraint Group membership and the three EF components (i.e., correlations between constructs across all individuals, ignoring twin structure), as well as the proportions of these correlations due to genetic and environmental influences. These estimated phenotypic correlations were .25, .00, and −.19 for Restraint Group with the Common EF, Updating-specific, and Shifting-specific variables, respectively. Genetic influences accounted for 84% of the phenotypic correlation between Common EF and Restraint Group Membership, with nonshared environmental influences accounting for the other 16%. Genetic and nonshared environmental influences accounted for 66% and 34%, respectively, of the phenotypic correlation between Shifting-specific abilities and Restraint Group membership. These results indicate that the associations with Restraint Group membership presented earlier are primarily genetic in origin for the Common EF variable but more split between genetics and environment for the Shifting-specific variable.
General Discussion
The main purpose of this study was to investigate the relations between early self-restraint and later EFs. Specifically, we asked the following three questions: (1) Are there distinct developmental trajectories for growth in self-restraint that may predict future EFs? (2) If so, does restraint differentially predict unity and diversity aspects of EF (Common EF, Updating-specific, and Shifting-specific abilities)? and (3) What is the etiology of these relations? Our results provided clear answers to these questions.
Development of Self-Restraint and Longitudinal Relations to EFs
With respect to the first question, the latent class growth model suggested two groups were needed to account for the self-restraint data. Both groups showed significant growth in their levels of self-restraint across from 14 to 36 months, but the more restrained group (55% of the participants) started out with better self-restraint and attained much higher levels of restraint by age 36 months (86% probability of waiting 30 s, vs. 38% for the less restrained group).
Restraint Group membership predicted EF abilities at age 17, indicating that the growth trajectories captured important individual differences related to EFs. These results suggest that examining individual differences in the pattern of development (i.e., growth trajectories), in addition to restraint at individual ages, may be a productive strategy. We found that Restraint Group membership, determined by the growth model, was a stronger predictor of later EFs than restraint at the individual time points. It is likely that at least some of this improvement was due to the likelihood that the group membership variable is a more accurate measure of individual differences in self-restraint, as it is based on multiple time points (and also included all participants with missing data, resulting in an increased n). Nevertheless, given that developmental researchers have also proposed that improvement in self-regulation across childhood may parallel the development of the frontal lobes and EFs (Berger, Kofman, Livneh, & Henik, 2007), it seems worthwhile to also consider growth trajectories in future research.
The finding that preschool self-restraint predicted late adolescent EF abilities adds to a growing literature that suggests some longitudinal stability in EFs and their relations to self-restraint. Several researchers have found relations between early self-regulation/restraint and later EFs, albeit across shorter time periods (Brody et al., 2002; Kochanska et al., 2001). Similarly, researchers have also found the opposite relation, with early EFs predicting later self-restraint (Kochanska et al., 2000; 2001); for example, Kochanska et al. (2001) found that response inhibition abilities at age 22 months significantly correlated with “don’t” compliance at 45 months (r = .33). Other researchers have found some developmental stability in EFs. Murray and Kochanska (2002) found significant correlations in prepotent response inhibition from ages 2.5 to 5.5 years old. Polderman et al. (2007) found that performance on tasks assessing processing speed in working memory, selective attention, and alertness at age 5 predicted performance on these same tasks at age 12 (moreover, the relationships between the two time points were genetic in origin). Our findings extend this literature to suggest that longitudinal relations between childhood self-restraint and EF abilities persist into late adolescence.
This conclusion is consistent with previous findings of continuity between child and adult EFs. fMRI studies suggest that the neural basis of controlled processes in attention is similar for children and adults (e.g., Casey et al., 1997). Moreover, specific genes that influence EFs in adults, particularly polymorphisms related to the dopamine system (e.g., DAT1, COMT val/met), have also been related to EF or “executive attention” tasks in children (Diamond, Briand, Fossella, & Gehlbach, 2004; Rueda, Rothbart, McCandliss, Saccomanno, & Posner, 2005). Thus, it is possible that this continuity of the neural and genetic underpinnings of EFs may underlie the longitudinal relations between early self-restraint and EF abilities.
Specificity in Relations Between Self-Restraint and EF Components
Relations to the unity/diversity EF framework
With respect to the second question, we found that the strength and directionality of the relations between early self-restraint and later EF abilities depended on which EF component was examined. Compared to children who were less restrained, children who were more restrained at ages 14 to 36 months tended to have better Common EF and poorer Shifting-specific abilities at age 17, but similar Updating-specific abilities. These relations were most evident when comparing groups based on growth trajectories. Neither gender nor socioeconomic status (SES), measured as parents’ occupational statuses, seemed to account for these relations, though girls showed more self-restraint than boys and SES was positively associated with both self-restraint and EFs (see Appendix B for details).
The positive association of self-restraint with Common EF ability, which in our model captured all the variance associated with Inhibiting ability, is consistent with previous research findings that self-regulation is associated with better EF abilities, particularly inhibition (e.g., Brody et al., 2002; Hughes et al., 1998; Kochanska et al., 2001). Because we conceptualize this Common EF ability to rely heavily on active maintenance of task goals, its positive relationship with self-restraint makes sense. Clearly, holding onto the goal of not touching would be an important aspect of restraint in a “don’t” compliance task.
The null association with Updating-specific ability suggests that self-restraint is not related to variance in Updating ability that is independent of Common EF. This null association is not due to lower reliability for the Updating-specific factor; because it was measured with a latent variable, it is less prone to measurement error than individual tasks (Bollen, 1989). Moreover, IQ was correlated with Updating-specific ability as much as it was with Common EF ability (see also Friedman et al., 2008), indicating that the Updating-specific factor is tapping important cognitive ability. Hence, the null association likely reflects a real null effect rather than a measurement or power problem. In terms of our interpretation of this factor as reflecting the ability to continuously update information, it makes sense that self-restraint did not predict Updating-specific ability, because our prohibition task really had no requirement for continuously updating information (only one goal was relevant).
The negative relation between self-restraint and Shifting-specific abilities indicates that not all EFs are positively associated with better self-regulation. This result mirrors our previous finding (Friedman et al., 2007) that attention problems across adolescence, thought to be a consequence of poor self-regulation (Berger et al., 2007), were positively associated with Shifting abilities. Jones, Rothbart, and Posner (2003) also found a negative correlation between parent-rated attention-shifting abilities and response inhibition abilities (measured by a Simon-says task) in preschool-age children.
Why might poorer self-restraint be associated with better Shifting-specific ability? It is possible that the Shifting-specific factor may primarily reflect mental flexibility, or the ability to deactivate or remove a goal once that goal is no longer relevant. To put it differently, poor Shifting-specific ability may reflect mental inflexibility or mental “stickiness,” a tendency for information to stay around in the absence of continued active maintenance (Altamirano, Miyake, & Whitmer, 2010). Hence, a potential explanation for the negative relation between Shifting-specific abilities and self-restraint is that more restrained individuals may be able to better remember the goal of not touching partly because they have “sticky” minds, an attribute which would lead them to behave less flexibly in shifting tasks.
In the unity/diversity framework used for the current analyses, Shifting was decomposed into abilities related to Common EF (thought to involve active goal maintenance; Friedman et al., 2008) and those specific to Shifting (which, as just discussed, may involve flexibility in deactivation or removal of irrelevant task sets). The contrasting directionality of the relations of self-restraint to these two factors suggests that they may in some sense be in opposition when it comes to self-regulation, explaining why when the Shifting construct was not separated into common and specific variance, it showed a different (slightly positive but not significant) relation to self-restraint. Though consistent with previous findings of some specificity in the relationship between self-restraint and EFs (e.g., Kochanska et al., 1998; Hughes et al., 1998), these results add a new dimension to our understanding of early self-regulation.
One alternative interpretation of our finding that self-restraint predicted EFs is that perhaps the children who showed more restraint in the “don’t” compliance task as toddlers were also more compliant or motivated during EF testing at age 17. If so, the associations might be more personality-based than cognitive in nature. However, this interpretation does not explain the particular pattern of associations we obtained, with more-restrained children having better Common EF ability but poorer Shifting-specific ability than less-restrained children. It is difficult to see how a motivational or personality factor would have opposite influences on two EF components and not influence a third component (Updating-specific ability).
Self-restraint and IQ
Though there was also a significant relation of Restraint Group to age 16 IQ, it appeared to be due to the strong overlap between IQ and EFs. In the growth model, the two groups did not differ in the portion of IQ that was independent of the three EF components. However, the two groups did differ on the portion of Common EF that was independent of IQ. Hence, EFs mediate the relation between self-restraint and later IQ, but IQ does not completely explain the relation between self-restraint and Common EF.
Moreover, the pattern of relations among self-restraint, IQ, and the EF components provides new insights into the nature of the relation between IQ and self-restraint. Though IQ was equally positively correlated (about .50) with Common EF and Updating-specific abilities, self-restraint was only positively related to the Common EF variable. This result suggests that the relation between self-restraint and IQ was largely mediated by Common EF abilities, not Updating-specific abilities.
Common EF versus Inhibiting
Our findings that early self-restraint, measured with “don’t” compliance, is related to Common EF ability is consistent with previous research linking compliance to response inhibition (e.g., Kochanska et al., 2001). As discussed earlier, in our unity/diversity framework we found that the Common EF factor was perfectly correlated with the Inhibiting factor and hence that there was no variance unique to Inhibiting (see Appendix A). This finding could be interpreted in at least two ways. One is that Inhibiting is a more fundamental ability that underlies the other EFs we examined (cf. Zacks & Hasher, 1994). Although this interpretation does not contradict our findings, it necessitates that the kind of inhibition assessed in our Inhibiting tasks (prepotent response inhibition) be statistically identical to the kind of inhibition- or interference control-related abilities that might be involved in the Updating tasks (deletion of no-longer-relevant working memory contents) and Shifting tasks (resisting interference from currently irrelevant task sets). However, there has been increasing recognition that “inhibition” ability may itself be a multidimensional construct (Harnishfeger, 1994; Nigg, 2000), in that there are multiple, statistically dissociable inhibition-related abilities (e.g., Friedman & Miyake, 2004; Hedden & Yoon, 2006). For this reason, we prefer the alterative interpretation that Inhibiting relies heavily on a process that Common EF may primarily reflect: the ability to actively maintain task goals and goal-related information (Friedman et al., 2008; O’Reilly, Braver, & Cohen, 1999), a requirement of all EF tasks.
It is important to note that the finding that Common EF is isomorphic with Inhibiting ability does not mean that there is no such thing as inhibition. In fact, this finding is agnostic as to the question of whether our Inhibiting tasks require active suppression. Rather, it simply indicates that in terms of individual differences, success on Inhibiting tasks relies heavily on processes that are also required for Updating and Shifting tasks. It is entirely possible that Inhibiting tasks require other processes as well, but if there are few individual differences in these processes, then they will not contribute to variance in Inhibiting task performance. Thus, our results are consistent with previous research findings suggesting a link between response inhibition ability and self-restraint, but provide a new interpretation of those results.
Etiology of the Longitudinal Relations Between Self-restraint and EFs
With respect to the third question, we found that the relations of EFs to self-restraint (as measured by membership in different growth trajectory groups) were primarily genetic for the Common EF variable (84%). For the Shifting-specific variable, the phenotypic correlation was split between genetic (66%) and nonshared environmental (34%) influences. Hence, even very early forms of self-regulation already reflect some of the genetic and environmental influences that contribute to individual differences in late adolescent EFs.
In demonstrating that developmental patterns in early-self restraint are genetically linked to cognitive EFs in late adolescence, these results implicate such EFs as one possible underlying biologically-based mechanism for findings of associations between early self-restraint and later behavior problems, drug use, and academic performance (e.g., Block, et al., 1988; Caspi, et al., 1995; Mischel, et al., 1988). The results are consistent with previous research linking children’s self-regulation to concurrent levels of effortful control or executive attention measures, suggesting a common neural substrate (Posner & Rothbart, 2009). They add to this literature in specifying that it is general executive functioning (Common EF), rather than variance specific to updating and shifting abilities, that is positively related to the development of restraint. The finding that the relations between early self-restraint and later Common EF control were primarily genetic in origin suggests that polymorphisms related to EFs in children (Diamond et al., 2004; Rueda et al., 2005) may be useful candidate genes for studying the relation between early self-regulation and EFs.
Limitations of the Current Study
A limitation of this study concerns the measure of self-restraint: a one-trial test, with a categorical dependent variable. Certainly a more prolonged measure with multiple trials that could be coded continuously would provide a more sensitive measure of individual differences, for which reliability could also be assessed. Low reliability might have contributed to inconsistent heritability of the measures across time points, though combining them in the growth model likely alleviated some potential reliability problems. It may have also contributed to somewhat low time-to-time correlations (.19 to .36) shown in Table 2. These correlations, though significant, seem to indicate that there is a good deal of change in performance on this task from time to time. However, the magnitudes of these correlations are consistent with other studies of self-restraint that have reported correlations across multiple time points (e.g., .15 to .55 in Kochanska et al., 2001; .22 in Mischel et al., 1988).
The brevity of the measure also did not allow for distinguishing different forms of compliance. Kochanska and colleagues (e.g., Kochanska et al., 2001) distinguished committed versus situational compliance, a difference that captures how enthusiastically the child embraces the maternal agenda. Committed compliance was more correlated across time and was more linked to internalization of rules than situational compliance. Despite the limitations of the measure, we still found significant associations with EFs measured 14 years later, suggesting that the measures certainly tapped important individual differences. If anything, the brevity of the measure likely worked against finding such associations.
We also examined only one measure of self-restraint—compliance with an experimenter’s request to not touch a tempting toy. It remains to be seen if our results might extend to other forms of self-restraint that have been studied in children, such as delay of gratification (Mischel, et al., 1989) or suppression of negative facial expressions (e.g., Cole, 1986). Indeed, Mischel et al. (1988) found that their delay of gratification paradigm showed different patterns of relations to measures of “ego-resiliency” and “ego-undercontrol” than a resistance to temptation measure used by Funder, Block, and Block (1983). The latter assessed the degree to which the child approached a forbidden toy and so was similar to the kind of restraint assessed in the current study. Hence, different paradigms may be tapping different aspects of self-restraint. To the extent that various measures of restraint in childhood tap some common construct, suggesting it is more trait-like, we would expect our results to generalize across contexts. It is possible, however, that different aspects of self-regulation or self-control (e.g., cognitive vs. emotional) show some heterogeneity (Baumeister & Vohs, 2004) and are elicited only in specific contexts.
Conclusions and Implications
In summary, our results indicate that early individual differences in the development of self-restraint provide a genetic preview of Common EF and, to some extent, Shifting-specific abilities 14 years later. These findings extend the literature in three ways: They suggest that longitudinal relations between early self-restraint and later EFs are specific to particular components of EFs, are genetically mediated, and persist across childhood into late adolescence, suggesting a strong trait-like quality of early self-restraint.
An important future direction is to examine whether individual differences in EFs mediate relations between self-restraint and a variety of social and behavioral problems (e.g., Block, et al., 1988; Caspi, et al., 1995; Mischel, et al., 1988), problems that are also associated with differences in EFs (e.g., Barkley, 1997; Friedman et al., 2007; Garavan & Stout, 2005; Nigg, 2006; Young et al., 2009). The results of the current study establish one requirement of such mediation: that early self-restraint actually predict later EFs. Our finding that self-restraint is differentially related to the unity and diversity components of EFs provides a rich foundation on which to build future studies.
Acknowledgments
This research was supported by grants from the MacArthur Foundation and the National Institute of Health (MH063207, MH079485, HD010333, and HD050346). We thank Corinne Wright and Sally Ann Rhea for project coordination and testing. We also thank John Towse for comments on an earlier version of the manuscript.
Appendix A: EF Genetic Results
This appendix presents an update to the primary results presented in the Friedman et al. (2008) article. The current sample consists of 813 participants with usable cognitive data (an additional 231 individuals) and comprises the full sample (age 17 EF testing has been completed).
Table A1 presents the correlations among the cognitive measures. Additional correlations used in the genetic models are available from the first author. Figure 2 presents the phenotypic models of the full EF data. These models fit the data well, χ2(24) = 56.73, p < .001, CFI = .964, RMSEA = .042, for the correlated factors model (Figure 2A), and χ2(21) = 53.56; p < .001, CFI = .964, RMSEA = .044, for the nested factors model (Figure 2B).
Table A1.
Phenotypic Correlations for the Cognitive Measures
| Task | 1 | 2 | 3 | 4 | 5 | 6 | 7 | 8 | 9 | 10 |
|---|---|---|---|---|---|---|---|---|---|---|
| 1. Antisaccade | -- | |||||||||
| 2. Stop-signal | .26 | -- | ||||||||
| 3. Stroop | .16 | .14 | -- | |||||||
| 4. Keep-track | .18 | .23 | .21 | -- | ||||||
| 5. Letter-memory | .25 | .16 | .25 | .46 | -- | |||||
| 6. Spatial 2-back | .21 | .24 | .12 | .27 | .26 | -- | ||||
| 7. Number–letter | .14 | .26 | .23 | .13 | .19 | .15 | -- | |||
| 8. Color–shape | .16 | .22 | .27 | .14 | .14 | .12 | .41 | -- | ||
| 9. Category switch | .21 | .28 | .25 | .17 | .16 | .19 | .48 | .43 | -- | |
| 10. WAIS-IQ | .23 | .22 | .26 | .54 | .43 | .30 | .05 | .09 | .17 | -- |
Note. Correlations are maximum likelihood estimates (from Mplus) based on all data, adjusted for missing observations and nonindependence. Total N = 813. Directionality of the reaction time measures was reversed so that for all tasks, higher scores indicate better performance.
As in earlier analyses (Friedman et al., 2008), model comparisons for the correlated factors model indicated diversity, in that no two EFs could be collapsed, all χ2diff (2) > 46.79, p < .001, nor could all three factors be collapsed into a single factor, χ2diff (3) = 283.45, p < .001. Also as in earlier analyses, there was no Inhibiting-specific factor in the nested factors model, as results from a hierarchical confirmatory factor analysis indicated no Inhibiting-specific variance.4
Twin correlations and univariate ACE models are presented in Table A2.5 Univariate task ACE estimates did not differ by sex, all χ2diff(3) < 6.86, p > .076. Figure A1 presents the full genetic ACE model for the nested factors EF model. There was significant genetic variance for the Common EF, Updating-specific, and Shifting-specific variables, indicating unity and diversity of executive functions at the genetic level. There was also significant nonshared environmental variance for the Shifting-specific latent variable.
Table A2.
Univariate Task Twin Correlations and ACE Estimates
| Task | Twin Correlationsa | Variance Components | Model Fit | ||||||
|---|---|---|---|---|---|---|---|---|---|
| MZ | DZ | A | C | E | χ2 (6) | p | RMSEA | CFI | |
| Antisaccade | .55 | .22 | .54 | .00 | .46 | 3.21 | .782 | .000 | 1.00 |
| Stop- signal | .51 | .08 | .44 | .00 | .56 | 10.41 | .109 | .061 | .911 |
| Stroop | .48 | .29 | .38 | .09 | .53 | 5.57 | .473 | .000 | 1.00 |
| Keep track | .54 | .25 | .53 | .00 | .47 | 1.89 | .930 | .000 | 1.00 |
| Letter memory | .57 | .18 | .55 | .00 | .45 | 7.50 | .277 | .035 | .983 |
| Spatial 2-back | .29 | .14 | .25 | .02 | .73 | 4.56 | .602 | .000 | 1.00 |
| Number–letter | .51 | .29 | .48 | .04 | .48 | 2.99 | .810 | .000 | 1.00 |
| Color–shape | .34 | .21 | .34 | .03 | .63 | 5.60 | .469 | .000 | 1.00 |
| Category switch | .53 | .33 | .39 | .13 | .47 | 3.47 | .748 | .000 | 1.00 |
| WAIS-IQ | .84 | .51 | .71 | .13 | .16 | 6.82 | .338 | .026 | .997 |
Note. A = additive genetic variance; C = shared environmental variance; E = nonshared environmental variance; RMSEA = root-mean-square error of approximation. CFI = confirmatory fit index. χ2/df < 2, RMSEA < .06, and CFI > .95 indicate good fit. Boldface type indicates p < .05. Italics indicate p < .10.
Figure A1.

Nested factors multivariate executive function ACE model. Numbers above the top ACEs are the percentages of the Common EF, Updating-specific, and Shifting-specific factors’ variances due to genetic and environmental influences. The numbers occluding arrows are standardized factor loadings. Numbers below the lower ACEs are estimates for the remaining nonexecutive variances in individual tasks. Boldface type and solid lines indicate p < .05. Anti = antisaccade, Stop = stop-signal, Keep = keep track, Letter = letter memory, S2ba = spatial 2-back, Num = number-letter, Col = color-shape, Cat = category-switch.
Appendix B: Relations of Sex and SES to Self-restraint and EFs
Given previous literature documenting sex differences in self-restraint (e.g., Kochanska et al., 2001) and associations between SES and cognitive abilities, particularly language and EFs (see Hackman & Farah, 2009), we examined the effects of these two potential covariates. For each variable, we first present how these covariates influence the self-restraint measures and EFs separately, then present how they influence the relations between the self-restraint trajectories and EFs within the latent class growth model. In short, though sex and SES predicted some aspects of self-restraint and EFs, they did not account for the associations between these measures.
Sex Differences
Self-restraint
Our results are consistent with previous literature suggesting that girls surpass boys in compliance (e.g., Kochanska et al., 2001). Multinomial logistic regressions predicting binned latency scores with sex indicated that there were no sex differences in latencies at 14 and 20 months, but females showed longer latency scores than males at ages 24 and 36 months. Moreover, females (61%) were more likely than males (51%) to be classified into the more restrained group in the growth model analysis. However, sex differences alone did not account for the identification of two growth trajectories: Growth models estimated separately for the two sexes identified the same two groups (showing similar trajectories as those in the overall model) as accounting for the data.
EFs
Sex was not clearly associated with EFs. Sex differences in EF task performance were significant for the following tests: Antisaccade (arcsined accuracy for males = 1.09 [SD = 0.18] > females = 0.99 [SD = .20], p < .001); Stroop (males = 223 ms [SD = 95] > females = 206 ms [SD = 85], p = .025); Color-shape (males = 348 ms [SD = 197] > females = 316 ms [SD = 182], p = .039); and Category-switch (males = 314 ms [SD = 179] < females = 350 ms [SD = 182], p = .017). Note that these differences were inconsistent in terms of directionality, with males scoring better than females on one Inhibiting task (higher antisaccade accuracy) and one Shifting task (lower Category-switch shift cost), but females scoring better than males on the other Inhibiting task (lower Stroop interference) and the other Shifting task (lower Color-shape shift cost). Hence, these differences at the task level did not lead to mean differences at the latent variable level.
Relation between self-restraint and EFs
Given the absence of sex differences in EFs at the latent variable level, it is not surprising that the relations between the self-restraint groups (within the latent class growth model) and EFs remained similar as those presented in Table 3 (top panel) when the nine EF tasks were regressed on sex: In this model the more restrained group was 0.59 SD higher on Common EF, not significantly higher (0.04 SD) on Updating-specific, 0.40 SD lower on Shifting-specific, and .48 SD higher on IQ than the less restrained group, χ2diff(1) = 10.66, p = .001 for Common EF; χ2diff(1) = 0.04, p = .841 for Updating-specific; χ2diff(1) = 3.95, p = .047 for Shifting-specific; and χ2diff(1) = 20.13, p < .001 for IQ.
SES
Revised National Opinion Research Center ratings of occupation status (Hauser & Featherman, 1977) of the parents at the time of the 14-month testing were available for 406 mothers and 396 fathers. Average occupational status for the mothers was 38.8 (SD=16.45, range=15.4 to 81.2); for the fathers it was 48.3 (SD=13.5, range=17.3 to 81.2). In the following analyses, we used averaged parental occupational statuses (z-transformed in mothers and fathers then averaged).
Self-restraint
In logistic regressions, occupational status predicted latencies at 24 months (1 SD in status associated with an odds ratio = 1.17, p = .046) and 36 months (odds ratio = 1.26, p = .017). Occupational status also predicted restraint-group membership (odds ratio = 1.24, p = .007). Similarly, when occupational status was included in the latent class growth model, the more restrained group’s status was 0.31 SDs higher than the less-restrained group, a significant difference, χ2diff(1) = 6.36, p = .012.
EFs
To examine the relation of SES to EFs, we estimated a confirmatory factor analysis with the nested factors EF model and occupational status, which was normally distributed. Status correlated .25, .14, −.21, and .32, respectively, with Common EF, χ2diff(1) = 13.15, p < .001; Updating-specific, χ2diff(1) = 3.63, p = .057; Shifting-specific, χ2diff(1) = 10.43, p = .001; and IQ, χ2diff(1) = 46.55, p < .001. Hence, SES showed fairly substantial relations to the EFs.
Relation between self-restraint and EFs
To assess whether self-restraint still predicted EFs once SES was covaried, we added SES to the latent class model with EFs and allowed SES to predict all nine EF tasks. Hence, in this model, the EF latent variables represent correlated variance once the variance associated with SES is removed. In this model, the more restrained group was still 0.55 SD higher on Common EF, not different on Updating-specific (0.01 SD), 0.43 SD lower on Shifting-specific, and 0.40 SD higher on IQ than the less restrained group, χ2diff(1) = 7.79, p = .005 for Common EF; χ2diff(1) = 0.00, p = .975 for Updating-specific; χ2diff(1) = 3.94, p = .047 for Shifting-specific; and χ2diff(1) = 13.81, p < .001 for IQ. Hence, including SES as a covariate did not greatly reduce the EF association between self-restraint and later EFs (shown in Table 3). Though SES is correlated with both childhood self-restraint and adult EFs, it does not seem to be mediating the relationship between the two.
Footnotes
The latent class model provides probabilities for each person of being in each class, enabling classification into “most likely class membership.” The distinctiveness of the classes can be summarized with a measure of “entropy,” for which higher numbers (up to 1.0) indicate more distinct classes (i.e., individuals have high probabilities of being in one class vs. others). This two-class model had an entropy estimate of .39. Though this entropy is somewhat low, it reflects average probabilities of around .80 for most likely class membership (i.e., individuals classified into the less-restrained group on average had a .82 probability of being in that group; individuals classified into the more restrained group had an average .78 probability of being in that group). Though models with more classes showed higher entropies (.50 for 3 classes and .56 for 4 classes), few people were actually classified into these extra classes (fewer than 5% based on most likely class membership).
It is also possible to estimate a latent variable growth model in which there is only one group, but the latent intercept and slope variables show individual differences (i.e., have variance and are allowed to correlate). For comparison, we estimated such a growth model (with the intercept and nonlinear slope variables defined with the same loadings as in the latent class model). This model showed a similar fit to the data as the latent class model presented in the main text, χ2(72) = 93.24, p = .047, BIC = 4908.49. Both the latent intercept variable, χ2diff(2) = 64.79, p < .001, and the latent slope variable, χ2diff(2) = 15.15, p = .001, showed significant variance, as indicated by chi-square difference tests for setting these variances (and by necessity, their covariance) to zero. Moreover, the two variables correlated quite highly, r = .93, indicating that individuals with a higher intercept showed steeper slopes (the same trend observed in the latent class model). Because of the high correlation between the intercept and slope, it did not make sense to estimate their correlations with the EFs separately. Hence, we created a higher-level latent variable that captured their common variance by having it load at 1.0 (standardized loading) on the intercept and freeing its loading (estimated standardized loading of .98) on the slope. This hierarchical “growth” variable correlated .29, −.01, −.17, and .20, respectively, with Common EF, χ2diff(1) = 9.74, p = .002; Updating-specific, χ2diff(1) = 0.03, p = .862; Shifting-specific, χ2diff(1) = 3.36, p = .067; and IQ, χ2diff(1) = 11.19, p = .001. These correlations are similar to the D to r conversions from the latent class model and point to similar conclusions.
The high correlation between the latent intercept and slope variables observed in the alternative analysis indicates that, in this case, change information (slope) across this two-year time span does not provide information beyond that provided by the intercept, which captures individual differences at age 14 months and stable differences across time. Although this finding may be somewhat surprising, we feel that the developmental approach taken here is still valuable, because (1) it revealed that change was highly correlated with initial levels during this time period and thus characterized the nature of individual differences in trajectories; and (2) having multiple measures enables a more reliable and accurate measure of individual differences in self-restraint (compared to information from a single time point, as illustrated in Table 3).
To ensure the phenotypic relations between class membership and EFs were similar for this Restraint Group variable as for the model that integrated the EFs within the growth model itself (reported in the previous section), we regressed the three EF components in the nested factors model and IQ on the Restraint Group variable. Compared to the less restrained group, the more restrained group scored 0.36 SD higher, 0.04 SD higher, 0.29 SD lower, and 0.28 SD higher, respectively, on Common EF, χ2diff(1) = 9.21, p = .002; Updating-specific, χ2diff(1) = 0.13, p = .718; Shifting-specific, χ2diff(1) = 5.09, p = .024; and IQ, χ2diff(1) = 11.71, p = .001. Though smaller, these estimates showed a similar pattern to those for the model in which the EFs were included in the growth model.
We wanted to take a rigorous approach to looking for an Inhibiting-specific factor. Though a nested-factors model with an Inhibiting-specific factor that loaded on the three Inhibiting tasks showed non-significant loadings, such a model may not be identified. Thus, we examined whether there was any evidence for residual correlations for the Inhibiting tasks in the nested factors model by allowing one pair at a time to correlate. The only such residual correlation that significantly improved fit was a negative one between Stop-signal and Stroop, r= −.19, χ2diff (1) = 12.94, p < .001. Because this correlation was negative, an interpretation was not clear, and we opted to leave it out of the final model. Hence, we found no evidence that there was something common to the three Inhibiting tasks over and above the Common EF factor.
DZ correlations less than half the MZ correlations can indicate genetic dominance (D). With MZ and DZ twins reared together, it is not possible to estimate the effects of both shared environment (C) and dominant genetic influences (D), although one or the other source can be assumed to be absent depending on whether the DZ twin correlation is greater (D = 0) or less (C = 0) than half the MZ correlation. Because in the current study the MZ correlations appeared greater than twice the DZ correlations for only some of the measures, we used the ACE models throughout. When we estimated ADE models, the D parameters were nonsignificant. However, because A and D estimates are strongly negatively correlated, power would be very low to detect D, and we do not rule out genetic dominance or epistasis. Hence, the A estimates in the full ACE model may be more accurately considered estimates of broad heritability (including both additive and nonadditive genetic variance) rather than narrow-sense heritability (i.e., only additive).
Publisher's Disclaimer: The following manuscript is the final accepted manuscript. It has not been subjected to the final copyediting, fact-checking, and proofreading required for formal publication. It is not the definitive, publisher-authenticated version. The American Psychological Association and its Council of Editors disclaim any responsibility or liabilities for errors or omissions of this manuscript version, any version derived from this manuscript by NIH, or other third parties. The published version is available at www.apa.org/pubs/journals/dev
Contributor Information
Naomi P. Friedman, Institute for Behavioral Genetics, University of Colorado at Boulder
Akira Miyake, Department of Psychology and Neuroscience, University of Colorado at Boulder.
JoAnn L. Robinson, Department of Human Development and Family Studies, University of Connecticut
John K. Hewitt, Institute for Behavioral Genetics, University of Colorado at Boulder
References
- Altamirano LJ, Miyake A, Whitmer AJ. When mental inflexibility facilitates executive control: The beneficial side effects of ruminative tendencies on goal maintenance. Psychological Science. 2010;21:1377–1382. doi: 10.1177/0956797610381505. [DOI] [PMC free article] [PubMed] [Google Scholar]
- Althoff RR, Rettew DC, Boomsma DI, Hudziak JJ. Latent class analysis of the Child Behavior Checklist ObsessivesCompulsive Scale. Comprehensive Psychiatry. 2009;50:584–592. doi: 10.1016/j.comppsych.2009.01.005. [DOI] [PMC free article] [PubMed] [Google Scholar]
- Barkley RA. Behavioral inhibition, sustained attention, and executive function: Constructing a unified theory of ADHD. Psychological Bulletin. 1997;121:65–94. doi: 10.1037/0033-2909.121.1.65. [DOI] [PubMed] [Google Scholar]
- Baumeister RF, Vohs KD, editors. Handbook of self-regulation. New York: Guilford Press; 2004. [Google Scholar]
- Berger A, Kofman O, Livneh U, Henik A. Multidisciplinary perspectives on attention and the development of self-regulation. Progress in Neurobiology. 2007;82:256–286. doi: 10.1016/j.pneurobio.2007.06.004. [DOI] [PubMed] [Google Scholar]
- Block J, Block JH, Keyes S. Longitudinally foretelling drug usage in adolescence: Early childhood personality and environmental precursors. Child Development. 1988;59:336–355. doi: 10.1111/j.1467-8624.1988.tb01470.x. [DOI] [PubMed] [Google Scholar]
- Bollen KA. Structural equations with latent variables. New York: Wiley; 1989. [Google Scholar]
- Braungart-Rieker J, Garwood MM, Stifter CA. Compliance and noncompliance: The roles of maternal control and child temperament. Journal of Applied Developmental Psychology. 1997;18:411–428. [Google Scholar]
- Brody M, Taylor E, Hughes C. To go or not to go: Inhibitory control in “hard to manage” children. Infant and Child Development. 2002;11:125–140. [Google Scholar]
- Burgess PW. Theory and methodology in executive function research. In: Rabbitt P, editor. Methodology of frontal and executive function. Hove, UK: Psychology Press; 1997. pp. 81–116. [Google Scholar]
- Casey BJ, Trainor R, Giedd J, Vauss Y, Vaituzis CK, Hamburger S, Kozuch P, Rapoport JL. The role of the anterior cingulate in automatic and controlled processes: A developmental neuroanatomical study. Developmental Psychobiology. 1997;30:61–69. [PubMed] [Google Scholar]
- Caspi A, Henry B, McGee RO, Moffitt TE, Silva PA. Temperamental origins of child and adolescent behavior problems: From age three to age fifteen. Child Development. 1995;66:55–68. doi: 10.1111/j.1467-8624.1995.tb00855.x. [DOI] [PubMed] [Google Scholar]
- Cohen J. Statistical power analysis for the behavioral sciences. 2. Hillsdale, NJ: Lawrence Erlbaum Associates; 1988. [Google Scholar]
- Cohen JD, MacWhinney B, Flatt M, Provost J. PsyScope: A new graphic interactive environment for designing psychology experiments. Behavioral Research Methods, Instruments, and Computers. 1993;25:257–271. [Google Scholar]
- Cole PM. Children’s spontaneous control of facial expression. Child Development. 1986;57:1309–1321. [Google Scholar]
- Collette F, Van Der LM, Laureys S, Delfiore G, Degueldre C, Luxen A, Salmon E. Exploring the unity and diversity of the neural substrates of executive functioning. Human Brain Mapping. 2005;25:409–423. doi: 10.1002/hbm.20118. [DOI] [PMC free article] [PubMed] [Google Scholar]
- Crone EA. Executive functions in adolescence: Inferences from brain and behavior. Developmental Science. 2009;12:825–830. doi: 10.1111/j.1467-7687.2009.00918.x. [DOI] [PubMed] [Google Scholar]
- Diamond A, Briand L, Fossella J, Gehlbach L. Genetic and neurochemical modulation of prefrontal cognitive functions in children. American Journal of Psychiatry. 2004;161:125–132. doi: 10.1176/appi.ajp.161.1.125. [DOI] [PubMed] [Google Scholar]
- Duckworth AL, Seligman MEP. Self-discipline outdoes IQ in predicting academic performance of adolescents. Psychological Science. 2005;16:939–944. doi: 10.1111/j.1467-9280.2005.01641.x. [DOI] [PubMed] [Google Scholar]
- Eigsti I, Zayas V, Mischel W, Shoda Y, Ayduk O, Dadlani MB, Davidson MC, Aber JL, Casey BJ. Predicting cognitive control from preschool to late adolescence and young adulthood. Psychological Science. 2006;17:478–484. doi: 10.1111/j.1467-9280.2006.01732.x. [DOI] [PubMed] [Google Scholar]
- Eisenberg N, Smith CL, Sadovsky A, Spinrad TL. Effortful control: Relations with emotion regulation, adjustment, and socialization in childhood. In: Baumeister RF, Vohs KD, editors. Handbook of self-regulation. New York: Guilford Press; 2004. pp. 259–282. [Google Scholar]
- Fournier-Vicente S, Larigauderie P, Gaonac’h D. More dissociations and interactions within central executive functioning: A comprehensive latent-variable analysis. Acta Psychologica. 2008;129:32–48. doi: 10.1016/j.actpsy.2008.04.004. [DOI] [PubMed] [Google Scholar]
- Friedman NP, Corley RP, Hewitt JK, Wright KP., Jr Individual differences in childhood sleep problems predict later cognitive executive control. Sleep. 2009;32:323–333. doi: 10.1093/sleep/32.3.323. [DOI] [PMC free article] [PubMed] [Google Scholar]
- Friedman NP, Haberstick BC, Willcutt EG, Miyake A, Young SE, Corley RP, Hewitt JK. Greater attention problems during childhood predict poorer executive functioning in late adolescence. Psychological Science. 2007;18:893–900. doi: 10.1111/j.1467-9280.2007.01997.x. [DOI] [PubMed] [Google Scholar]
- Friedman NP, Miyake A. The relations among inhibition and interference control functions: A latent-variable analysis. Journal of Experimental Psychology: General. 2004;133:101–135. doi: 10.1037/0096-3445.133.1.101. [DOI] [PubMed] [Google Scholar]
- Friedman NP, Miyake A, Corley RP, Young SE, DeFries JC, Hewitt JK. Not all executive functions are related to intelligence. Psychological Science. 2006;17:172–179. doi: 10.1111/j.1467-9280.2006.01681.x. [DOI] [PubMed] [Google Scholar]
- Friedman NP, Miyake A, Young SE, DeFries JC, Corley RP, Hewitt JK. Individual Differences in executive functions are almost entirely genetic in origin. Journal of Experimental Psychology: General. 2008;137:201–225. doi: 10.1037/0096-3445.137.2.201. [DOI] [PMC free article] [PubMed] [Google Scholar]
- Funder DC, Block JH, Block J. Delay of gratification: Some longitudinal personality correlates. Journal of Personality and Social Psychology. 1983;44:1198–1213. [Google Scholar]
- Gagne JR, Saudino KJ. Wait for it! A twin study of inhibitory control in early childhood. Behavior Genetics. 2010;40:327–337. doi: 10.1007/s10519-009-9316-6. [DOI] [PMC free article] [PubMed] [Google Scholar]
- Garavan H, Stout JC. Neurocognitive insights into substance abuse. Trends in Cognitive Sciences. 2005;9:195–201. doi: 10.1016/j.tics.2005.02.008. [DOI] [PubMed] [Google Scholar]
- Goldsmith HH, Buss KA, Lemery KS. Toddler and childhood temperament: Expanded content, stronger genetic evidence, new evidence for the importance of environment. Developmental Psychology. 1997;33:891–905. doi: 10.1037//0012-1649.33.6.891. [DOI] [PubMed] [Google Scholar]
- Groot AS, de Sonneville LMJ, Stins JF, Boomsma DI. Familial influences on sustained attention and inhibition in preschoolers. Journal of Child Psychology and Psychiatry. 2004;45:306–314. doi: 10.1111/j.1469-7610.2004.00222.x. [DOI] [PubMed] [Google Scholar]
- Hackman DA, Farah MA. Socioeconomic status and the developing brain. Trends in Cognitive Sciences. 2009;13:65–73. doi: 10.1016/j.tics.2008.11.003. [DOI] [PMC free article] [PubMed] [Google Scholar]
- Harnishfeger KK. The development of cognitive inhibition: Theories, definitions, and research evidence. In: Dempster FN, Brainerd CJ, editors. Interference and inhibition in cognition. San Diego, CA: Academic Press; 1995. pp. 175–204. [Google Scholar]
- Hauser RM, Featherman DL. The process of stratification: Trends and analyses. New York: Academic Press; 1977. [Google Scholar]
- Hedden T, Yoon C. Individual differences in executive processing predict susceptibility to interference in verbal working memory. Neuropsychology. 2006;20:511–528. doi: 10.1037/0894-4105.20.5.511. [DOI] [PubMed] [Google Scholar]
- Hu L, Bentler PM. Fit indices in covariance structure modeling: Sensitivity to underparameterized model misspecification. Psychological Methods. 1998;3:424–453. [Google Scholar]
- Hughes C, Dunn J, White A. Trick or treat?: Uneven understanding of mind and emotion and executive dysfunction in “hard-to-manage” preschoolers. Journal of Child Psychology and Psychiatry. 1998;7:981–994. [PubMed] [Google Scholar]
- Huizinga M, Dolan CV, van der Molen MW. Age-related change in executive function: Developmental trends and a latent variable analysis. Neuropsychologia. 2006;44:2017–2036. doi: 10.1016/j.neuropsychologia.2006.01.010. [DOI] [PubMed] [Google Scholar]
- Jones LB, Rothbart MK, Posner MI. Development of executive attention in preschool children. Developmental Science. 2003;6:498–504. [Google Scholar]
- Kane MJ, Engle RW. Working memory capacity and the control of attention: The contributions of goal neglect, response competition, and task set to Stroop interference. Journal of Experimental Psychology: General. 2003;132:47–70. doi: 10.1037/0096-3445.132.1.47. [DOI] [PubMed] [Google Scholar]
- Kochanska G, Coy KC, Murray KT. The development of self-regulation in the first four years of life. Child Development. 2001;72:1091–1111. doi: 10.1111/1467-8624.00336. [DOI] [PubMed] [Google Scholar]
- Kochanska G, Knaack A. Effortful control as a personality characteristic of young children: Antecedents, correlates, and consequences. Journal of Personality. 2003;71:1087–1112. doi: 10.1111/1467-6494.7106008. [DOI] [PubMed] [Google Scholar]
- Kochanska G, Murray KT, Harlan ET. Effortful control in early childhood: Continuity and change, antecedents, and implications for social development. Developmental Psychology. 2000;36:220–232. [PubMed] [Google Scholar]
- Kochanska G, Tjebkes TI, Forman DR. Children’s emerging regulation of conduct: Restraint, compliance, and internalization from infancy to the second year. Child Development. 1998;69:1378–1389. [PubMed] [Google Scholar]
- Lehman EB, Steier AJ, Guidash KM, Wanna SY. Predictors of compliance in toddlers: Child temperament, maternal personality, and emotional availability. Early Child Development and Care. 2002;172:301–310. [Google Scholar]
- Lehto JE, Juujärvi P, Kooistra L, Pulkkinen L. Dimensions of executive functioning: Evidence from children. British Journal of Developmental Psychology. 2003;21:59–80. [Google Scholar]
- Lemery-Chalfant K, Doelger L, Goldsmith HH. Genetic relations between effortful and attentional control and symptoms of psychopathology in middle childhood. Infant and Child Development. 2008;17:365–385. doi: 10.1002/icd.581. [DOI] [PMC free article] [PubMed] [Google Scholar]
- Logan GD. On the ability to inhibit thought and action: A user’s guide to the stop signal paradigm. In: Dagenbach D, Carr TH, editors. Inhibitory processes in attention, memory, and language. San Diego, CA: Academic Press; 1994. pp. 189–239. [Google Scholar]
- Mayr U, Kliegl R. Task-set switching and long-term memory retrieval. Journal of Experimental Psychology: Learning, Memory, and Cognition. 2000;26:1124–1140. doi: 10.1037//0278-7393.26.5.1124. [DOI] [PubMed] [Google Scholar]
- Mischel W, Shoda Y, Peake PK. The nature of adolescent competencies predicted by preschool delay of gratification. Journal of Personality and Social Psychology. 1988;54:687–696. doi: 10.1037//0022-3514.54.4.687. [DOI] [PubMed] [Google Scholar]
- Mischel W, Shoda Y, Rodriguez ML. Delay of gratification in children. Science. 1989;244:933–938. doi: 10.1126/science.2658056. [DOI] [PubMed] [Google Scholar]
- Miyake A, Emerson MJ, Padilla F, Ahn JC. Inner speech as a retrieval aid for task goals: The effects of cue type and articulatory suppression in the random task cuing paradigm. Acta Psychologica. 2004;115:123–142. doi: 10.1016/j.actpsy.2003.12.004. [DOI] [PubMed] [Google Scholar]
- Miyake A, Friedman NP, Emerson MJ, Witzki AH, Howerter A, Wager TD. The unity and diversity of executive functions and their contributions to complex “frontal lobe” tasks: A latent variable analysis. Cognitive Psychology. 2000;41:49–100. doi: 10.1006/cogp.1999.0734. [DOI] [PubMed] [Google Scholar]
- Morris N, Jones DM. Memory updating in working memory: The role of the central executive. British Journal of Psychology. 1990;81:111–121. [Google Scholar]
- Morton JB, Munakata Y. Active versus latent representations: A neural network model of perseveration, dissociation, and decalage. Developmental Psychobiology. 2002;40:255–265. doi: 10.1002/dev.10033. [DOI] [PubMed] [Google Scholar]
- Murray KT, Kochanska G. Effortful control: Relation to externalizing and internalizing behaviors and factor structure. Journal of Abnormal Child Psychology. 2002;30:503–514. doi: 10.1023/a:1019821031523. [DOI] [PubMed] [Google Scholar]
- Muthén LK, Muthén BO. Mplus user’s guide. 5. Los Angeles, CA: Muthén & Muthén; 1998–2007. [Google Scholar]
- Neale MC, Cardon LR. Methodology for genetic studies of twins and families. Dordrecht, NL: Kluwer Academic Press; 1992. [Google Scholar]
- Nigg JT. On inhibition/disinhibition in developmental psychopathology: Views from cognitive and personality psychology and a working inhibition taxonomy. Psychological Bulletin. 2000;126:220–246. doi: 10.1037/0033-2909.126.2.220. [DOI] [PubMed] [Google Scholar]
- Nigg JT, Wong MM, Martel MM, Jester JM, Puttler LI, Glass JM, Adams KM, Fitzgerald HE, Zucker RA. Poor response inhibition as a predictor of problem drinking and illicit drug use in adolescent at risk for alcoholism and other substance use disorders. Journal of the American Academy of Child and Adolescent Psychiatry. 2006;45:468–475. doi: 10.1097/01.chi.0000199028.76452.a9. [DOI] [PubMed] [Google Scholar]
- Nylund KL, Asparouhov T, Muthén B. Deciding on the number of classes in latent class analysis and growth mixture modeling: A Monte Carlo simulation study. Structural Equation Modeling. 2007;14:535–569. [Google Scholar]
- O’Reilly RC, Braver TS, Cohen JD. A biologically based computational model of working memory. In: Miyake A, Shah P, editors. Models of working memory: Mechanisms of active maintenance and executive control. New York: Cambridge University Press; 1999. pp. 375–411. [Google Scholar]
- Phillips LH. Do “frontal tests” measure executive function? Issues of assessment and evidence from fluency tests. In: Rabbitt P, editor. Methodology of frontal and executive function. Hove, UK: Psychology Press; 1997. pp. 191–213. [Google Scholar]
- Polderman TJC, de Geus EJC, Hoekstra RA, Bartels M, van Leeuwen M, Verhulst FC, Posthuma D, Boomsma DI. Attention problems, inhibitory control, and intelligence index overlapping genetic factors: A study in 9-, 12-, and 18-year-old twins. Neuropsychology. 2009;23:381–391. doi: 10.1037/a0014915. [DOI] [PubMed] [Google Scholar]
- Polderman TJC, Posthuma D, de Sonneville LMJ, Stins JF, Verhulst FC, Boomsma DI. Genetic analyses of the stability of executive functioning during childhood. Biological Psychology. 2007;76:11–20. doi: 10.1016/j.biopsycho.2007.05.002. [DOI] [PubMed] [Google Scholar]
- Posner MI, Rothbart MK. Developing mechanisms of self-regulation. Development and Psychopathology. 2000;12:427–441. doi: 10.1017/s0954579400003096. [DOI] [PubMed] [Google Scholar]
- Posner MI, Rothbart MK. Toward a physical basis of attention and self-regulation. Physics of Life Reviews. 2009;6:103–120. doi: 10.1016/j.plrev.2009.02.001. [DOI] [PMC free article] [PubMed] [Google Scholar]
- Rhea SA, Gross AA, Haberstick BC, Corley RP. Colorado Twin Registry. Twin Research and Human Genetics. 2006;9:941–949. doi: 10.1375/183242706779462895. [DOI] [PubMed] [Google Scholar]
- Roberts RJ, Hager LD, Heron C. Prefrontal cognitive processes: Working memory and inhibition in the antisaccade task. Journal of Experimental Psychology: General. 1994;123:374–393. [Google Scholar]
- Robinson JL, McGrath J, Corley RP. The conduct of the study: Sample and procedures. In: Emde R, Plomin R, Hewitt JK, editors. The transition from infancy to early childhood. New York: Oxford University Press; 2001. pp. 23–41. [Google Scholar]
- Rogers RD, Monsell S. Costs of a predictable switch between simple cognitive tasks. Journal of Experimental Psychology: General. 1995;124:207–231. [Google Scholar]
- Rothbart MK, Rueda MR. The development of effortful control. In: Mayr U, Awh E, Keele SW, editors. Developing individuality in the human brain: A tribute to Michael I Posner. Washington, DC: American Psychological Association; 2005. pp. 167–188. [Google Scholar]
- Rueda MR, Posner MI, Rothbart MK. The development of executive attention: Contributions to the emergence of self-regulation. Developmental Neuropsychology. 2005;28:573–594. doi: 10.1207/s15326942dn2802_2. [DOI] [PubMed] [Google Scholar]
- Rueda MR, Rothbart MK, McCandliss BD, Saccomanno L, Posner MI. Training, maturation, and genetic influence on the development of executive attention. Proceedings of the National Academy of Sciences. 2005;102:14931–14936. doi: 10.1073/pnas.0506897102. [DOI] [PMC free article] [PubMed] [Google Scholar]
- Satorra A, Bentler PM. A scaled difference chi-square test statistic for moment structure analysis. Psychometrika. 2001;66:507–514. doi: 10.1007/s11336-009-9135-y. [DOI] [PMC free article] [PubMed] [Google Scholar]
- Schneider-Rosen K, Wenz-Gross M. Patterns of compliance from eighteen to thirty months of age. Child Development. 1990;61:104–112. [PubMed] [Google Scholar]
- Steinberg L. Cognitive and affective development in adolescence. Trends in Cognitive Sciences. 2005;9:69–74. doi: 10.1016/j.tics.2004.12.005. [DOI] [PubMed] [Google Scholar]
- Stins JF, van Baal GC, Polderman TJC, Verhulst FC, Boomsma DI. Heritability of Stroop and flanker performance in 12-year old children. BMC Neuroscience. 2004;5:49. doi: 10.1186/1471-2202-5-49. [DOI] [PMC free article] [PubMed] [Google Scholar]
- Stroop JR. Studies of interference in serial verbal reactions. Journal of Experimental Psychology. 1935;18:643–662. [Google Scholar]
- Sylvester CY, Wager TD, Lacey SC, Hernandez L, Nichols TE, Smith EE, Jonides J. Switching attention and resolving interference: fMRI measures of executive functions. Neuropsychologia. 2003;41:357–370. doi: 10.1016/s0028-3932(02)00167-7. [DOI] [PubMed] [Google Scholar]
- Toner IJ, Moore LP, Emmons BA. The effect of being labeled on subsequent self-control in children. Child Development. 1980;51:618–621. [Google Scholar]
- van der Mark IL, Bakermans-Kranenburg MJ, van Ijzendoorn MH. The role of parenting, attachment, and temperamental fearfulness in the prediction of compliance in toddler girls. British Journal of Developmental Psychology. 2002;20:361–378. [Google Scholar]
- van der Sluis S, de Jong PF, van der Leij A. Executive functioning in children, and its relations with reasoning, reading, and arithmetic. Intelligence. 2007;35:427–449. [Google Scholar]
- Vazsonyi AT, Huang L. Where self-control comes from: On the development of self-control and its relationship to deviance over time. Developmental Psychology. 2010;46:245–257. doi: 10.1037/a0016538. [DOI] [PubMed] [Google Scholar]
- Wechsler D. Wechsler adult intelligence scale. 3. San Antonio, TX: Psychological Corporation; 1997. [Google Scholar]
- Wilcox RR, Keselman HJ. Modern robust data analysis methods: Measures of central tendency. Psychological Methods. 2003;8:254–274. doi: 10.1037/1082-989X.8.3.254. [DOI] [PubMed] [Google Scholar]
- Xian H, Scherrer JF, Madden PA, Lyons MJ, Tsuang M, True WR, Eisen SA. Latent class typology of nicotine withdrawal: Genetic contributions and association with failed smoking cessation and psychiatric disorders. Psychological Medicine. 2005;35:409–419. doi: 10.1017/s0033291704003289. [DOI] [PubMed] [Google Scholar]
- Yamagata S, Takahashi Y, Kijima N, Maekawa H, Ono Y, Ando J. Genetic and environmental etiology of effortful control. Twin Research and Human Genetics. 2005;8:300–306. doi: 10.1375/1832427054936790. [DOI] [PubMed] [Google Scholar]
- Yntema DB. Keeping track of several things at once. Human Factors. 1963;5:7–17. doi: 10.1177/001872086300500102. [DOI] [PubMed] [Google Scholar]
- Young SE, Friedman NP, Miyake A, Willcutt EG, Corley RP, Haberstick BC, Hewitt JK. Behavioral disinhibition: Its structure and relation to response inhibition across adolescence. Journal of Abnormal Psychology. 2009;118:117–130. doi: 10.1037/a0014657. [DOI] [PMC free article] [PubMed] [Google Scholar]
- Zacks RT, Hasher L. Directed ignoring: Inhibitory regulation of working memory. In: Dagenbach D, Carr TH, editors. Inhibitory processes in attention, memory, and language. San Diego, CA: Academic Press; 1994. pp. 241–264. [Google Scholar]