

SUMMARY
The programmed death-1 (PD-1) molecule is involved in peripheral tolerance and in the immune escape mechanisms during chronic viral infections and cancer. PD-1 interacts with two ligands, PD-L1 and PD-L2. We have investigated, the molecular mechanisms of PD-1 interactions with its ligands by surface plasmon resonance and cell surface binding as well as the ability of the two ligands to compete for PD-1 binding. PD-L1 and PD-L2 bound PD-1 with comparable affinities, but striking differences were observed at the level of the association and dissociation characteristics. PD-L1, but not PD-L2 had a delayed interaction reminiscent of a phenomenom of conformational transition. These mechanisms were confirmed by using PD-L1 mAbs that delayed the dissociation of PD-L1 from PD-1. This mechanism was not restricted to PD-1 binding since PD-L1 behaved in a similar manner with its second ligand, CD80. Finally, we could demonstrate that PD-L1 and PD-L2 competed for PD-1 binding and conversely, an antagonist PD-1 mAb blocked both PD-L1 and PD-L2 binding to PD-1 and strongly enhanced T cell proliferation. These data further emphasize the differential molecular mechanisms of interaction of PD-L1 and PD-L2 with PD-1, and suggest possible new approach for the therapy of chronic infection, cancer and transplantation.
Keywords: Antibodies, Monoclonal; immunology; Antigens, CD; genetics; immunology; Apoptosis Regulatory Proteins; genetics; immunology; Cell Proliferation; Dendritic Cells; immunology; Enzyme-Linked Immunosorbent Assay; Flow Cytometry; Humans; Intercellular Signaling Peptides and Proteins; genetics; immunology; Polymerase Chain Reaction; Protein Binding; T-Lymphocytes; cytology; immunology
Keywords: PD-1, PD-L Ligands, ligand-receptor interaction
INTRODUCTION
Co-receptor signaling is an important mechanism for coordinating and tightly regulating immune responses. The usual scheme of activation of αβ T cells relies on positive signals given by peptide antigens presented by HLA class I or II. Co-receptor signals will either increase or prevent this activation. Among the negative signaling molecules, those belonging to CD28/B7 families are by far the most studied. Three members of this family have been described: CTL-associated antigen-4 (CTLA-4), programmed death-1 (PD-1) and B and T lymphocyte attenuator (BTLA). They all play a role in the control of tolerance [1]. They provide negative signals that limit, terminate and/or attenuate immune responses. PD-1 (CD279 in CD nomenclature) is expressed on activated T and B cells as well as on activated myeloid cells and elicits inhibitory signals upon coligation with the T cell receptor (TCR) [2, 3].
Two PD-1 ligands have thus far been described, PD-L1 also named as B7H1 (CD274), and PD-L2 also named as B7-DC (CD273)[4, 5]. The expression of PD-L1 within non-lymphoid tissues suggests that it may regulate the function of self reactive immune cells in peripheral tissues, or may regulate inflammatory responses [6]. In addition to PD-1, PD-L1 interacts with CD80 in both mice and humans [7, 8]. These new data have shed light on some contradictory results that have been reported regarding PD-1 function [7]. Both PD-L1 and PD-L2 inhibit T cell proliferation, cytokine production and cell adhesion [5, 9], although some contradictory data have suggested a costimulatory function [4]. However, PD-L2 but not PD-L1 triggers reverse signaling in dendritic cells leading to IL-12 production and activation of T cells [10]. PD-L1 and PD-L2 expression depends on distinct stimuli and their expression patterns suggest both overlapping and differential roles in immune regulation [11].
The comparison of PD-L1 and PD-L2 functions is still under investigation but recent publications using KO mice or mAbs indicate functional differences between the two PD-1 ligands [12]. Molecular modelling, site-directed mutagenesis and crystal structures of the complexes between PD-1 and its ligands have given some insights into their mechanisms of interaction [13–16]. However, other parameters are still important to analyze such as the mechanisms of PD-1 interaction with its respective ligands as well as the ability of each ligand to affect the binding of the other.
We have undertaken this work to perform a comprehensive analysis of the characteristics of the interaction of PD-L1 and PD-L2 with PD-1 under kinetic conditions using SPR and on living cells. Furthermore, we have analyzed whether PD-L1 and PD-L2 were able to compete for PD-1 binding.
RESULTS
PD-L1 and PD-L2 differ in their molecular mechanisms of PD-1 binding
We investigated the mechanisms of PD-L1 and PD-L2 binding to PD-1. The fusion proteins as well as Fab fragments of the mAbs used in this study are described in Tables S1 & S2. To pinpoint the different steps of this interaction, we performed a careful SPR analysis following the recommendations published by Rich et al. [17, 18]. In particular specific care was taken to ensure that kinetic analysis was run in appropriate conditions (low active ligand density and high flow rate) and fitted curve parameters were re-checked after fitting to eliminate artefactual parameters and retain relevant ones. Kinetic binding assays were performed to determine the equilibrium dissociation constant between PD-1 and PD-L1 and PD-L2 fusion proteins as well as CD-80, PD-L1 and CTLA-4 fusion proteins. The binding data were first analyzed using the 1:1 Langmuir model. For PD-L2/PD-1 the fitting was very good and yielded a Kd of 11.3 nM (Table 1). Though both recombinant analytes were bivalent, the Langmuir model fitted very well to the data, suggesting the simultaneous engagement of the two binding sites of each molecule; thus for PD-L2, the Kd most likely reflects an avidity value (Supplementary informations figure S1). For PD-L1/PD-1, as well as PD-L1/CD80, the Langmuir model gave a very poor fit and appeared inappropriate to describe the complexity of PD-L1 data set (Supplementary informations figure S2).
Table 1.
Determination of binding characteristics by BIACore SPR technology for PD-1 molecule for its ligands (PD-L1 and PD-L2) and for CD80 molecule for its ligands (PD-L1 and CTLA-4).
| Immobilized protein | Analyte | KD (nM) ± SD | KD # = 1/K (nM) ± SD |
|---|---|---|---|
| PD-1 | PD-L2 | 11.3 (± 1.5) | |
| PD-1 | PD-L1 | 10.4 (± 6.6) | |
| CD80 | PD-L1 | 7.2 (± 1) | |
| CD80 | CTLA-4 | 0.46 (± 0.14) |
Kinetic binding assays were performed, by SPR analysis, to determine the equilibrium dissociation constant between PD-1 and PD-L1 and PD-L2 fusion proteins as well as CD-80, PD-L1 and CTLA-4 fusion proteins (KD (nM) = kd/ka: dissociation constant with ka : association rate constant and kd : dissociation rate constant, SD = standard deviation).
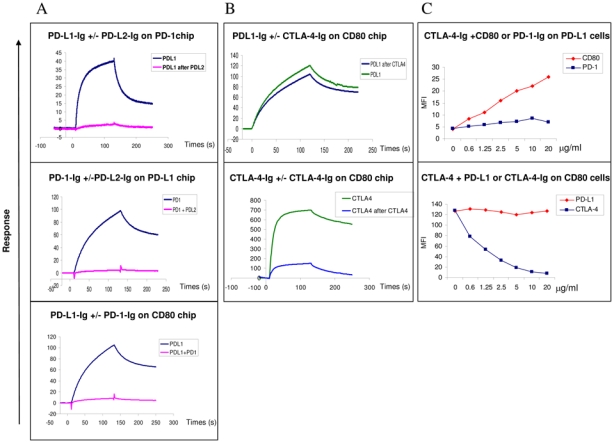
Indeed, as shown in figure 1 (panel A, top row) and Supplementary informations figures S1 & S2, the two ligands interacted with PD-1 with distinct features. PD-L1 associated rapidly and shows a complex biphasic dissociation. For the PD-L1/PD-1 dissociation we observed an early phase, during which PD-L1 rapidly dissociated from PD-1 at the beginning of the dissociation, followed by a later phase characterized by a very low dissociation rate. In contrast PD-L2 showed a regular homogeneous dissociation phase quite characteristic of the Langmuir binding model. To better characterize the PD-L1/PD-1 interaction different models were tested to fit the complex PD-L1 data set (data not shown).
Figure 1. PD-L1 and PD-L2 do not bind to PD-1 with the same molecular mechanism.

We performed SPR analysis using BIAcore T100 and performed the analysis of PD-L1-Ig, PD-L2-Ig binding to PD1-Ig as well as CD80-Ig binding to PD-L1-Ig and CTLA-4-Ig.
(A) Top row: Superimposed sensorgrams representative of PD-L1 and PD-L2 binding to PD-1-Ig chips; Lower row: Sensorgrams of PD-L1-Ig and CTLA-Ig binding to CD80-Ig chips. Proteins were injected for two minutes at a flow rate of 40 μl/min onto PD-1-Ig or CD80-Ig chips and allowed to dissociate for three more minutes. The data shown are representative of five separate experiments.
(B) Superimposed sensorgrams showing short (red) and long (black) injections of PD-L1 (top row) and PD-L2 (lower row) onto PD-1 chip respectively. Proteins at 10 μg/ml were injected for one (short) or seven minutes (long) at a flow rate of 10 μl/min onto the PD-1 chip. Sensorgrams were normalized in the Y axis and aligned in the X axis at the end of injection in order to align the dissociation phases up The data shown are representative of two separate experiments.
The PD-L1 data set fits equally well with all the models excepted for the 1:1 binding. The ligand heterogeneity model was not retained because PD-L2 interaction to the same PD-1 chip is well described by the 1:1 binding model. It is therefore very unlikely that ligand heterogeneity would have an effect only on PD-L1 binding and not on PD-L2 binding as both molecules compete for binding to PD-1 (figure 3A). Regarding the analyte heterogeneity model, fitting the PD-L1 data set using this model appears impossible because the proportion of a potential heterogeneous moiety in the PD-L1-Fc sample is unknown. It was observed that independent batches of PD-L1-Fc recombinant proteins produced at the laboratory or commercially available PD-L1-Fc proteins (purchased from R&D Systems, Catalog number 156-B7) give reliable and comparable results. It is therefore unlikely that the phenomenon observed for PD-L1/PD-1 interaction would be due to heterogeneity of the analyte sample.
Figure 3. PD-L1 and PD-L2 cross compete for PD-1 binding.
The experiments were performed using both SPR analysis using BIAcore (A and B) and flow cytometry (C)
SPR and Facs analysis PD-L1 and CTLA-4 binding to CD80
(A) Analysis by SPR of the binding of PD-L1 to PD-1 or CD80 coated on chips following preincubation with PD-L2 or PD-1 respectively. The data shown are representative of two separate experiments.
Top row: The PD-1 chips were pre-incubated twice with saturating amounts of PDL2 and PD-L1 then were injected in a third step at 10 μg/ml for 2 minutes at a flow rate of 10 μl/min without removing bound PD-L2. Sensorgrams showing the PD-L1 binding in the presence or absence of PD-L2 occupancy are superimposed. Middle row: PD-1 proteins were pre-incubated with saturating amounts of PD-L2 and the resulting complexes were injected at 10 μg/ml for 2 minutes at a flow rate of 10 μl/min onto PD-L1-Ig chips. Sensorgrams showing the PD-1 binding alone or complexed with PD-L2-Ig are superimposed.
Lower row: PD-L1-Ig proteins were pre-incubated with saturating amounts of PD-1- Ig and the resulting complexes were injected at 10 μg/ml for 2 minutes at a flow rate of 10 μl/min onto CD80-Ig chips. Sensorgrams showing the PD-L1 binding alone or complexed with PD-1 are superimposed.
(B) CTLA-4 does not to prevent the binding of PD-L1-Ig to CD80 using SPR analysis. The data shown are representative of two separate experiments. Superimposed sensorgrams representative of PD-L1 (top row) and CTLA-4 (lower row) binding to CD80-Ig chips following or not pre-incubation with CTLA-4-Ig. The CD80 chips were pre-incubated twice with saturating concentrations of CTLA-4- Ig, then in a third step PD-L1-Ig or CTLA-4-Ig used at 10 μg/ml were injected for 2 minutes at a flow rate of 10 μl/min onto CD80-Ig chip and allowed to dissociate for 2 more minutes
(C) CTLA-4 and PD-L1 bind together to CD80 on the cell surface Top row: CTLA-4-Ig can bind to PD-L1 expressing COS cell in presence of CD80 but not PD-1. Biotinylated CTLA-4-Ig protein at 2 μg/ml was incubated with CD80- Ig or PD-1-Ig proteins (from 0 to 20 μg/ml) before addition to PD-L1 expressing cells. The binding of biotinylated CTLA-4 proteins were revealed with StreptAvidin-conjugated with PE, the MFI was indicated in the Y axis. The data shown are representative of three separate experiments.
Lower row: CTLA-4-Ig can bind to CD80 expressing cells in presence of PD-L1-Ig. Biotinylated CTLA-4-Ig at 2 μg/ml was incubated with increasing concentrations of PD-L1-Ig or CTLA-4-Ig (from 0 to 10 μg/ml) before addition to the CD80+ Raji cell. The binding of biotinylated CTLA-4-Ig was detected using StreptAvidin-conjugated with PE, the MFI was indicated in the Y axis. The data shown are representative of three separate experiments.
As PD-L1-Fc recombinant proteins are dimers it is not surprising to improve the quality of fit using the bivalent analyte model. However, although PD-L2-Fc recombinant proteins are also dimers, the PD-L2-Fc data set perfectly fits using the 1:1 binding model. The fact that the two ligands behave differently was puzzling and we hypothesized that a conformational modification mechanism could better explain the PD-L1/PD-1 interaction data set than the bivalent status of the molecule which was common to both ligand. To confirm this hypothesis, the effect of the injection time on binding stability was analyzed (figure 1B). It can be predicted from the “conformational change” model that increasing the contact time will result in dynamic accumulation of “high affinity” complexes at the chip surface and consequently will modify the dissociation phase by slowing the dissociation of the analyte from the immobilized ligand. To validate this hypothesis, we then compared the binding of PD-L1 and PD-L2 to PD-1 chips following two settings; i.e. long or short injections times: 10 μg/ml PD-L1 or PD-L2 fusion proteins were injected over 1 (red) or 7 (black) minutes respectively (Figure 1B). The sensorgrams demonstrate clearly that the contact time influences the stability of PD-L1 binding to the PD-1 chip. The dissociation of PD-L1 to the PD-1 chip was slower with the longer injection time. As a control, for PD-L2 the dissociation kinetic was not affected by increasing the injection time (Figure 1B, lower row).
These data clearly validate the choice for the two state reaction model to describe PD-L1/PD1 interaction. For comparison, the bivalent analyte model on is own could not explain these observations. So the “conformational change” model gave the best and reliable fit and yielded an apparent Kd of 10.4 nM on PD-1 chips (Table 1).
Altogether, these data demonstrate striking differences in the mechanisms of interaction of PD-L1 and PD-L2 with PD-1. The data obtained with PD-L1 fit with a model where a conformation change will be needed for its efficient binding with its receptor. Finally, we analyzed whether this conformational change model was restricted to PD-L1/PD-1 interaction, and hence due to the specific interaction with this ligand, or whether it also applies to another PD-L1 ligand, CD80. As shown in figure 1A (lower row), the parameters of PD-L1 binding to CD80 fitted also with the conformational change model. Altogether, these data indicate that PD-L1 and PD-L2 differ in their binding parameters to PD-1. In addition, PD-L1 binds to its two ligands, namely PD-1 and CD80 with similar association and dissociation mechanisms.
Non blocking PD-L1 mAbs increase the binding of PD-L1 to PD-1
To further challenge the conformational change model, we tested whether PD-L1 mAbs could modify the mechanisms of interaction of PD-L1 to PD-1.
We evaluated whether any of the three PD-L1 mAbs made in our laboratory could prevent the interaction of PD-L1 to PD-1. The clone (PD-L1.3), but not the two others (PD-L1.1 and PD-L1.2), blocked PD-1/PD-L1 interaction (data not shown). As PD-L1 binding to PD-1 could induce a conformational change of PD-L1, we reasoned that the two mAbs (PD-L1.1 and PD-L1.2) that do not interfere with PD-1/PD-L1 binding might affect other PD-L1 regions critical for ligand-receptor interaction. Hence, we investigated whether the anti-PD-L1 antibodies that do not block binding to PD-1 could influence this phenomenon. PD-L1-Ig proteins were incubated with a saturating concentration of PD-L1.1 and PD-L1.2 antibody Fabs and injected onto the PD-1 chip (Figure 2A). We observed that pre-incubation with both non-blocking anti-PD-L1 antibodies clearly modifies the dissociation of PD-L1-Ig proteins from the PD-1 chip. The PD-L1 dissociation is slower when PD-L1 is bound to either PD-L1.1 Fab or PD-L1.2 Fab. The binding of PD-L1.1 Fab or PD-L1.2 Fab to PD-L1 increases the stability of the PD-L1/PD-1 interaction, perhaps by influencing the conformational change of PD-L1. These data seem in line with the “conformational change” model that we chose for the fitting of PD-L1 binding to PD-1. However, the fact that the conformational transition phenomenon was observable using the BIAcore indicates that the modification of the PD-L1 state is not a fast phenomenon. Taking in account these considerations, we next investigated whether the conformational change could be observed on native PD-L1 molecules expressed at the cell surface.
Figure 2. Anti-PD-L1 mAbs (PD-L1.1 and PD-L1.2) stabilize the binding of PDL1 to PD-1.

(A) Superimposed sensorgrams showing the injections of PD-L1-Ig (none) or the injections of PD-L1-Ig pre-incubated with anti-PD-L1 antibodies onto PD-1 chip. PD-L1-Ig at 10 μg/ml were pre-incubated with PD-L1.1 (red), PD-L1.2 (black) and PD-L1.3 (blue) anti-PD-L1 antibody Fabs at a saturating concentration of 100 μg/ml and injected for 10 minutes at a flow rate of 10 μl/min onto the PD-1-Ig chip. Sensorgrams were normalized in the Y axis and aligned in the X axis at the end of injection. The data shown are representative of three separate experiments.
(B) PD-L1.1, PD-L1.2 and PD-L1.3 Fab mAbs were incubated with PD-L1 expressing cells for 5 or 30 minutes before PD-1-Ig incubation. The binding of PD-1 Ig was revealed with Goat anti human (GAH) conjugated PE, the MFI ratio was indicated in the Y axis. The data shown are representative of three separate experiments.
Thus, the stabilizing effect of PDL1.1 and PDL1.2 non-blocking antibodies on the binding of PD-L1 to PD-1 was analyzed at a cellular level. PD-L1 expressing COS cells were incubated for 5 or 30 minutes with the three different anti-PD-L1 Fabs. Then, PD-1-Ig protein binding was tested by flow cytometry analysis. The PD-L1.1 Fab pre-incubation induced an increase of the MFI due to PD-1 protein binding (Figure 2B). This increase occurred as early as 5 minutes post-Fab injection and was further enhanced after 30 minutes. This result was in accordance with the data of the SPR analysis (Figure 2A). As shown in Figure 2B, both non-blocking mAbs, PD-L1.1 and PD-L1.2, induce an increase in PD-1-Ig binding to PD-1; as control, we used the blocking PD-L1.3 mAb that impaired this binding. Similar results were obtained using immature DCs expressing PD-L1 (data not shown). Taken together, the non-blocking PD-L1 mAbs are not neutral but could in fact enhance the binding of PD-L1 to PD-1.
PD-L1 and PD-L2 cross-compete for PD-1 binding
We next investigated whether PD-L1 and PD-L2 could bind to PD-1 simultaneously or whether they would cross-compete for PD-1 occupancy. Such experiments can potentially provide insight on the mechanisms involved in the functionally distinct roles played by PD-L1 and PD-L2 during immune responses. In a first set of experiments, the PD-1 chips were saturated using PD-L2 by two successive injection steps, and PD-L1 was injected in a third step without removing bound PD-L2 (Figure 3A). Sensorgrams, corresponding to the third injection step show that PD-L1 can out-compete PD-L2 following saturation of PD-L2 occupancy (Figure 3A, top row). In another experimental setting, we pre-incubated PD-1 recombinant proteins at 10 μg/ml with increasing concentrations of PD-L2 (from 0 to 60 μg/ml) and injected the complexes onto the PD-L1 chip. PD-L2 pre-incubation prevented PD-1 binding to PD-L1 in a dose dependent manner (Figure 3A, middle row for 0 and 60 μg/ml concentration, and data not shown).
These data demonstrate that each of the PD-1 ligands block the binding of the other ligand in a dose dependent manner. Similar results were also obtained by flow cytometry on PD-1 transfected cells (data not shown).
As previously shown, human PD-L1 interacts with human CD80 (Figure 3A, lower row). In order to analyze a possible interference of the binding of PD-L1 to CD80 in the presence of PD-1, we performed pre-incubation experiments, and show that pre-incubation of PD-L1 with PD-1 prevents PD-L1 interaction with CD80 (Figure 3A, lower row). We next tested the interaction of CD80 with CTLA-4 and PD-L1. In agreement with the data already reported, there is a strong binding of CD80 to CTLA-4 that is prevented by CTLA-4-Ig itself (data not shown). Using both SPR and cells expressing PD-L1 or CD80, we then tested whether CD80 could simultaneously bind CTLA-4 and PD-L1 (Figure 3B and 3C). Prior binding of CTLA-4 to CD80 does not prevent PD-L1 binding (Figure 3B, top row). As a control, a CD80 mAb, 2D10.4 did not block PD-L1 binding to CD80 whereas it completely abrogated the interaction of CTLA-4 with CD80 (data not shown). In addition, the expression of PD-L1 on the cell surface allows the detection of labelled CTLA-4-Ig on the cells, but only when CD80-Ig was present and hence able to bind to PDL-L1 (Figure 3C, top and middle rows). This effect was dose-dependent and not observed using PD1-Ig the other PD-L1 ligand (Figure 3C, top and middle rows). Finally, the binding of labelled CTLA-4-Ig to the CD80 expressing Raji cells was not inhibited by PD-L1-Ig (Figure 3C, middle row). These experiments demonstrate, in addition to supplementary informations figures S4 and S5, that CTLA-4 and PD-L1 can bind to human CD80 simultaneously.
PD-1.3 mAb prevents the binding of both PD-L1 and PD-L2 to PD-1
In a reverse experiment, we investigated whether pre-bound PD-1 mAbs could block the binding of PD-L1 and PD-L2 to PD-1. SPR analysis were performed using PD-1 sensor chips pre-incubated with two PD-1 mAbs made for this study, then PD-L binding was evaluated (Figure 4A). As shown in Figure 4 panels B and C, mAb PD-1.3 but not mAb PD-1.6 completely inhibited the binding of both PD-L1 (Figure 4B and 4C, upper panels) and PD-L2 (Figure 4B and 4C, lower panels) to PD-1. In a reciprocal experiment, PD-1.3 mAb blocked the binding of PD-1-Ig to PD-L1 chips in a dose dependent manner (data not shown). In flow cytometry analysis, mAb PD-1.3 inhibits PD-1-Ig binding to PD-L1 and PD-L2 expressing cells (Figure 4C). PD-1.3 mAb inhibits PD-L1 or PD-L2-Ig binding to PD-1 expressing cells (data not shown). These data are in line with another recently described PD-1 mAb [19].
Figure 4. The PD1.3 mAb blocks the PD-1 binding to both PD-L1 and PD-L2 and enhances T cell activation.
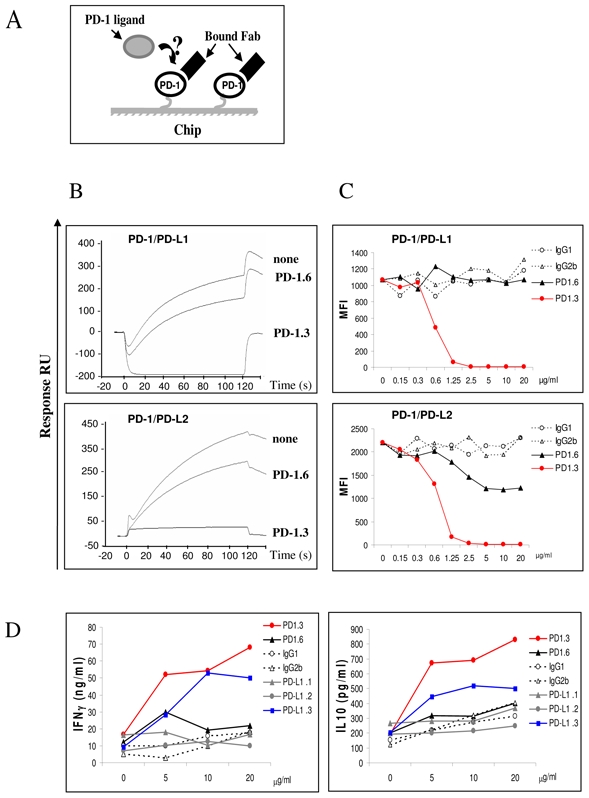
(A) A schematic representation of the surface competitive binding inhibition used in (B). In a first step the immobilized PD-1 proteins are saturated using the antibody Fabs and the corresponding PD-1 ligands are injected as a soluble analyte in a second step.
(B) PD-L1-Ig (top row) and PD-L2-Ig (lower row) were injected at 10 μg/ml for two minutes at a flow rate of 10μl/min onto PD-1 chip (none), or PD-1 chip pre-incubated with anti PD-1 Fab, PD-1.3 or PD-1.6. Sensorgrams showing the binding of the PD-1 ligands in the different situations are superimposed. The data shown are representative of three separate experiments.
(C) PD-1. 3 mAb prevents PD-L1-Ig and PD-L2-Ig binding to cells expressing PD-1. Flow cytometry analysis on PD-1 expressing COS cells. PD-1.3, PD-1.6 or isotype control mAbs, at increasing concentration (from 0 to 20 μg/ml) were pre-incubated with PD-L1 or PD-L2-Ig proteins. The binding of ligands proteins were revealed with goat anti human (GAH) conjugated with PE, the MFI was indicated in the Y axis. The data shown are representative of three separate experiments.
(D) PD-1.3 and PD-L1.3 mAbs are able to induce the IFN-γ and IL-10 production in CD4+ T cells upon DC cell contacts. Allogenic iDC were cocultured with CD4+ T cells with increasing concentration of PD-1 and PD-L1 mAbs or isotype control (from 0 to 20 μg/ml). Cultures were incubated for 5 days, supernatants were removed for cytokine analysis. The levels of IFN-γ production and IL-10 production were determined in duplicate by ELISA detection. The data shown are representative of two separate experiments.
PD-1 mAbs can modulate T cell activation by allogeneic immature dendritic cells
We next investigated the functional capabilities of the mAbs directed against PD-1. We tested their ability to enhance the proliferation of allogeneic T cells against immature monocytes derived dendritic cells. The mAb inhibiting PD-1 ligand interaction, PD-1.3 but not the non inhibitory PD-1.6 was able to enhance the activation of CD4 T cells as indicated by an increased INFγ and IL-10 production (Figure 4D) and T cell proliferation (data not shown).
Altogether, these data demonstrate that the two ligands compete for PD-1 binding and conversely that a blocking anti-PD-1 mAb prevents PD-1 ligand binding and enhances T cell activation.
DISCUSSION
In this study, we have undertaken the analysis of two important features of the interaction of PD-1 with its two ligands PD-L1 and PD-L2. In a first set of experiments we analyzed the molecular mechanisms involved in the binding of PD-L1 and PD-L2 to PD-1 and showed that they were distinct. The mechanism of PD-L1 binding to PD-1 appears to be more complex involving significant and detectable conformational change (figure 5A). We found that non-blocking anti-PD-L1 antibodies could stabilize the PD-L1/PD-1 interaction possibly by freezing PD-L1 in a high affinity conformation. The conformational change was not limited to the interaction of PD-L1 to PD-1, but was also observed with the other known PD-L1 ligand, CD80 (Figure 5B). In another set of experiments, we also demonstrate that PD-L1 and PD-L2 cross-compete for binding to PD-1.
Figure 5. Diagrams of potential mechanisms for PD-1/PD-L1 interactions.
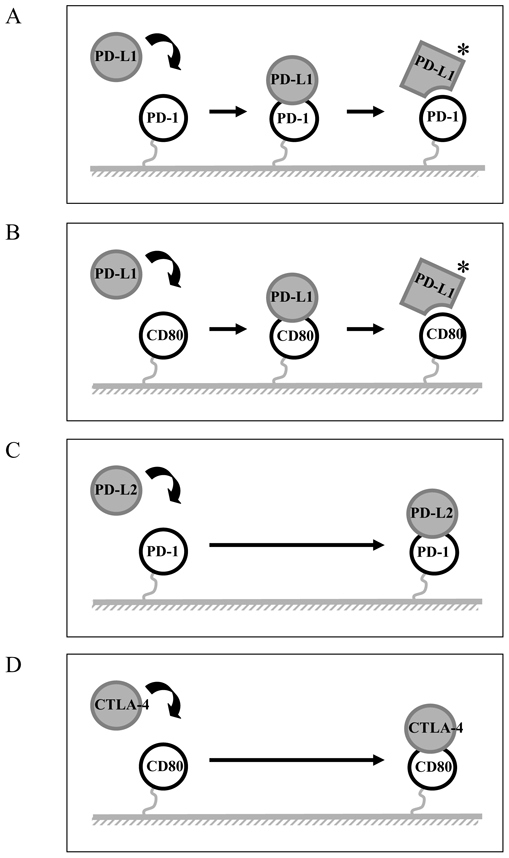
(A and B) A schematic representation of the mechanism of PD-L1 binding to PD-1 and CD80 appears to involve significant and detectable conformational change. (C and D) A schematic representation of the mechanism of PD-L2 and CTLA-4 interact directly with PD-1 and CD80, respectively.
The PD-L1 and PD-L2 molecules have various distinct features that explain their interaction with their ligands. So far, the differences in affinity for their ligands have been identified [16], as well as differences in their specificity, since PD-L1 but not PD-L2 could bind both PD-1 and CD80 [7, 8].
An important characteristic of PD-L1 and PD-L2 binding to their receptor relies on the relative binding affinities for PD-1. Both relative affinities of PD-L1 for PD-1 and PD-L2 for PD-1 are similar (Kd values around 10 nM) (Figure 1 and Table 1). The results are in line with previously published observations for PD-L2, but differ qualitatively for PD-L1 [16]. The differences can be related to the method of SPR analysis. Here, we applied the guidelines defined by Rich et al. [17, 18], where low concentrations of analytes were immobilized to avoid problems of mass effects and the PD-L1 data set was fitted using the appropriate two state reaction model that gave lower KD value than the 1:1 binding model (supplementary informations Figures S2 and S3, middle panels).
Molecular mechanisms of the binding of PD-L1 and PD-L2 are different. Recent data might shed light on the structural basis of these differences, and to probe the implications of the higher affinity binding of PD-L2 to PD-1 [15]. The crystal structure of the complexes between PD-1/PD-L1 and PD-1/PD-L2 have been recently resolved [14, 15] and show a 1:1 receptor/ligand stochiometry, with interactions primarily between the faces of the IgV domains. This deletes the C″ strand of PD-L2, and the shortened C′ strand lies above and at a right angle on the lower portion of the GFC face. These differences leave the upper portion of the GFC faces of PD-L1 and PD-L2 very similar and this is where PD-1 binds. The lower portion of the GFC face is very different. Nine of these residues are conserved in all known PD-L1 sequences, and it was reported that mutations in this segment affect binding of PD-L1 to PD-1 [13].
A question which arises is whether there are, within PD-L1 and PD-L2, structural features that might explain the major differences in the mode of interaction of these two ligands to their shared cognate receptor, PD-1. A significant difference between PD-L1 and PD-L2 is a 14 amino acid gap in the IgV domain of PD-L2.
Another difference is that PD-L1, but not PD-L2, binds to CD80 [7]. The sites of interaction between CD80 and PD-L1 were mapped to their respective IgV domains, although the precise locations have yet to be elucidated. Our data shows that the “conformational change” model that characterized PD-L1 binding to PD-1 was also observed when we analysed the binding of PD-L1 to CD80. The regions on the IgV domain that differ between PD-L1 and PD-L2, such as the lower portion of the GFC face are attractive candidates for binding of CD80 and may also be explain the differences in their binding characteristics. Mutational and structural analysis will be required to confirm this hypothesis.
Of interest, PD-L1 mAbs are useful tools that helped us to further argue for the “conformational change” model. Addition of PD-L1.1 and PD-L1.2 Fab fragments decreased the dissociation phase of the interaction of PD-L1 with PD-1, both by SPR and by flow cytometry analysis. In addition, we could screen chemical compounds or new mAbs that would allow the decreased dissociation of PD-L1 from its ligand. An expected consequence would be the ability to increase PD-1 triggering and possible decrease of specific immune responses.
PD-L1 and PD-L2 cross compete for PD-1 binding. The structural features of binding of PD-1 to PD-L1 and PD-L2 reported recently completely fit with our observations. PD-1 uses its front β-face (GFCC′ strands and CC′, CC″, and FG loops) to bind both to the front β-face of PD-L1 (GFCC′) or PD-L2 (AGFC strands and FG loop) [14, 15]. Consistent with these structural studies, our data demonstrate that when both ligands are available on the same cell, they will compete for PD-1 interaction and function. This observation is of utmost importance since the concurrent presence of both ligands might modify the functional outcome.
Several animal models suggest that distinct function could be elicited by PD-L1 and PD-L2 [20–24]. Hence, the ability of PD-L1 and PD-L2 to compete for PD-1 might be important to consider especially on cells that are known to express both ligands, such as APCs, but also in tissues undergoing inflammation [1]. However, differences stand at the levels of kinetics and expression levels. In general, PD-L2 is expressed late, and to lower levels, in usual conditions such as maturation of DCs by LPS. However, the cytokine milieu, such as Th2 conditions, might modify this expression and favor PD-L2 in contrast to PD-L1. At similar levels of expression, this competition might be important based on the different functions for both PD-L1 and PD-L2 described above, the reasons are unknown so far. Cross competition between PD-L1 and PD-L2 may also be important in peripheral tissues. Shin et al. have shown that PD-L2, but not PD-L1 was found to elicit direct activating effects on DCs [25], this effect is supposed to enhance immune responses. However, the concurrent presence of PD-L1 on the same cell might prevent this activating effect PD-L2 due to competition with PD-1 availability.
Altogether, our data shed new light on the physiology and the molecular mechanisms of the interaction between PD-L1, PD-L2 and their receptor PD-1. These data together with the design of new targeted mAb therapies devised to completely abrogate binding of PD-1 to both its ligands is important both in the understanding of the physiology of these molecules and for the design of new immune interventions. In addition, these observations are also important for devising reagents that would specifically enhance PD-L1 function via increased interaction with PD-1, as opposed to PD-L2, with potentials for intervention in transplantation and autoimmune diseases.
MATERIALS AND METHODS
Constructs
Human PD-1, CTLA-4, PD-L1 and PD-L2 cDNAs were generated by RT-PCR using primers shown in Table S1. Ig fusion genes were generated by amplification of the respective extracellular regions of PD-1, CTLA-4 and their respective ligands cloned in frame with the Fc fragment of the human IgG1 sequence.
PD-1, PD-L1, PD-L2, CTLA-4 and CD80 soluble human Ig Fusion proteins
The Ig fusion proteins were produced by transfection of the plasmids in COS cells with Fugene 6 according to the manufacturer’s protocol (ROCHE), the supernatants were collected seven days later. The proteins were purified from supernatants on Affigel Protein A as previously described [26]. Purity and quality of the human Ig fusion proteins were controlled by SDS-PAGE and by cell surface staining. CD80-Ig was purchased from R&D systems.
Generation of anti-human PD-1, PD-L1, PD-L2 and CD80 monoclonal antibody and Fab fragmentation
MAbs to human PD-1, PD-L1 and PD-L2 were produced similarly. Female BALB/c mice were immunised by IP injection with 10μg of human Ig fusion protein with Freund adjuvant. After fusion, the hybridoma supernatants were screened by cell surface staining using COS cells line transfected with the corresponding plasmids. Clones PD-1.3 (mouse, IgG2b) and PD-1.6 (mouse, IgG1), PD-L1.1, PD-L1.2 and PD-L1.3 (mice, IgG1) and PD-L2 (mouse, IgG1) were chosen as reagents for flow cytometry and BIAcore analysis and functional studies. CD80 mAb 2D10.4 as been previously reported [27].
Fab fragmentation was performed using papain with ImmunoPure Fab Preparation Kit according to the manufacturer’s protocol (PIERCE).
Flow cytometry analysis
The staining of Raji B cells and transiently transfected COS cells followed the basic procedure. Cells were analyzed on a FACS CANTO flow cytometer (Becton Dickinson).
The binding of the fusion-Ig proteins was revealed with Goat anti human (GAH) conjugated PE. The results are expressed as mean fluorescence intensity (MFI).
Surface plasmon resonance (SPR) analysis
All SPR measurements were performed on a Biacore T100 apparatus (Biacore GE Healthcare) at 25°C (except for figure 1B which were done on a Biacore 1000 Upgrade). In all SPR experiments, HBS-EP buffer (Biacore GE Healthcare) served as running buffer and sensorgrams were analyzed with Biaevaluation 4.1 software.
For protein immobilization, recombinant proteins were immobilized covalently to carboxyl groups in the dextran layer on a Sensor Chip CM5. The sensor chip surface was activated with EDC/NHS (N-ethyl-N′-(3-dimethylaminopropyl) carbodiimidehydrochloride and N-hydroxysuccinimide (Biacore GE Healthcare)). Proteins were diluted to 10 μg/ml in coupling buffer (10 mM acetate, pH 5.2) and injected until the appropriate immobilization levels giving Rmax values below 200 RU were reached [17, 18].
Deactivation of the remaining activated groups was performed using 100 mM ethanolamine pH 8 (Biacore GE Healthcare).
In order to determine the affinity of proteins serial dilutions from 0.3 to 30 nM and from 1.37 to 90 nM of soluble antibodies and recombinant proteins respectively were injected for 2 min at a constant flow rate of 40 μl/min on dextran layers containing immobilized recombinant target proteins and allowed to dissociate for 3 min before regeneration by a ten seconds injection of 500 mM NaCl and 10 mM NaOH buffer. The resulting sensorgrams were analysed by global fitting using the appropriate model.
For surface competitive binding inhibition experiments, the soluble analytes were injected at a constant concentration of 10 μg/ml on dextran layers containing appropriate immobilized recombinant target proteins. Each competition cycle consisted of three injection steps of 2 min at 10 μl/min constant flow rate. Firstly, one analyte is injected twice. Secondly, without removing the first analyte, a second analyte is injected and sensorgrams and RU values are monitored. Second analyte sensorgram is compared to the sensorgram obtained when this analyte is injected directly on nude recombinant target proteins. Percentage of second analyte binding inhibition by first analyte (I2-1) was determined from RU values obtained 10 seconds after the end of injections, using the following formula: I2-1 = (1−(RU2-1/RU2))*100. RU2-1 and RU2 are second analyte RU values monitored in the presence and in the absence of first analyte respectively. After each cycle, Sensor chips were regenerated as described above.
For solution inhibition experiments, the soluble recombinant proteins at a constant concentration of 10 μg/ml were pre-incubated with increasing concentrations of cognate recombinant ligands (from 0 to 60 μg/ml) or antibodies (from 0 to 80 μg/ml and 0 to 120 μg/ml for PD-1 mAbs, PD-L2 mAbs and PD-L1 mAbs respectively) and injected for 2 minutes at a flow rate of 10 μl/min onto the appropriate chips. RU values were monitored 10 seconds after the end of injection. After each cycle, Sensorchips were regenerated as described above.
To measure the stabilization effect of PD-L1.1 and PD-L1.2 antibodies on PD-L1 binding to PD-1, the soluble recombinant PD-L1-Ig proteins at a constant concentration of 10 μg/ml were pre-incubated with a saturating concentration of 100 μg/ml of PD-L1.1 and PD-L1.2 antibody Fabs and injected for 10 minutes at a flow rate of 10 μl/min onto the PD-1 chips. The sensorgrams were monitored, normalized to 100 RU in the Y axis and compared to those obtained without pre-incubation with anti-PD-L1 antibody Fabs.
We observed that covalent coupling inactivates the PD-L2 recombinant protein and prevents PD-1-Ig and PD-L2 mAb binding (data not shown) indicating that the binding site problably contains free NH2, whereas it had no impact on PD-L1-Ig and PD-L2-Ig binding to immobilized PD-1-Ig (Figures 1 and 4A) nor on PD-1-Ig binding to immobilized PD-L1-Ig (Figure 1).
Preparation of immature monocyte-derived DCs (iDC)
iDCs were prepared from monocytes according to previously established protocols [28]. Monocytes were obtained from PBMC by negative selection using the Monocyte Isolation Kit (Miltenyi Biotec).
Allogenic stimulation of CD4+ T cells with iDC
CD4+ T cells were isolated from PBMC with negative selection with CD4+ T Cell Isolation Kit II human (Miltenyi Biotec). CD4+ T cells were cocultured with iDC/well with mAbs to PD-1, PD-L1 and PD-L2. Cultures were incubated for 5 days.
ELISA for cytokine analysis
IFN-γ and IL-10 production were detected in culture supernatants by ELISA detection using OptEIATM human (BD Biosciences).
Acknowledgments
This work was sponsored by Institut National de la Santé et de la Recherche Médicale and Institut Paoli Calmettes. N. Serriari fellowship was sponsored by Bourse France- Algérie (BFA) and Association pour la Recherche contre le Cancer.
Abbreviations
- PD-1
Program death –1
- CTLA-4
CTL-associated antigen-4
- SPR
surface plasmon resonance
Footnotes
CONFLICT OF INTEREST
The authors declare no financial or commercial conflict of interest.
References
- 1.Greenwald RJ, Freeman GJ, Sharpe AH. The B7 family revisited. Annu Rev Immunol. 2005;23:515–548. doi: 10.1146/annurev.immunol.23.021704.115611. [DOI] [PubMed] [Google Scholar]
- 2.Ishida Y, Agata Y, Shibahara K, Honjo T. Induced expression of PD-1, a novel member of the immunoglobulin gene superfamily, upon programmed cell death. Embo J. 1992;11:3887–3895. doi: 10.1002/j.1460-2075.1992.tb05481.x. [DOI] [PMC free article] [PubMed] [Google Scholar]
- 3.Agata Y, Kawasaki A, Nishimura H, Ishida Y, Tsubata T, Yagita H, Honjo T. Expression of the PD-1 antigen on the surface of stimulated mouse T and B lymphocytes. Int Immunol. 1996;8:765–772. doi: 10.1093/intimm/8.5.765. [DOI] [PubMed] [Google Scholar]
- 4.Dong H, Zhu G, Tamada K, Chen L. B7-H1, a third member of the B7 family, co-stimulates T-cell proliferation and interleukin-10 secretion. Nat Med. 1999;5:1365–1369. doi: 10.1038/70932. [DOI] [PubMed] [Google Scholar]
- 5.Latchman Y, Wood CR, Chernova T, Chaudhary D, Borde M, Chernova I, Iwai Y, Long AJ, Brown JA, Nunes R, Greenfield EA, Bourque K, Boussiotis VA, Carter LL, Carreno BM, Malenkovich N, Nishimura H, Okazaki T, Honjo T, Sharpe AH, Freeman GJ. PD-L2 is a second ligand for PD-1 and inhibits T cell activation. Nat Immunol. 2001;2:261–268. doi: 10.1038/85330. [DOI] [PubMed] [Google Scholar]
- 6.Keir ME, Liang SC, Guleria I, Latchman YE, Qipo A, Albacker LA, Koulmanda M, Freeman GJ, Sayegh MH, Sharpe AH. Tissue expression of PD-L1 mediates peripheral T cell tolerance. J Exp Med. 2006;203:883–895. doi: 10.1084/jem.20051776. [DOI] [PMC free article] [PubMed] [Google Scholar]
- 7.Butte MJ, Keir ME, Phamduy TB, Sharpe AH, Freeman GJ. Programmed death-1 ligand 1 interacts specifically with the B7-1 costimulatory molecule to inhibit T cell responses. Immunity. 2007;27:111–122. doi: 10.1016/j.immuni.2007.05.016. [DOI] [PMC free article] [PubMed] [Google Scholar]
- 8.Butte MJ, Pena-Cruz V, Kim MJ, Freeman GJ, Sharpe AH. Interaction of human PD-L1 and B7-1. Mol Immunol. 2008 doi: 10.1016/j.molimm.2008.05.014. [DOI] [PMC free article] [PubMed] [Google Scholar]
- 9.Saunders PA, Hendrycks VR, Lidinsky WA, Woods ML. PD-L2:PD-1 involvement in T cell proliferation, cytokine production, and integrin-mediated adhesion. Eur J Immunol. 2005;35:3561–3569. doi: 10.1002/eji.200526347. [DOI] [PubMed] [Google Scholar]
- 10.Nguyen LT, Radhakrishnan S, Ciric B, Tamada K, Shin T, Pardoll DM, Chen L, Rodriguez M, Pease LR. Cross-linking the B7 family molecule B7-DC directly activates immune functions of dendritic cells. J Exp Med. 2002;196:1393–1398. doi: 10.1084/jem.20021466. [DOI] [PMC free article] [PubMed] [Google Scholar] [Retracted]
- 11.Loke P, Allison JP. PD-L1 and PD-L2 are differentially regulated by Th1 and Th2 cells. Proc Natl Acad Sci U S A. 2003;100:5336–5341. doi: 10.1073/pnas.0931259100. [DOI] [PMC free article] [PubMed] [Google Scholar]
- 12.Keir ME, Butte MJ, Freeman GJ, Sharpe AH. PD-1 and its ligands in tolerance and immunity. Annu Rev Immunol. 2008;26:677–704. doi: 10.1146/annurev.immunol.26.021607.090331. [DOI] [PMC free article] [PubMed] [Google Scholar]
- 13.Wang S, Bajorath J, Flies DB, Dong H, Honjo T, Chen L. Molecular modeling and functional mapping of B7-H1 and B7-DC uncouple costimulatory function from PD-1 interaction. J Exp Med. 2003;197:1083–1091. doi: 10.1084/jem.20021752. [DOI] [PMC free article] [PubMed] [Google Scholar]
- 14.Lin DY, Tanaka Y, Iwasaki M, Gittis AG, Su HP, Mikami B, Okazaki T, Honjo T, Minato N, Garboczi DN. The PD-1/PD-L1 complex resembles the antigen-binding Fv domains of antibodies and T cell receptors. Proc Natl Acad Sci U S A. 2008;105:3011–3016. doi: 10.1073/pnas.0712278105. [DOI] [PMC free article] [PubMed] [Google Scholar]
- 15.Lazar-Molnar E, Yan Q, Cao E, Ramagopal U, Nathenson SG, Almo SC. Crystal structure of the complex between programmed death-1 (PD-1) and its ligand PD-L2. Proc Natl Acad Sci U S A. 2008;105:10483–10488. doi: 10.1073/pnas.0804453105. [DOI] [PMC free article] [PubMed] [Google Scholar]
- 16.Youngnak P, Kozono Y, Kozono H, Iwai H, Otsuki N, Jin H, Omura K, Yagita H, Pardoll DM, Chen L, Azuma M. Differential binding properties of B7-H1 and B7-DC to programmed death-1. Biochem Biophys Res Commun. 2003;307:672–677. doi: 10.1016/s0006-291x(03)01257-9. [DOI] [PubMed] [Google Scholar]
- 17.Rich RL, Myszka DG. Survey of the year 2007 commercial optical biosensor literature. J Mol Recognit. 2008;21:355–400. doi: 10.1002/jmr.928. [DOI] [PubMed] [Google Scholar]
- 18.Rich RL, Papalia GA, Flynn PJ, Furneisen J, Quinn J, Klein JS, Katsamba PS, Waddell MB, Scott M, Thompson J, Berlier J, Corry S, Baltzinger M, Zeder-Lutz G, Schoenemann A, Clabbers A, Wieckowski S, Murphy MM, Page P, Ryan TE, Duffner J, Ganguly T, Corbin J, Gautam S, Anderluh G, Bavdek A, Reichmann D, Yadav SP, Hommema E, Pol E, Drake A, Klakamp S, Chapman T, Kernaghan D, Miller K, Schuman J, Lindquist K, Herlihy K, Murphy MB, Bohnsack R, Andrien B, Brandani P, Terwey D, Millican R, Darling RJ, Wang L, Carter Q, Dotzlaf J, Lopez-Sagaseta J, Campbell I, Torreri P, Hoos S, England P, Liu Y, Abdiche Y, Malashock D, Pinkerton A, Wong M, Lafer E, Hinck C, Thompson K, Primo CD, Joyce A, Brooks J, Torta F, Bagge Hagel AB, Krarup J, Pass J, Ferreira M, Shikov S, Mikolajczyk M, Abe Y, Barbato G, Giannetti AM, Krishnamoorthy G, Beusink B, Satpaev D, Tsang T, Fang E, Partridge J, Brohawn S, Horn J, Pritsch O, Obal G, Nilapwar S, Busby B, Gutierrez-Sanchez G, Gupta RD, Canepa S, Witte K, Nikolovska-Coleska Z, Cho YH, D’Agata R, Schlick K, Calvert R, Munoz EM, Hernaiz MJ, Bravman T, Dines M, Yang MH. A global benchmark study using affinity-based biosensors. Anal Biochem. 2009;386:194–216. doi: 10.1016/j.ab.2008.11.021. [DOI] [PMC free article] [PubMed] [Google Scholar]
- 19.Wong RM, Scotland RR, Lau RL, Wang C, Korman AJ, Kast WM, Weber JS. Programmed death-1 blockade enhances expansion and functional capacity of human melanoma antigen-specific CTLs. Int Immunol. 2007;19:1223–1234. doi: 10.1093/intimm/dxm091. [DOI] [PubMed] [Google Scholar]
- 20.Zhu B, Guleria I, Khosroshahi A, Chitnis T, Imitola J, Azuma M, Yagita H, Sayegh MH, Khoury SJ. Differential role of programmed death-ligand 1 [corrected] and programmed death-ligand 2 [corrected] in regulating the susceptibility and chronic progression of experimental autoimmune encephalomyelitis. J Immunol. 2006;176:3480–3489. doi: 10.4049/jimmunol.176.6.3480. [DOI] [PubMed] [Google Scholar]
- 21.Martin-Orozco N, Wang YH, Yagita H, Dong C. Cutting Edge: Programmed death (PD) ligand-1/PD-1 interaction is required for CD8+ T cell tolerance to tissue antigens. J Immunol. 2006;177:8291–8295. doi: 10.4049/jimmunol.177.12.8291. [DOI] [PubMed] [Google Scholar]
- 22.Liang SC, Greenwald RJ, Latchman YE, Rosas L, Satoskar A, Freeman GJ, Sharpe AH. PD-L1 and PD-L2 have distinct roles in regulating host immunity to cutaneous leishmaniasis. Eur J Immunol. 2006;36:58–64. doi: 10.1002/eji.200535458. [DOI] [PubMed] [Google Scholar]
- 23.Matsumoto K, Inoue H, Nakano T, Tsuda M, Yoshiura Y, Fukuyama S, Tsushima F, Hoshino T, Aizawa H, Akiba H, Pardoll D, Hara N, Yagita H, Azuma M, Nakanishi Y. B7-DC regulates asthmatic response by an IFN-gamma-dependent mechanism. J Immunol. 2004;172:2530–2541. doi: 10.4049/jimmunol.172.4.2530. [DOI] [PubMed] [Google Scholar]
- 24.Fukushima A, Yamaguchi T, Azuma M, Yagita H, Ueno H. Involvement of programmed death-ligand 2 (PD-L2) in the development of experimental allergic conjunctivitis in mice. Br J Ophthalmol. 2006;90:1040–1045. doi: 10.1136/bjo.2006.091314. [DOI] [PMC free article] [PubMed] [Google Scholar]
- 25.Shin T, Yoshimura K, Crafton EB, Tsuchiya H, Housseau F, Koseki H, Schulick RD, Chen L, Pardoll DM. In vivo costimulatory role of B7-DC in tuning T helper cell 1 and cytotoxic T lymphocyte responses. J Exp Med. 2005;201:1531–1541. doi: 10.1084/jem.20050072. [DOI] [PMC free article] [PubMed] [Google Scholar]
- 26.Reymond N, Fabre S, Lecocq E, Adelaide J, Dubreuil P, Lopez M. Nectin4/PRR4, a new afadin-associated member of the nectin family that trans-interacts with nectin1/PRR1 through V domain interaction. J Biol Chem. 2001;276:43205–43215. doi: 10.1074/jbc.M103810200. [DOI] [PubMed] [Google Scholar]
- 27.Pages F, Ragueneau M, Rottapel R, Truneh A, Nunes J, Imbert J, Olive D. Binding of phosphatidylinositol-3-OH kinase to CD28 is required for T-cell signalling. Nature. 1994;369:327–329. doi: 10.1038/369327a0. [DOI] [PubMed] [Google Scholar]
- 28.Charbonnier A, Gaugler B, Sainty D, Lafage-Pochitaloff M, Olive D. Human acute myeloblastic leukemia cells differentiate in vitro into mature dendritic cells and induce the differentiation of cytotoxic T cells against autologous leukemias. Eur J Immunol. 1999;29:2567–2578. doi: 10.1002/(SICI)1521-4141(199908)29:08<2567::AID-IMMU2567>3.0.CO;2-S. [DOI] [PubMed] [Google Scholar]