Abstract
Deep sequencing of the 16S rRNA gene provides a comprehensive view of bacterial communities in a particular environment and has expanded our ability to study the impact of the microflora on human health and disease. Current analysis methods rely on comparisons of the sequences generated with an expanding but limited set of annotated 16S rRNA sequences or phylogenic clustering of sequences based on arbitrary similarity cutoffs. We describe a novel approach to characterize bacterial composition using deep sequencing of 16S rRNA gene. Our method defines operational taxonomic units based on phylogenetic tree reconstruction and dynamic clustering of sequences using solely sequencing data. These OTUs can be used to identify differences in bacteria abundance between environments. This approach can perform better than previous phylogenetic methods and will significantly improve our understanding of the microfloral role on human diseases by providing a comprehensive analysis of the microbial composition from various bacterial communities.
Keywords: microflora, massively parallel sequencing, 16s ribosomal RNA
Background
Recent advances in high-throughput DNA sequencing provide an unprecedented opportunity to characterize the composition of bacterial populations in environmental samples. In particular, recent efforts have focused on bacterial communities that surround and abound within the human body (i.e. the human “microbiome”) and have been shown to influence human health and disease [1–5]. In contrast with classical microbiology techniques that rely on culture and are therefore difficult to apply to anaerobic environments (such as the human gut), molecular approaches can provide a comprehensive and quantitative description of all bacteria present in a given environment. A common method for studying the diversity of the microflora is through sequencing of the 16S ribosomal RNA gene (16S rRNA). This gene is required in all prokaryotic cells and its DNA sequence has highly variable regions flanked by conserved regions which allows for i) amplification using universal primers and ii) phylogenetic analysis and taxonomic identification [6, 7]. This locus also represents a choice target for taxonomic studies since it has been comprehensively studied and extensive records of annotated 16S sequences from all main taxonomic subdivisions are kept in curated databases.
Studies of 16S rRNA gene DNA sequences typically rely on two separate data analysis approaches. Phylogenetic approaches, such as UniFrac [8, 9], have been developed to infer global differences in bacterial composition between environments (or samples): a phylogenetic tree including all sequences generated is reconstructed and used to calculate the total length of the branches leading to sequences unique to one of the environments. This method generates distances between environments and is powerful for detecting overall microflora composition differences or similarities among environments or samples [10–13]. However, since this methodology relies on global difference in bacterial composition, it is often difficult to identify the particular taxa responsible for these differences.
To overcome this limitation, researchers usually conduct a taxonomic analysis (independently of the phylogenetic analysis) to estimate which bacterial communities are most different among samples/environments. A taxonomic analysis generally entails comparing individual DNA sequences generated by high-throughput sequencing to a database of annotated 16S rRNA DNA sequences and assigning each sequence to a particular taxon based on DNA sequence similarity. The microflora composition obtained from this type of analysis can then be used to determine whether one particular taxon is more abundant in one sample than another. While this taxonomic approach has been successfully applied to various studies [10–13], it suffers from two important limitations. First, the appropriate taxonomic level (i.e. species, genus, family, class or phylum) used to determine the bacterial composition is not obvious: depending on the biological question investigated, relevant differences in bacterial composition may occur at the phylum level or at a much more subtle level. Second, the characterization of the microflora composition depends on the DNA sequences present in the database: while this approach might work very efficiently for well-characterized environmental samples, it will perform poorly if closely related bacteria have not been sequenced. An alternative approach is to group sequences into “Operational Taxonomic Units” (OTUs) based on a reconstructed phylogenetic tree. For example, the Unifrac package allows defining OTUs by cutting the phylogenetic tree at a specified distance from the root and analyzing each lineage that exists at this distance. While this approach alleviates the requirement for reference 16S RNA sequences, it suffers from the use of an arbitrary and unique cutoff to define OTUs which does not take into account variation in sequence divergence among taxa.
Here we describe a novel method of analyzing deep sequencing 16S rRNA data that overcomes the limitations of traditional phylogenetic and taxonomic approaches. We developed an analysis method that relies solely on the DNA sequences generated to i) reconstruct a phylogenetic tree and ii) apply a dynamic tree cutting algorithm to group closely related sequences into OTUs while accounting for the tremendous variation in branch lengths along the tree. We apply this method to several deep sequencing 16S rRNA datasets generated by others and us and show that our novel method is advantageous over previous methods and provides a better resolution of the communities differing among environmental samples.
Materials and methods
Data collection and high-throughput sequencing
We analyzed four independent datasets for this study (Table 1). The RDP dataset consists of annotated 16S rRNA sequences downloaded from the Ribosomal Database Project [14, 15]. We restricted our analysis to high quality sequences that cover the amplified DNA sequence used in our studies (see below) and have complete taxonomic information. A total of 99,097 sequences from 27 phyla were included in our analysis. The TLR5 knock-out dataset (kindly provided by Dr. Ruth Ley) was generated from stools from the ceca of mice deficient in Toll-like receptor 5 [11]. The sequences were generated using the same primers as in our datasets (see below). The human data set was generated in our lab from intestinal mucosal samples of colorectal cancer patients.
Table 1.
Datasets analyzed in this study
| Dataset | No. Samples | Reads w/Barcode and Primers | Unique Sequences | No. OTUs |
|---|---|---|---|---|
| RDP | na | 30582 | 52.9% | 71 |
|
| ||||
| Human | 26 | 186552 | 58.9% | 55 |
| Colorectal | ||||
|
| ||||
| TLR5 Mice | 10 | 23139* | 56.4% | 34 |
|
| ||||
| Apc/Sigirr | 16 | 128526 | 40.2% | 63 |
| Mice | ||||
The TLR5 data set had shorter reads and therefore only one of the primers was identified.
Mucosal samples were rinsed with water before processing to remove bacteria present in the lumen but not specifically adhering to the intestinal wall. DNA extraction, amplification and sequencing was performed as described below. The Apc/Sigirr data set was generated from stool samples of C57BL/6 mice that were Apc+/+/Sigirr+/+, Apcmin/+/Sigirr+/+, Apc+/+/Sigirr−/−, or Apcmin/+/Sigirr−/− [16]. Stool samples were flash frozen before processing. Enzymatic lysis buffer (18 mg/ml lysozyme, 45 U/ml lysostaphin diluted in 1X TE Buffer with 0.01% Triton X) was added to each sample and vortexed briefly before incubation at 37°C for one hour. DNA was extracted using Qiaquick column purification. The 16S rRNA gene was amplified by PCR using primers that incorporated the 8F (AGAGTTTGATCCTGGCTCAG) and 338R (CATGCTGCCTCCCGTAGGAGT) universal primers. These primers amplify the V1 and V2 regions of the 16S ribosomal RNA gene. It is possible that some bacterial sequences will be better amplified than others (e.g., due to uncharacterized sequence differences in the “universal” primer sites). However, these PCR biases will not affect our findings as they affect all samples similarly (e.g., the same taxon will be poorly amplified in all samples). Additionally, the amplification primers include i) a sample-specific 8-nucleotide barcode which allows for pooling of multiple samples for sequencing and ii) Roche 454 sequencing primers. The 8-mer barcodes were designed to take into consideration errors in sequencing and were selected such that each barcode differs from all other barcodes used by at least two nucleotides [17]. After PCR amplification, the PCR products were purified using Qiaquick columns and pooled at equivalent concentrations. Sequencing of the amplicons was performed using a Roche 454 Titanium Genome Sequencer [18]. This platform is well suited for this study because of the longer reads compared to other next-generation sequencing platforms. The amplified regions are approximately 300 base pairs (after removing the primers), which is well within the read length limits of this technology. All sequences are available from the Sequence Read Archive, accession number SRR136595.1.
Data analysis
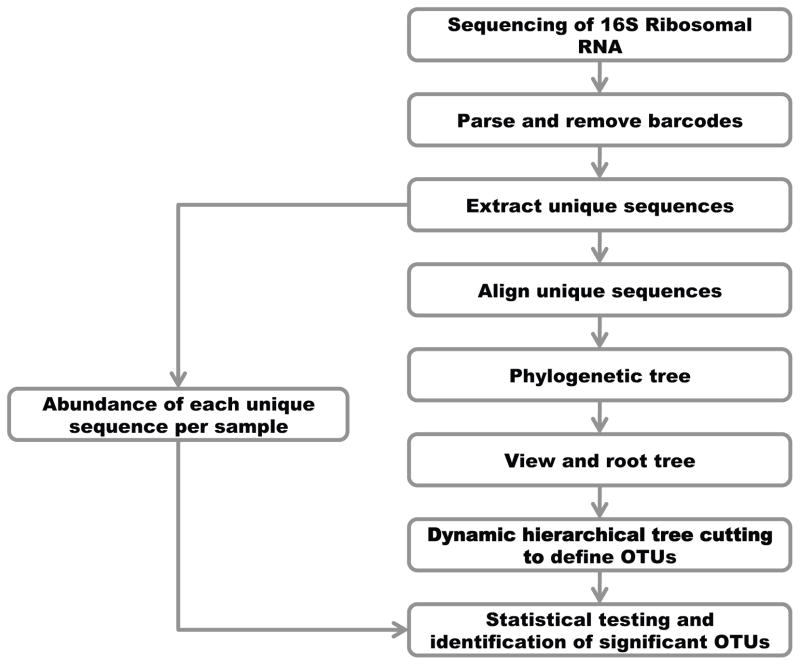
We analyzed each of the 4 datasets separately according to the pipeline described in Figure 1. We assigned sequencing reads to the appropriate sample based on the barcode sequences using scripts developed in our lab. Sequencing reads were kept only if the entire barcode and the forward and reverse universal primer sequences could be identified (Table 1). To speed up the computational analysis and decrease the memory burden, we removed all non-unique sequences (regardless of whether identical sequences originated from the same sample or not). The abundance or number of occurrences of each unique sequence was recorded for each sample using in-house scripts. All unique sequences were aligned to each other using the INFERNAL algorithm [19], an alignment program catered for RNAs that uses sequence information and secondary structure conservation information to generate a multiple sequence alignment. The aligned sequences were then used to reconstruct a phylogenetic tree using FastTreeMP [20]. FastTreeMP reduces the computational footprint by storing sequence profiles of internal nodes instead of a full distance matrix. Neighbor-joining and heuristics were then applied to generate the phylogenetic tree. We then used the branching patterns (i.e. topology and branch lengths) of the resulting phylogenetic tree to group closely related DNA sequences into operational taxonomic units (OTUs). We applied a dynamic tree cutting method originally developed for the analysis of gene expression data [21] but applicable to any hierarchically structured dataset. This algorithm assigns terminal branches into OTUs based on a dynamic assessment of the shape and height of the dendrogram. The algorithm assigns branches into OTUs following four criteria 1) a minimum number of terminal branches or members in the cluster (determined by the user) 2) a maximum distance between two clusters even in the same branch 3) clusters must be separated by a gap as defined by the distance between the lowest members of the cluster and the cut and 4) the lowest merged objects in the group must be tightly connected. Therefore, the only input required for the OTU definition is the minimum number of members required to define an OTU. To avoid inclusion of small taxa containing too few sequences, we requested that each OTU contains at least 0.01% of the total number of sequences generated for the experiment and can be adjusted in each experiment according to the depth of sequencing coverage. A decrease in the minimum number of members required in an OTU would increase the number of OTUs and increase the taxonomic resolution (by subdividing groups into smaller OTUs). However, the increased resolution is accompanied with a decrease in statistical power as 1) the multiple testing correction burden increases and 2) the number of observations in each OTU decreases. We calculated the numbers of reads from each sample assigned to each OTU (including all non unique reads). We then used these results to test for differences in microflora composition between sample groups (e.g. samples from wild-type vs. knock-out mice). We used a Student’s t-test to test each OTU for differences between groups using the proportions of reads from a given sample assigned to this particular OTU (i.e. the number of reads from sample X assigned in a given OTU divided by the total number of reads for sample X). We adjusted the significance cutoff for multiple testing using Bonferroni correction. We decided to use a Student’s t-test for our analyses since it provided the most conservative results but note that with larger number of samples in each group, it may be more appropriate to use non-parametric testing or likelihood ratio tests as suggested for RNA-Seq data [22].
Figure 1.
Overview of the analysis pipeline.
In parallel and independently of this phylogenetic analysis, we determined the taxonomic assignment of each sequencing read using the RDP Naïve Bayesian Classifier [23]. This algorithm splits each query sequence into 8-mers and compares them to ~880 genera in the 16S ribosomal RNA database to determine its most likely taxonomic assignment hierarchically (and generates confidence estimates by bootstraps).
Results
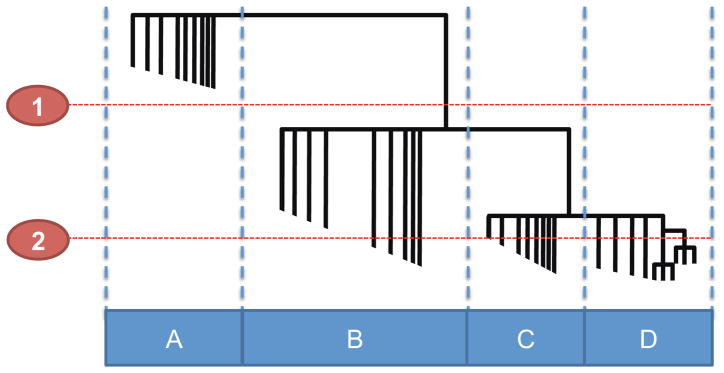
In contrast to other phylogenetic methods, such as UniFrac, that focuses on global differences in bacterial composition [8, 9], our method identifies groups of closely related bacteria that can then be tested for differences in abundance among samples. An overview of our phylogenetic approach is summarized in Figure 1. Briefly, a phylogenetic tree is generated from the alignment of all unique 16S rRNA gene sequences. The OTUs are then defined by cutting the branches of the phylogenetic tree dynamically by assessing the shape and height of each branch and comparing it to the neighboring branches (see Material and Methods for details). We hypothesized that, given the large variation in mutation rates and divergence times existing among prokaryotes, dynamic clustering would be more suitable for grouping bacterial sequences than using an arbitrary similarity cutoff (e.g. 97% sequence identity using USEARCH [24]) or cutting the tree at a specific distance from the root (as it is implemented in the UniFrac lineage specific analysis, see Figure 2). Once the sequences have been grouped into OTUs, one can then test whether each OTU is more abundant in some samples than others.
Figure 2. Dynamic tree cutting versus fixed height cutoff.
Dotted lines 1 and 2 represent arbitrary fixed cutoffs commonly implemented in phylogenetic analysis, which can result in a few large groups (1) or many small groups (2). Boxes A–D represents groups of bacteria defined by the dynamic tree cut algorithm based on the shape and height of the tree branches.
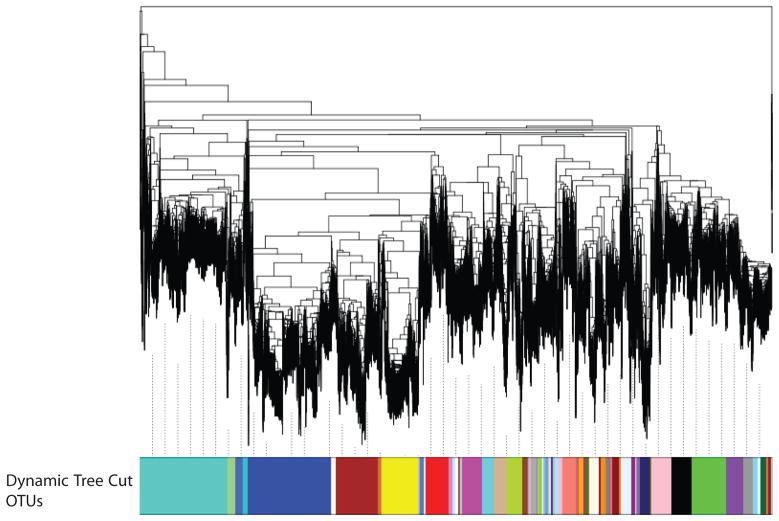
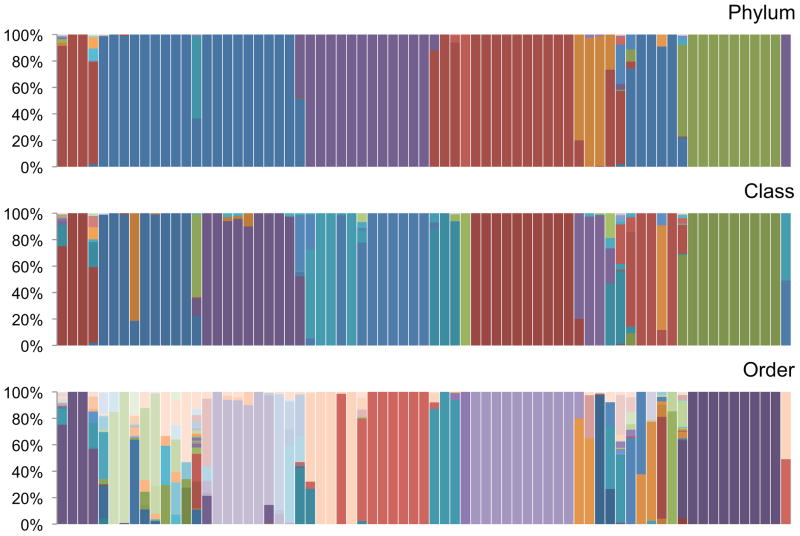
Our first objective was to assess whether our method could provide biologically relevant sets of OTUs. To test this, we analyzed 30,582 16S rRNA gene sequences from the Ribosomal Database Project [14, 15] for which we have annotated GenBank taxonomies. These sequences represent 27 phyla. After alignment of all sequences and tree reconstruction (Figure 3), we used dynamic tree cutting to group closely related branches into OTUs. This procedure clustered the 30,582 sequences into 71 OTUs. To assess the relevance of these clusters we compared the annotated taxonomy of sequences assigned to the same OTU. On average, 95.9% of the sequences within a defined OTU belong to the same phylum, 92.7% of the sequences fall within the same class and 83.3% the same order (Figure 4). By comparison, when we used the RDP classifier on the same set of sequences, 97.2% of the sequences are clustered in the correct phylum, 96.1% in the correct class and 94.1% in the correct order. (Note that some of these sequences are the reference sequences used by RDP to determine taxonomy). These results show that our method efficiently groups 16S rRNA gene sequences into categories consistent with their taxonomic annotations but without relying on a reference sequences (and will therefore perform equally well on well-characterized or unknown sequences that sometimes constitute a large proportion of all 16S RNA sequences, see above).
Figure 3. Assessment of the phylogenetic clustering approach using reference 16S ribosomal RNA gene sequences.
A phylogenetic tree of 30,582 16S ribosomal RNA genes sequences from the Ribosomal Database Project (each branch of the tree represents a unique sequence). Below the tree are OTUs defined using the dynamic tree cutting method. Sequences assigned to the same OTU are represented in the same color.
Figure 4. Annotated taxonomic assignments within OTUs.
Each panel shows the GenBank annotations of the sequences within an OTU (represented by columns in the same order as in Figure 3) at the Phylum, Class, and Order level (each color represents a different taxonomic assignment). Note that each OTU is represented largely by one taxon, illustrating the validity of the approach (see the main text for details).
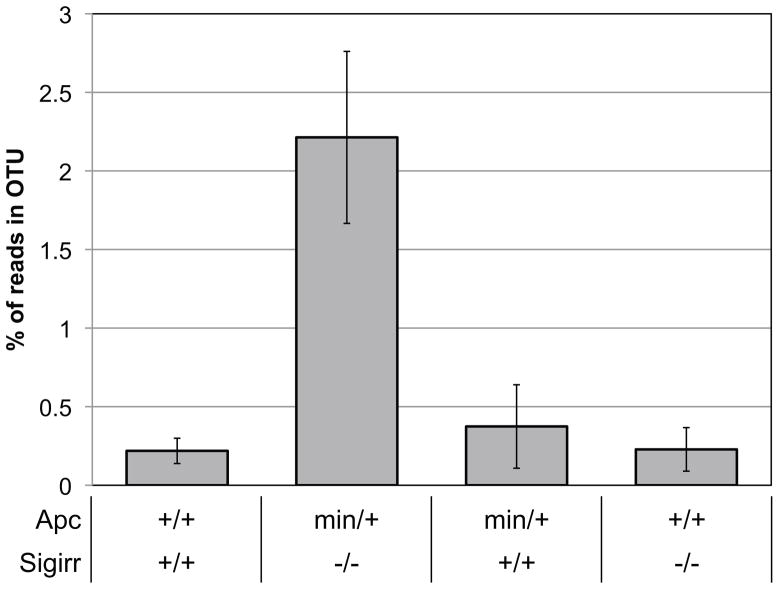
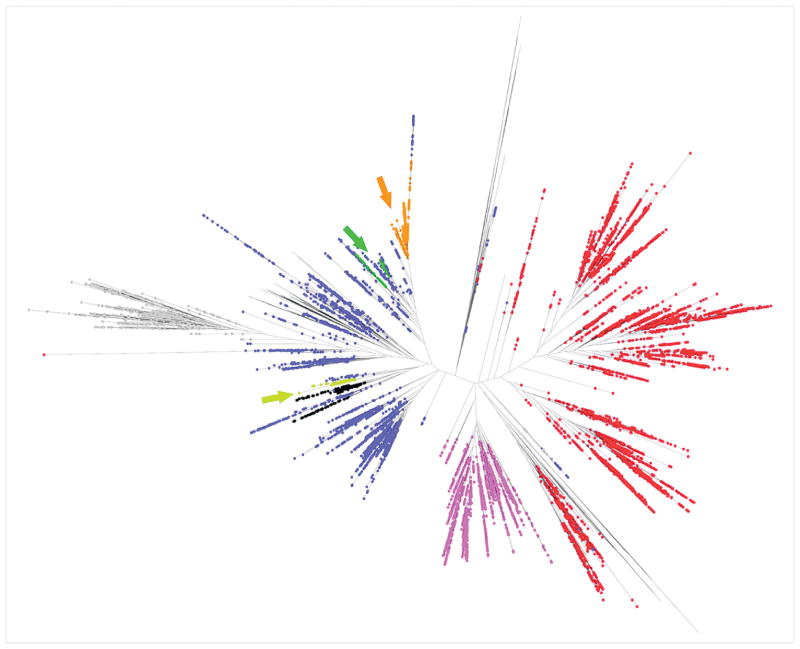
We then applied our methodology to a 16S rRNA sequence dataset generated from mouse stools for which a large proportion of the sequences could not be robustly assigned to even a phylum using the RDP classifier (see Discussion and Supplemental Figure 1). We analyzed 16 samples from mice with different genotype combinations of the Sigirr (a negative regulator of Toll-like receptor signaling [25]) and Apc genes and generated 128,526 16S rRNA sequences. In this dataset, our phylogenetic approach clustered the 128,526 sequences into 63 OTUs comprising between 49 and 36,493 sequences (mean = 2,040). We then tested each of the OTUs to determine whether its abundance significantly differed according to the mouse genotype. We identified one OTU that remained significantly different between Apcmin/+/Sigirr−/− and all other mouse genotypes after Bonferroni correction for multiple testing (Fisher’s exact test, two-tail, p ≤ 0.02). Apcmin/+/Sigirr−/− mice showed a significantly higher proportion of reads in OTU 38 compared to wild type mice and either of the mutations alone (Figure 5). 386 of the 396 unique sequences that are contained in this OTU could not be confidently assigned to even a specific phylum using the RDP classifier (the remaining 10 sequences were assigned to the Firmicutes phylum). Due to the lack of closely related sequences in the 16S sequence database, most of these sequences would thus have been placed into an “unknown” bin by comparison-based methods and this pattern would have been missed. Alternatively, classifying all these sequences with all other Firmicutes sequences would have diluted the difference (p ≥ 0.09 before Bonferroni correction). This example illustrates some of the advantages of our approach: it allows analyzing sequences distant from any annotated sequences and alleviates the need to specify which taxonomic level to test. A phylogenetic tree reconstruction including representative annotated sequences shows that the sequences (Figure 6, yellow dots) form a distinct branch related to the Firmicutes and Tenericutes phyla. In addition, our analysis of the Apc/Sigirr mouse dataset identified two distinct OTUs for which more than 95% of the sequences are classified as Lactobacillus using the RDP classifier. We were interested in determining whether the two clusters represent more subtle taxonomic differences, perhaps capturing species or subspecies differences. Overlaying the sequences from these two OTUs on a phylogenetic tree with sequences with known classifications corroborates their differences (Figure 6, green and orange dots). Our assignment of these sequences in two OTUs may illustrate differences at the sub-genus level (or misclassifications by the RDP classifier). Whether or not these differences are biologically relevant remains to be determined, but this example demonstrates the high level of specificity of our approach that is sometimes capable of distinguishing bacteria at a subtle taxonomic level.
Figure 5. Proportion of the sequences assigned to OTU38 according to the mouse Apc/Sigrr genotypes.
(N=4 per genotype group).
Figure 6. Phylogenetic tree showing the relationships among sequences from three OTUs identified in the Apc/Sigrr mouse dataset with regards to annotated RDP 16S sequences.
Different colors indicate different phyla: Firmicutes are shown in blue dots, Proteobacteria in red, Actinobacteria in pink, Bacteroidetes in grey and Tenericutes in black. Mouse sequences assigned to OTU 38, 20 and 7 are represented in yellow, green and orange respectively.
For comparison, we applied to the same dataset a traditional clustering method to define OTUs using a fixed identity percentage cut-off of 97% using the UCLUST algorithm [24]. This clustering algorithm assigns sequences to clusters based on a user-defined identity threshold to seeds generated as the query is processed. New seeds are defined by sequences that do not match a previously defined seed. This method is comparable to CD-HIT [26] and is implemented in the QIIME package for 16S rRNA studies [27]. This analysis, using a 97% cut-off typically considered to represent sequences sharing the same genus, grouped the 128,526 sequences into 5,183 OTUs (mean=25 sequences) compared to only 63 OTUs (mean=2,040 sequences) in our analyses (see above). Such a partitioning of the 16S RNA sequences into numerous groups each containing a small number of sequences dramatically reduces the power to identify statistical differences among samples (by decreasing the sample size for each test and increasing the multiple-testing correction burden). In our dataset, no difference in composition between genotype groups remained significant after multiple-testing correction using this approach.
We finally applied our phylogenetic analysis to a published dataset from Vijay-Kumar et al. [11]. In their study, Vijay-Kumar and colleagues compared the bacterium collected from the cecum of TLR5−/− mice with samples from wild-type mice to test whether knocking out the TLR5 gene resulted in a change in the gut microflora. They observed a significant change in the overall species composition using UniFrac analyses [9, 11]. Additionally, they assigned sequences to phylotype groups (i.e. OTUs) based on a 97% pair-wise identity to sequences within the pool using megablast and determined the taxonomic status of each phylotype using the best megablast hit to sequences in the Greengenes database [28]. They identified several phylotypes that were significantly depleted or enriched in the TLR5 knock-out mice. These phylotypes varied in their taxonomic assignment, ranging from phyla to genus. Examinations of the phylogenetic tree including the various phylotypes suggested to us a clustering of many of the significant phylotypes. This likely represents a unique biological group that could not be easily defined by sequence identity cutoffs. We used phylogenetic reconstruction and dynamic tree cutting to cluster 23,139 sequences into 34 OTUs. Our analysis identified two OTUs that were significantly different between TLR5 knock-out mice and wild-type mice (Student’s t-test, p≤0.01 after Bonferroni correction for multiple testing). The two OTUs contain reads that match predominantly with the phylum Bacteroidetes (one of the two OTUs contains specifically a large proportion of sequences assigned to the bacteroidales order, Supplemental Figure 2). Interestingly, analyses conducted using the RDP classifier at the phylum or order level failed to identify these differences (respectively, p>0.68 and p>0.07 before correction for multiple testing). This difference can be explained by i) the number of unknown sequences that are not included in the RDP analysis and ii) inclusion of numerous additional sequences into larger groups (respectively Bacteroidetes and bacteroidales) that swamp the more subtle difference. Both the method used in the original study and our novel method identified a depletion of Bacteroidetes in the TLR5 knock-out mice which demonstrates the validity of our approach. However, we believe that our method provides a much greater power to detect taxa that are present in different frequencies among samples: the approach used by Vijay-Kumar et al. identified of a large numbers of phylotypes each represented by a few sequences, while our phylogenetic approach yielded fewer OTUs (leading to a smaller multiple-testing correction burden) comprising many more sequences (increasing the power to detect differences among samples).
Discussion
Current sequencing techniques have paved the way for the comprehensive analysis of the microflora. However, the methods used to analyze these large datasets need to be further improved to advance our understanding of the link between the microbiome and human health. A popular method for assigning reads generated by deep sequencing of 16S rRNA gene to taxa is by comparing them to an annotated database (e.g. using Megablast or RDP classifier). We applied the RDP Naïve Bayesian Classifier [23] to two microbiome studies conducted in our laboratory (see Materials and Methods) and found that the performance of the RDP classifier is highly dependent on the dataset. In our analysis of mucosal tissues collected from colorectal cancer patients (Table 1), the RDP classifier assigned over 90% of the reads with more than 90% confidence at the phylum level (Supplemental Figure 1) and approximately 90% of the reads with 90% confidence at the class level (data not shown). In contrast, the same algorithm applied to sequences generated using the same protocol but from mouse stool samples resulted in less than 60% of the sequences classified with more than 90% confidence at the high-order phylum level. Lowering the confidence threshold to 80% allowed approximately 90% of the sequences to be classified, with most of the previously unassigned sequences attributed to Firmicutes. This analysis illustrates that, at least in some instances, the RDP classifier pools in a single group heterogeneous sequences (i.e. those that were classified in Firmicutes using stringent criteria and those that were originally unassigned) which may hamper subsequent analyses. These results also show the limitations of using a method relying on comparisons with annotated sequences since it performs poorly for bacterial species that are not well represented in the database. In this regard, we note that the RDP classifier efficiently assigned most of the sequences generated from human intestinal samples and will likely perform well on more diverse environments as the reference database continues to expand and additional characterized sequences are contributed from multiple environments.
However, to provide an unbiased and reliable methodology for all type of environments, we developed a phylogeny-based approach to assign 16S sequences into OTUs without relying on a priori information. We believe that the analysis pipeline presented here fulfills two important criteria. First, the analysis needs to include all sequences generated. One of the main advantages of deep sequencing over traditional microbiology techniques is its ability to characterize “unculturable” bacteria. If the analytical approach only allows analysis of known bacteria sequences (or sequences closely related to known sequences), most of this advantage is lost. Second, the analysis of 16S deep sequencing data should provide some indications on the communities that differ among samples (and not simply show that, overall, the bacterial composition differs). The analysis pipeline described here fulfills these two aspects by incorporating the advantages of a phylogenetic analysis (i.e. independence of prior knowledge) with the ability to define OTUs and to identify bacteria communities that differ most among samples. Importantly, the OTUs in our method are defined by a dynamic assessment of the phylogenetic tree and do not require a fixed arbitrary branch length cutoff. The labeling of the taxonomic status of each OTU still requires comparisons to reference sequences but the clustering of the sequences into OTUs is performed independently and can therefore allow investigating the role of uncharacterized bacteria. Furthermore, even if the taxonomic status of a particular OTU remains unknown, the findings of microbiome studies conducted using our approach can still be followed-up with primers designed to target DNA sequence motifs unique to this OTU. This feature is particularly appealing for developing clinical tests (using PCR as a screening tool) or to accelerate the taxonomic annotation of OTUs (by screening bacteria cultures). Overall, we believe that the method described here presents key advantages over previous methods and addresses some of the main limitations of current 16S rRNA deep sequencing analysis and will, in combination with developments achieved by the Human Microbiome Project, contribute to better understand the role of the indigenous microflora in regulating human health and disease.
Supplementary Material
sfigure1.eps – Taxonomic assignment using comparison-based method is dependent on the sample study. The figure shows the taxonomic assignment of the 16S sequences generated from mucosa samples collected from colorectal patients (left, N=24) and stool samples from Apc/Sigirr mice (right, N=16). The colors represents the proportion of sequences assigned to different particular taxa by the RDP classifier using a confidence interval (CI) of 80% or 90%.
sfigure2.eps – RDP classifications of sequences in OTUs 7 and 9.
samplebarcodes.doc – Table of samples with corresponding barcode from the human and Apc/Sigirr dataset.
Acknowledgments
We thank Dr. Ruth Ley for providing the TLR5 mice dataset. We thank Alexandre Montpetit and the people at the McGill and Genome Quebec Innovation Center for their help with 454 sequencing. This study was supported in part by federal funds from the National Institutes of Health (1R01DE021554-01) and by Cleveland Clinic Foundation start-up funds to DS.
Footnotes
Authors’ contributions
ERC, JH, and DS designed the study; ERC performed the analysis; HX, XL, and MK provided the samples; ERC and DS wrote the manuscript.
Publisher's Disclaimer: This is a PDF file of an unedited manuscript that has been accepted for publication. As a service to our customers we are providing this early version of the manuscript. The manuscript will undergo copyediting, typesetting, and review of the resulting proof before it is published in its final citable form. Please note that during the production process errors may be discovered which could affect the content, and all legal disclaimers that apply to the journal pertain.
Contributor Information
Ernest R. Chan, Email: chane2@ccf.org.
James Hester, Email: hesterj@ccf.org.
Matthew Kalady, Email: kaladym@ccf.org.
Hui Xiao, Email: xiaoh@ccf.org.
Xiaoxia Li, Email: lix@ccf.org.
References
- 1.Gill SR, Pop M, Deboy RT, Eckburg PB, Turnbaugh PJ, Samuel BS, Gordon JI, Relman DA, Fraser-Liggett CM, Nelson KE. Metagenomic analysis of the human distal gut microbiome. Science (New York, NY) 2006;312:1355–1359. doi: 10.1126/science.1124234. [DOI] [PMC free article] [PubMed] [Google Scholar]
- 2.Kado S, Uchida K, Funabashi H, Iwata S, Nagata Y, Ando M, Onoue M, Matsuoka Y, Ohwaki M, Morotomi M. Intestinal microflora are necessary for development of spontaneous adenocarcinoma of the large intestine in T-cell receptor beta chain and p53 double-knockout mice. Cancer research. 2001;61:2395–2398. [PubMed] [Google Scholar]
- 3.O'Keefe SJ. Nutrition and colonic health: the critical role of the microbiota. Current opinion in gastroenterology. 2008;24:51–58. doi: 10.1097/MOG.0b013e3282f323f3. [DOI] [PubMed] [Google Scholar]
- 4.Pitari GM, Zingman LV, Hodgson DM, Alekseev AE, Kazerounian S, Bienengraeber M, Hajnoczky G, Terzic A, Waldman SA. Bacterial enterotoxins are associated with resistance to colon cancer. Proceedings of the National Academy of Sciences of the United States of America. 2003;100:2695–2699. doi: 10.1073/pnas.0434905100. [DOI] [PMC free article] [PubMed] [Google Scholar]
- 5.Turnbaugh PJ, Ley RE, Mahowald MA, Magrini V, Mardis ER, Gordon JI. An obesity-associated gut microbiome with increased capacity for energy harvest. Nature. 2006;444:1027–1031. doi: 10.1038/nature05414. [DOI] [PubMed] [Google Scholar]
- 6.Fox GE, Magrum LJ, Balch WE, Wolfe RS, Woese CR. Classification of methanogenic bacteria by 16S ribosomal RNA characterization. Proceedings of the National Academy of Sciences of the United States of America. 1977;74:4537–4541. doi: 10.1073/pnas.74.10.4537. [DOI] [PMC free article] [PubMed] [Google Scholar]
- 7.Tringe SG, von Mering C, Kobayashi A, Salamov AA, Chen K, Chang HW, Podar M, Short JM, Mathur EJ, Detter JC, et al. Comparative metagenomics of microbial communities. Science (New York, NY) 2005;308:554–557. doi: 10.1126/science.1107851. [DOI] [PubMed] [Google Scholar]
- 8.Lozupone C, Knight R. UniFrac: a new phylogenetic method for comparing microbial communities. Applied and environmental microbiology. 2005;71:8228–8235. doi: 10.1128/AEM.71.12.8228-8235.2005. [DOI] [PMC free article] [PubMed] [Google Scholar]
- 9.Lozupone C, Hamady M, Knight R. UniFrac--an online tool for comparing microbial community diversity in a phylogenetic context. BMC bioinformatics. 2006;7:371. doi: 10.1186/1471-2105-7-371. [DOI] [PMC free article] [PubMed] [Google Scholar]
- 10.Hong PY, Lee BW, Aw M, Shek LP, Yap GC, Chua KY, Liu WT. Comparative analysis of fecal microbiota in infants with and without eczema. PloS one. 2010;5:e9964. doi: 10.1371/journal.pone.0009964. [DOI] [PMC free article] [PubMed] [Google Scholar]
- 11.Vijay-Kumar M, Aitken JD, Carvalho FA, Cullender TC, Mwangi S, Srinivasan S, Sitaraman SV, Knight R, Ley RE, Gewirtz AT. Metabolic syndrome and altered gut microbiota in mice lacking Toll-like receptor 5. Science (New York, NY) 2010;328:228–231. doi: 10.1126/science.1179721. [DOI] [PMC free article] [PubMed] [Google Scholar]
- 12.Krogius-Kurikka L, Lyra A, Malinen E, Aarnikunnas J, Tuimala J, Paulin L, Makivuokko H, Kajander K, Palva A. Microbial community analysis reveals high level phylogenetic alterations in the overall gastrointestinal microbiota of diarrhoea-predominant irritable bowel syndrome sufferers. BMC gastroenterology. 2009;9:95. doi: 10.1186/1471-230X-9-95. [DOI] [PMC free article] [PubMed] [Google Scholar]
- 13.Claesson MJ, O'Sullivan O, Wang Q, Nikkila J, Marchesi JR, Smidt H, de Vos WM, Ross RP, O'Toole PW. Comparative analysis of pyrosequencing and a phylogenetic microarray for exploring microbial community structures in the human distal intestine. PloS one. 2009;4:e6669. doi: 10.1371/journal.pone.0006669. [DOI] [PMC free article] [PubMed] [Google Scholar]
- 14.Cole JR, Chai B, Farris RJ, Wang Q, Kulam-Syed-Mohideen AS, McGarrell DM, Bandela AM, Cardenas E, Garrity GM, Tiedje JM. The ribosomal database project (RDP-II): introducing myRDP space and quality controlled public data. Nucleic acids research. 2007;35:D169–172. doi: 10.1093/nar/gkl889. [DOI] [PMC free article] [PubMed] [Google Scholar]
- 15.Cole JR, Wang Q, Cardenas E, Fish J, Chai B, Farris RJ, Kulam-Syed-Mohideen AS, McGarrell DM, Marsh T, Garrity GM, Tiedje JM. The Ribosomal Database Project: improved alignments and new tools for rRNA analysis. Nucleic acids research. 2009;37:D141–145. doi: 10.1093/nar/gkn879. [DOI] [PMC free article] [PubMed] [Google Scholar]
- 16.Xiao H, Yin W, Khan MA, Gulen MF, Zhou H, Sham HP, Jacobson K, Vallance BA, Li X. Loss of Single Immunoglobulin Interlukin-1 Receptor-Related Molecule Leads to Enhanced Colonic Polyposis in Apc(min) Mice. Gastroenterology. 2010 doi: 10.1053/j.gastro.2010.04.043. [DOI] [PMC free article] [PubMed] [Google Scholar]
- 17.Hamady M, Walker JJ, Harris JK, Gold NJ, Knight R. Error-correcting barcoded primers for pyrosequencing hundreds of samples in multiplex. Nature methods. 2008;5:235–237. doi: 10.1038/nmeth.1184. [DOI] [PMC free article] [PubMed] [Google Scholar]
- 18.Margulies M, Egholm M, Altman WE, Attiya S, Bader JS, Bemben LA, Berka J, Braverman MS, Chen YJ, Chen Z, et al. Genome sequencing in microfabricated high-density picolitre reactors. Nature. 2005;437:376–380. doi: 10.1038/nature03959. [DOI] [PMC free article] [PubMed] [Google Scholar]
- 19.Nawrocki EP, Kolbe DL, Eddy SR. Infernal 1.0: inference of RNA alignments. Bioinformatics (Oxford, England) 2009;25:1335–1337. doi: 10.1093/bioinformatics/btp157. [DOI] [PMC free article] [PubMed] [Google Scholar]
- 20.Price MN, Dehal PS, Arkin AP. FastTree: computing large minimum evolution trees with profiles instead of a distance matrix. Molecular biology and evolution. 2009;26:1641–1650. doi: 10.1093/molbev/msp077. [DOI] [PMC free article] [PubMed] [Google Scholar]
- 21.Langfelder P, Zhang B, Horvath S. Defining clusters from a hierarchical cluster tree: the Dynamic Tree Cut package for R. Bioinformatics (Oxford, England) 2008;24:719–720. doi: 10.1093/bioinformatics/btm563. [DOI] [PubMed] [Google Scholar]
- 22.Marioni JC, Mason CE, Mane SM, Stephens M, Gilad Y. RNA-seq: an assessment of technical reproducibility and comparison with gene expression arrays. Genome Res. 2008;18:1509–1517. doi: 10.1101/gr.079558.108. [DOI] [PMC free article] [PubMed] [Google Scholar]
- 23.Wang Q, Garrity GM, Tiedje JM, Cole JR. Naive Bayesian classifier for rapid assignment of rRNA sequences into the new bacterial taxonomy. Applied and environmental microbiology. 2007;73:5261–5267. doi: 10.1128/AEM.00062-07. [DOI] [PMC free article] [PubMed] [Google Scholar]
- 24.Edgar RC. Search and clustering orders of magnitude faster than BLAST. Bioinformatics (Oxford, England) 2010;26:2460–2461. doi: 10.1093/bioinformatics/btq461. [DOI] [PubMed] [Google Scholar]
- 25.Wald D, Qin J, Zhao Z, Qian Y, Naramura M, Tian L, Towne J, Sims JE, Stark GR, Li X. SIGIRR, a negative regulator of Toll-like receptor-interleukin 1 receptor signaling. Nat Immunol. 2003;4:920–927. doi: 10.1038/ni968. [DOI] [PubMed] [Google Scholar]
- 26.Li W, Godzik A. Cd-hit: a fast program for clustering and comparing large sets of protein or nucleotide sequences. Bioinformatics (Oxford, England) 2006;22:1658–1659. doi: 10.1093/bioinformatics/btl158. [DOI] [PubMed] [Google Scholar]
- 27.Caporaso JG, Kuczynski J, Stombaugh J, Bittinger K, Bushman FD, Costello EK, Fierer N, Pena AG, Goodrich JK, Gordon JI, et al. QIIME allows analysis of high-throughput community sequencing data. Nature methods. 2010;7:335–336. doi: 10.1038/nmeth.f.303. [DOI] [PMC free article] [PubMed] [Google Scholar]
- 28.DeSantis TZ, Hugenholtz P, Larsen N, Rojas M, Brodie EL, Keller K, Huber T, Dalevi D, Hu P, Andersen GL. Greengenes, a chimera-checked 16S rRNA gene database and workbench compatible with ARB. Applied and environmental microbiology. 2006;72:5069–5072. doi: 10.1128/AEM.03006-05. [DOI] [PMC free article] [PubMed] [Google Scholar]
Associated Data
This section collects any data citations, data availability statements, or supplementary materials included in this article.
Supplementary Materials
sfigure1.eps – Taxonomic assignment using comparison-based method is dependent on the sample study. The figure shows the taxonomic assignment of the 16S sequences generated from mucosa samples collected from colorectal patients (left, N=24) and stool samples from Apc/Sigirr mice (right, N=16). The colors represents the proportion of sequences assigned to different particular taxa by the RDP classifier using a confidence interval (CI) of 80% or 90%.
sfigure2.eps – RDP classifications of sequences in OTUs 7 and 9.
samplebarcodes.doc – Table of samples with corresponding barcode from the human and Apc/Sigirr dataset.


