

Abstract
Background
To assess the role of diffusion weighted imaging (DWI) in predicting progression-free survival in patients with squamous cell carcinomas of head and neck (HNSCC) treated with induction chemotherapy.
Methods
Eighteen patients with HNSCC underwent DWI studies prior to treatment and within 3-weeks after completion of induction chemotherapy. Median apparent diffusion coefficient (ADC) values were computed from the largest cervical metastatic lymph node. Percentage (%) changes in ADC values from pre-treatment to post-treatment time points were compared between alive and dead patients using Mann-Whitney test. Probability (p) value of less-than 0.05 was considered significant.
Results
A 22% increase in ADC was observed after induction chemotherapy in alive patients (n=15), while patients who died from HNSCC (n=3) demonstrated a 33% decrease in ADC. The difference in % change in ADC between alive and dead patients was significant (p=0.039).
Conclusions
ADC may be a useful marker in predicting progression-free survival in HNSCC patients undergoing induction chemotherapy.
Introduction
Neoadjuvant induction chemotherapy in patients with head and neck squamous cell carcinoma (HNSCC) has resulted in a decline in risk of distant metastasis and an upsurge in organ preservation (1, 2). In general, patients responsive to induction chemotherapy also demonstrate positive response to subsequent radiotherapy (3). However, given the economic burden and toxic side effects associated with induction chemotherapy in HNSCC patients (4, 5), imaging biomarkers that can evaluate the treatment and survival outcome in assessing the efficacy of induction chemotherapy are desirable.
Several physiological imaging modalities such as 2-[fluorine 18]- fluoro-2-deoxy-D-glucose (FDG) positron emission tomography (PET) (6, 7), computer tomography perfusion (CTP) imaging (8, 9), proton and phosphorous magnetic resonance spectroscopy (MRS) (10-12), and dynamic contrast enhanced magnetic resonance imaging (DCE-MRI) (13) have been proposed for predicting and monitoring treatment response as well as predicting survival outcome in patients with HNSCC undergoing concurrent chemo-radiation therapy and surgery. However, lower spatial resolution and specificity associated with FDG-PET, technical limitations associated with acquiring MRS and rigorous steps involved in the analysis of CTP and DCE-MRI data limit the use of these modalities in the routine clinical settings. On the contrary, diffusion weighted imaging (DWI), which provides maps of microscopic water motion within biological tissues, offers a more simplistic approach to ascertain physiological changes within the tumor after treatment. Moreover, relative ease of data acquisition and availability of data processing tools for computing the magnitude of microscopic motion on routine clinical scanners make DWI a more suitable choice.
Higher cellularity is generally associated with more restricted diffusion (lower apparent diffusion coefficient (ADC) values) (14, 15). It has also been reported that cytotoxic therapy of tumors triggers cell death leading to reduced cell density with a subsequent increase in ADC after treatment (16-19). Several promising preclinical (20) and clinical studies (21-24) have successfully demonstrated the utility of DWI in detection and characterization of head and neck cancers. Previous DWI studies in HNSCC have also suggested that ADC can be used as a sensitive marker for differentiation of tumor recurrence from necrosis (25, 26), prediction of short-term local response (27-29) and prediction of long-term survival (30) in HNSCC patients treated with concurrent chemo-radiation therapy. HNSCC patients with lower pretreatment ADC and an increase in ADC following concurrent chemo-radiation therapy demonstrate better local response and survival than patients who have higher pretreatment ADC and no change in ADC following treatment (27, 29, 30). However, usefulness of ADC in assessing treatment response and survival in HNSCC patients undergoing induction chemotherapy has not been reported.
The present study was therefore designed to evaluate the potential of DWI in monitoring the local treatment response of the metastatic cervical lymph node in patients with HNSCC undergoing induction chemotherapy and in predicting progression free survival.
Materials and Methods
Patient population and treatment
This retrospective study was approved by the Institutional Review Board and written informed consent was obtained from each patient enrolled in the study. Patients were included in the study if (a) they had prior computer tomography (CT)/magnetic resonance imaging (MRI) and biopsy confirming the presence of HNSCC, (b) who underwent induction chemotherapy. Patients were excluded from the study if (a) they had received any prior chemotherapy or radiation therapy, (b) if they had any prior history of cancer other than HNSCC, and (c) patients with major medical disorder such as poorly controlled diabetes mellitus, or hypertension. Based on physical examinations and CT/MRI reports, all patients were assessed for the presence of metastatic cervical lymph nodes by a trained neuro-radiologist and a radiation oncologist. In accordance with our inclusion criteria, the study comprised of 18 patients (16 males and 2 females, age 56.9±8.3 years). The primary tumor locations at initial presentation were oropharynx (72.3%), nasopharynx (22.22%) and hypopharynx (5.55%). Tumor staging from these patients is summarized in Table 1.
Table 1.
Characteristics of the patients
| ID | Induction Chemotherapy Protocol | Age | Gender | T | N | M | Dead vs Alive |
|---|---|---|---|---|---|---|---|
| 1 | CDDP+TXT+5FU | 64 | M | Tx | N3 | M0 | Died of Disease |
| 2 | CDDP+TXT+5FU | 55 | F | T3 | N2c | M0 | Died of Disease |
| 3 | CDDP+TXT+5FU | 48 | F | T4 | N2b | M0 | Died of Disease |
| 4 | CDDP+TXT+5FU | 51 | M | Tx | N2b | M0 | Alive |
| 5 | CDBCA+TAX | 54 | M | T3 | N2b | M0 | Alive |
| 6 | CDBCA+TAX | 63 | M | T2 | N2b | M0 | Alive |
| 7 | CDBCA+TAX+5FU | 72 | M | T4 | N2c | M0 | Alive |
| 8 | CDDP+TXT+5FU | 67 | M | T0 | N2b | M0 | Alive |
| 9 | CDDP+TXT+5FU | 57 | M | T4 | N2c | M0 | Alive |
| 10 | CDDP+TXT+5FU | 52 | M | T3 | N2c | M0 | Alive |
| 11 | CDDP+TXT+5FU | 49 | M | T2 | N2c | M0 | Alive |
| 12 | CDDP+TXT+5FU | 54 | M | T4 | N2c | M0 | Alive |
| 13 | CDDP+TXT+5FU | 47 | M | T4 | N2b | M0 | Alive |
| 14 | CDDP+TXT+ Cetuximab | 71 | M | T2 | N2a | M0 | Alive |
| 15 | CDDP+TXT+ Cetuximab | 45 | M | T2 | N2b | M0 | Alive |
| 16 | CDDP+TXT+ Cetuximab | 62 | M | T3 | N2b | M0 | Alive |
| 17 | CDDP+TXT+ Cetuximab | 51 | M | T2 | N2b | M0 | Alive |
| 18 | CDDP+TXT+ Cetuximab | 62 | M | T2 | N2c | M0 | Alive |
CDDP, Cisplatin; TXT, Docetaxel; CDBCA, Carboplatin; TAX, Paclitaxel; M, Male; F, Female
All patients received platinum based neoadjuvant induction chemotherapy with either one of these regimens: Carboplatin + 5-fluorouracil (5-FU, n=1), Carboplatin + Paclitaxel +/- Cetuximab (n=7), Cisplatin/Carboplatin + Docetaxel + 5-FU (n=10, Table 1). Subsequent treatment regimen included concurrent chemo-radiation therapy in all patients. These patients were irradiated with a total dose of 7,040 cGy in 32 fractions at a daily dose of 220cGy per fraction for over a total of 44 days to the areas of gross disease. Concurrent chemotherapy comprised of cisplatin (100mg/m2) or immuno-therapy with 400 mg/m2 cetuximab 3-7 days before radiation therapy followed by weekly 250 mg/m2 cetuximab on days 1, 8, 15, 22, 29, 36, and 43 of the radiation treatment. Additional therapeutic strategies included surgery, chemotherapy and palliative radiotherapy in non-responder/relapsing patients after the end of sequential neoadjuvant induction chemotherapy and chemo-radiation therapy.
Data acquisition
All patients underwent two MRI studies, first study was prior to any treatment and second study was performed within 3 weeks after completion of induction chemotherapy. The MRI study was performed using a 1.5 T Siemens Sonata scanner (n = 4) or a 3 T Siemens Trio scanner (n = 14; Siemens Medical Systems). However, once recruited, each patient underwent MRI on the same scanner at both time points to avoid any magnetic field related differences. The diagnostic and structural imaging protocol on both MRI systems included three plane scout localizer, axial T2-weighted images [Repetition time (TR)/echo time (TE)=4000/131ms], field of view (FOV)=260×260mm2, matrix size=384×512, slice thickness=5 mm, flip angle (FA)=120°, bandwidth (BW)=130Hz/pixel, number of excitations (NEX)=1, acquisition time (TA)=3:22 minutes; axial T1-weighted images (TR/TE= 600/10ms), FOV=260×260 mm2, matrix size=384×512, slice thickness=5 mm, FA=90°, BW=130 Hz/pixel, NEX=1, TA=1:59 minutes. Post contrast axial T1 weighted images were acquired after injecting a single dose of Gd-DTPA (Omniscan; Nycomed) at a concentration of 0.1 mmol/L/kg body weight in all patients. In order to measure the T2 relaxation times, a series of T2 weighted images using a spin-echo imaging sequence were acquired with four different echo times; 13, 53, 80, and 110 ms (TR = 2 s, number of slices=8). All other parameters were similar to T2 weighted imaging.
Prior to contrast injection, axial diffusion weighted images were acquired using a pulsed gradient spin-echo/echo planar imaging sequence (TR/TE = 4000 ms/89 ms) with three b values: 0, 500, and 1,000 s/mm2. Other parameters included: BW=1500 Hz/pixel, FOV=26×26mm2, matrix size=128×128, slice thickness=5 mm, interslice gap=0 mm, number of slices=8, NEX=4, TA=1:58 minutes. The diffusion sensitive gradients were simultaneously applied in three orthogonal directions to obtain average ADC maps.
Image Processing
Quantitative maps of T2 relaxation times were computed on a pixel by- pixel basis by fitting the signal intensity (SI) and TE to a single exponential function using the following equation:
Similarly, pixel by- pixel ADC maps were computed by modeling the mono-exponential decay of SI to DWI data using the equation: SIi =SI0 * exp (bi*ADC), where SIi is the signal intensity of the diffusion weighted image at bi.
All images (T2, T1, post contrast T1 weighted images and DWI derived ADC maps and T2 maps) were co-registered using a two-step non-rigid image registration technique prior to data analysis based on the algorithms described previously (27). Regions of interest (ROI) were drawn on the solid appearing portion of the nodal mass avoiding necrotic/cystic, hemorrhagic parts as well as surrounding blood vessels on all imaging sections encompassing the metastatic node by a trained neuro-radiologist using T2-weighted, T1-weighted or post-contrast T1-weighted images. These ROIs were used to measure median values of volume, T2, and ADC from the nodal mass at each time point. The volume of the metastatic node was calculated by using the equation: (Σ number of pixels encompassing a ROI from each slice)* (slice thickness).
Clinical follow-up and data analysis
Patients were retrospectively categorized into two groups; complete responders and partial responders based on three commonly used clinical endpoints for assessment of treatment response: (a) patients with ≥ 50% reduction in nodal volume (measured by MRI) after induction chemotherapy were classified as responders and patients with <50% reduction in nodal volume were classified as partial responders. (b) Patients who presented with radiological or clinical evidence of complete response, underwent neck dissection surgery after chemo-radiation therapy and had no evidence for the presence of viable carcinoma cells on histology were termed as complete responders. While partial responders were the ones who had surgical dissection and had positive pathological finding for viable tumor. (c) Clinical/radiological assessment of response at the last follow up before data analysis for this manuscript (December 30, 2010).
For progression free survival analysis, clinical assessment by physicians, laboratory, radiological or nuclear medicine reports were evaluated to find the date of last contact and clinical records were studied to ascertain the cause of death. The follow-up period was measured from the date of first biopsy before the first MRI till the date of death, in case of dead patients, and the time of last contact or date of last observation (30 December, 2010) in case of alive patients. The amount of time elapsed since the diagnosis to the last follow up was noted as the survival time. Changes in nodal volume, T2 and ADC values from pretreatment (pre-tx) to post-induction chemotherapy (post-tx) time points were measured by normalizing each variable to the corresponding pre-tx value for each individual patient using the formula: Percentage change in parameter = [(post-tx value of parameter - pre-tx value of parameter) / pre-tx value of parameter] * 100
Differences in percent change in nodal volume, T2 and ADC values between patient groups (responders and non-responders) and (alive and dead) were assessed using Mann-Whitney U tests. A probability (p) value of less than 0.05 was considered significant. All data analysis was performed using a statistical tool (SPSS for Windows, version 18.0; SPSS Inc., Chicago, III).
Results
Representative images (T2 weighted, post contrast T1 weighted and ADC maps) from a HNSCC patient demonstrating reduction in nodal volume and increase in ADC from pre-treatment to post-induction chemotherapy time points is shown in Fig. 1.
Figure 1.
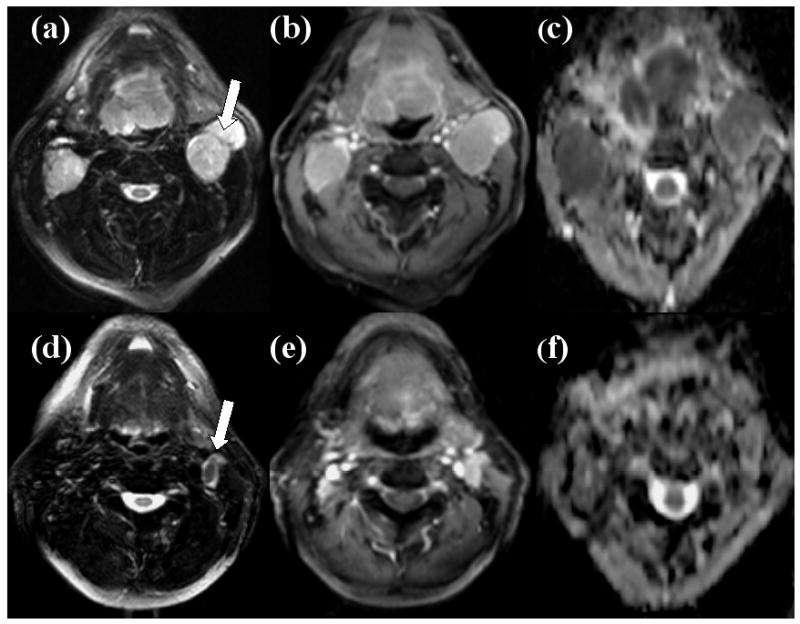
Representative images of a patient who presented ≥50% nodal volume reduction after the end of induction chemotherapy and showed positive response at 6 months follow-up period as well as at the at last date of clinical follow-up. Axial T2 weighted image (a) demonstrating a hyper-intense metastatic cervical lymph node at level IIa of left neck which was studied (arrow). This mass exhibits heterogeneous contrast enhancement on post contrast T1weighted image (b) and low ADC on corresponding ADC map (c) at pretreatment time point. Axial T2 weighted (d) and post-contrast T1 weighted images (e) demonstrate reduction in the nodal volume (arrow) following induction chemotherapy and ADC map (f) demonstrates an increase in ADC compared to pretreatment time point from this node.
As mentioned in the methods section, local treatment was assessed using three different clinical end points. When a 50% change in nodal volume was used as response marker, eleven of the 18 patients demonstrated a ≥50% reduction in nodal volume after induction chemotherapy, representing complete response, while the remaining 7 patients demonstrated <50% reduction in nodal volume, reflecting partial response. No significant differences in the % change in T2 and ADC values between complete responders and partial responders were observed (p>0.05, Table 2).
Table 2.
Median (minimum and maximum) percent change in parameters between complete responders and partial responders at different clinical end points
| Clinical End Point | Complete Responders | Partial Responders | p Value |
|---|---|---|---|
| % change in ADC | |||
| Based upon 50% reduction in nodal volume | 13.7 (-41 and 115) | 21.2 (-47 and 133) | 0.86 |
| At 6 months from the end of all treatment | 21.9 (-47 and 133) | -15.4 (-41 and -6) | 0.164 |
| At Last Follow-up date (April 30, 2010) | 23.7 (-35 and 115) | -15.4 (-47 and 133) | 0.113 |
| % change in T2 | |||
| Based upon 50% reduction in nodal volume | -27.1 (-60 and 32) | -37.5 (-58 and 14) | 0.126 |
| At 6 months from the end of all treatment | -17.4 (-60 and 32) | -9.1 (-59 and -1) | 0.824 |
| At Last Follow-up date (April 30, 2010) | -17.4 (-40 and 32) | -9.1 (-60 and 14) | 0.546 |
| % change in volume | |||
| Based upon 50% reduction in nodal volume | - | - | - |
| At 6 months from the end of all treatment | -77.1 (-96 and -24) | -51.1 (-77 and -41) | 0.498 |
| At Last Follow-up date (April 30, 2010) | -81.1 (-96 and -30) | -49.6 (-95 and -24) | 0.113 |
When response to treatment at 6 months after end of all treatment was used as the endpoint, 15 patients showed complete response, while 3 patients were classified as partial responders. Response to treatment at this clinical endpoint was based on radiological examinations (n=8) or histopathological findings (n=10). The % change in nodal volume, T2 and ADC values were not significantly different between complete responders and partial responders (p>0.05, Table 2), however complete responders, in general, showed an increase in ADC, while partial responders, demonstrated a reduction in ADC.
When medical records from these patients were examined at the last date of clinical follow-up (December 30, 2010), 6 patients who were initially determined to be complete responders exhibited a relapse and were therefore considered as non-responders for this third analysis. As a result, a total 9 of 18 patients were considered as partial-responders and remaining 9 were considered as complete responders at this clinical end point. Again, we did not observe any significant difference in % change in nodal volume, T2 and ADC values between responders and partial responders, even though, ADC values tended to increase in complete responders than partial responders, who demonstrated a slight decrease in ADC (Table 2).
By the end of the last follow-up period (December 30, 2010), 3 patients died due to HNSCC. The median follow-up time for alive and dead patients was 22.4 months (range, 13.1 - 43.4 months) and 15 months (range, 4.6 -35.8 months) respectively. The percent change in nodal volume, T2 and ADC values between alive and dead patients are presented as box and whiskers plots in Figure 2. A median increase of 22 (range -41 to 133) % in ADC after induction chemotherapy was observed in patients that were alive, while patients who died from HNSCC demonstrated a 33% (range - 47 to -15) decrease in ADC values. It was interesting to note that all patients who died of HNSCC always demonstrated a decrease in ADC after induction chemotherapy. The difference in % change in ADC between alive patients and in patients who died of HNSCC was significant (p=0.039). However, no significant differences in the % change in nodal volume (p=0.130), or T2 values (p=0.654) were observed between alive and dead patients (Figure 2).
Figure 2.
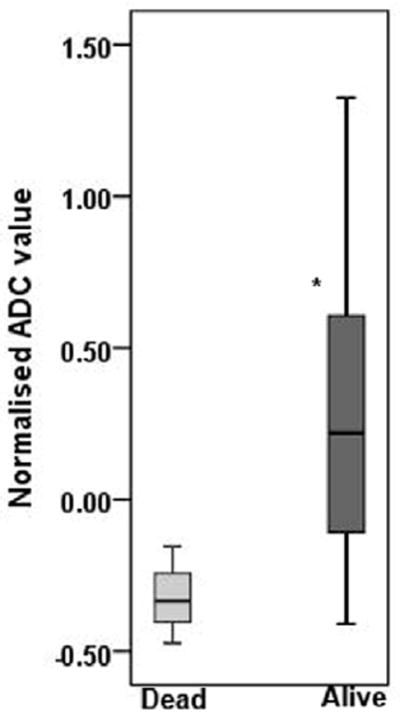
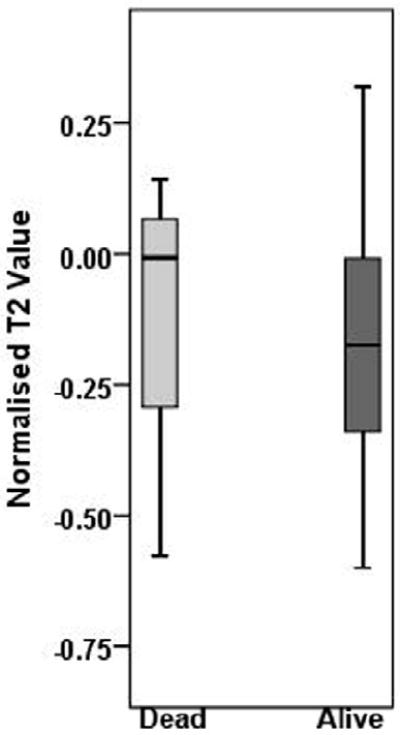
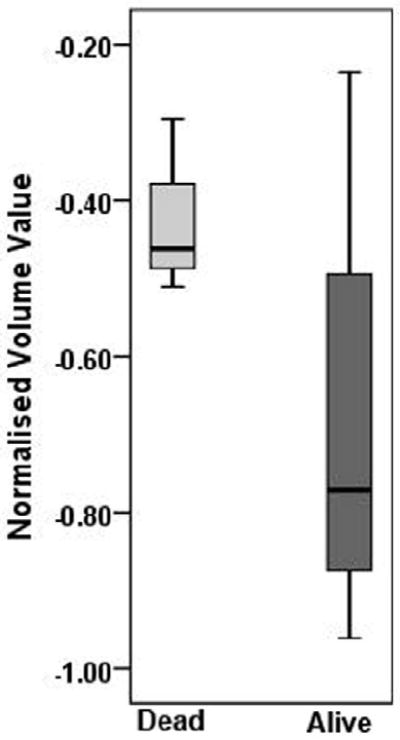
Box and whisker plots demonstrating variations in % change in ADC (a), T2 (b), and volume (c), from metastatic cervical lymph node of alive and dead patients. Significantly increased % change in ADC values from alive patients was observed compared to dead patients (p=0.039). * indicates significant change (p<0.05). Boxes represent the median, the 25th and the 75th percentiles, while bars indicate the range of data distribution.
Discussion
Our preliminary data demonstrates that increased ADC values after induction chemotherapy can aid in predicting progression free survival as it can discriminate surviving patients from patients who died due to HNSCC. This may have an impact on patient management as there is an increasing trend for treatment planning to be individualized, especially in locally advanced HNSCC. While concurrent chemo-radiation therapy is the standard of care in HNSCC, surgery is performed only in eligible patients (25, 31). In recent years however, neo-adjuvant induction chemotherapy is rapidly becoming popular, as it has the potential of reducing long-term functional losses (related to surgery) and leads to increased survival(32). It is thus important to develop non-invasive imaging markers that could potentially stratify patients who will benefit from induction chemotherapy from those who would not, so that alternative treatment strategies can be tailored for the individual patients to improve their quality of life. Our data, though in a small number of patients, indicates that DWI imaging has the potential to be used as a non-invasive marker for this purpose.
The ability of DWI (average ADC) to detect therapeutic response within days after initiation of treatment has been confirmed in the animal models of cancer (17, 18, 33). Preliminary clinical studies, investigating the potential of DWI in assessing treatment response to induction chemotherapy have also been performed in breast cancer (34) and bladder cancer (35). Recent studies have also shown the value of DWI in predicting and monitoring response to chemo-radiation therapy in HNSCC (25-27, 29, 30). Kim et al (27) observed significantly lower pretreatment mean ADC value in complete responder HNSCC patients undergoing chemo-radiation therapy than patients who showed partial or no response. Furthermore, a significant increase in ADC, within one week of concurrent chemo-radiation therapy was also observed in complete responders. In a recent study, a decrease in ADC in tumors after completion of therapy was suggestive to be a marker of loco-regional failure (29). Other studies have suggested that ADC values at 2nd and 4th weeks (30) or at the completion of chemo-radiation therapy (28) can differentiate between responding and non-responding HNSCC tumors. These published studies focused only on prediction and monitoring of short-term local treatment response to concurrent chemo-radiation therapy. In a recent study, therapeutic response to neo-adjuvant therapy in HNSCC was also assessed using DWI (28). However, there is no prior evidence evaluating the value of DWI in predicting long-term survival to induction chemotherapy as reported in the current study.
Other functional imaging techniques that have been used to evaluate response to induction chemotherapy in HNSCC include FDG-PET. Chepeha et al (36)observed a moderate agreement (kappa =0.62) between PET and endoscopic findings in assessing response to induction chemotherapy in HNSCC. In another study, deconvolution based dynamic CTP parameters were used to assess clinical response. Higher pretreatment blood volume (BV) showed significant correlation with endoscopic tumor response. In addition, reduction in the BV on follow-up studies also showed substantial agreement with clinical response as assessed with endoscopy (kappa =0.73)(9). While these imaging techniques demonstrate promising results, it is to be noted that in comparison, DWI can be readily implemented on most clinical MRI scanners. Furthermore, ADC is a quantitative and magnetic field independent parameter and thus the results are generally applicable across different institutions. In view of these advantages of DWI, we explored its utility in detection of response to induction chemotherapy at different clinical end points and prediction of progression free survival.
We observed significantly increased ADC following induction chemotherapy in surviving patients compared to patients who died due to HNSCC suggesting ADC could be used as an imaging biomarker that can predict progression free survival. The biological basis for a tumor to exhibit increased ADC following therapy and positive treatment response remains speculative. It has been postulated that cytotoxic chemotherapy stimulates necrosis and/or apoptosis resulting in cell death(37). Eventual removal of cellular debris by macrophages and expansion of extracellular volume causes a reduction in barriers that restrict diffusion of water molecules in a tumor may lead to higher ADC after treatment(19).
When we compared the percent change in nodal volume and T2 values between alive and dead patients and complete and partial-responders at different clinical end points, no significant difference was observed. It is known that, in addition to ADC, altered water content in the intracellular and extracellular space in a tissue after chemotherapy also influences T2 values. However, several preclinical tumor model studies have shown that ADC is more sensitive than T2 in monitoring response to treatment(17, 18, 38, 39). In a study with murine human glioma xenograft model, significant changes in T2 values were observed only with highest dose of radiation therapy, while ADC demonstrated significant changes at all doses (39). In another study, no significant change in T2 values was observed from experimental radiation induced fibrosarcoma 1 tumors following treatment with vascular disrupting agents (40). Similarly, in a clinical study involving HNSCC patients undergoing chemo-radiation therapy, Kim et al(27) did not observe significant change in T2 values from metastatic nodes following treatment further suggesting that T2 may not be a reliable marker in detecting treatment response. In the present study, even after taking into account the differences in magnetic field strength (by scanning a patient on same field strength MRI system at both time points), we did not observe any significant difference in T2 values between patient groups (complete responders and partial responders) and (alive and dead patients). This may be due to lower sensitivity of T2 in detecting the changes following treatment.
While some studies have shown the utility of tumor volume in predicting and monitoring treatment outcome in HNSCC patients treated with concomitant chemo-radiation therapy (41) or local radiotherapy (42-44), other studies have reported variable responses and survival rates (45, 46). Therefore, alternate parameters that can stratify patients for optimal treatment protocol are warranted and we believe that ADC can be one such parameter.
The absence of a significant difference in percent change in ADC between complete and partial responders at the three clinically assessed end points (Table 2) may be due to the variability in the treatment regimen and small number of patients (Table 1). However, it is to be noted that that at the six month time point, all partial responders exhibited a decrease in ADC while most complete responders exhibited an increase in ADC.
A major limitation of the current study, despite significant differences in ADC values, is the low number of patients who died from HNSCC versus the patients who were alive. This difference in the sample size can potentially bias the results. Due to better treatment regimens, the two-year survival rates in patients with head and neck cancer are much higher, which may have resulted in the low incidences of death in our patient group. Increasing the observation time to a five-year period might have resulted in a more balanced patient population; however, such an analysis was beyond the scope of the current study. Future multi-center studies are warranted to further evaluate the utility of DWI in predicting long-term survival in HNSCC patients undergoing induction chemotherapy. Another limitation is a lack of histopathological diagnosis at the end of induction chemotherapy for assessing local treatment response. Despite these limitations, our study demonstrates that patients who showed increase in ADC after induction chemotherapy had better progression free survival than patients who demonstrated decrease in ADC values. We believe ADC may be used as suitable biomarker for multicenter and longitudinal clinical trials in predicting survival and monitoring treatment outcome to induction chemotherapy in HNSCC.
Acknowledgments
The support of MRI coordinator Alex Kilger and technologists Doris Cain, Tonya Kurtz and Patricia O’ Donnell is gratefully acknowledged. The work was supported by grant funds from NIH - R01-CA102756 (HP).
Footnotes
Publisher's Disclaimer: This is a PDF file of an unedited manuscript that has been accepted for publication. As a service to our customers we are providing this early version of the manuscript. The manuscript will undergo copyediting, typesetting, and review of the resulting proof before it is published in its final citable form. Please note that during the production process errors may be discovered which could affect the content, and all legal disclaimers that apply to the journal pertain.
References
- 1.Posner M, Vermorken JB. Induction therapy in the modern era of combined-modality therapy for locally advanced head and neck cancer. Semin Oncol. 2008;35(3):221–8. doi: 10.1053/j.seminoncol.2008.03.007. [DOI] [PubMed] [Google Scholar]
- 2.Specenier PM, Vermorken JB. Neoadjuvant chemotherapy in head and neck cancer: should it be revisited? Cancer Lett. 2007;256(2):166–77. doi: 10.1016/j.canlet.2007.06.015. [DOI] [PubMed] [Google Scholar]
- 3.Ensley JF, Jacobs JR, Weaver A, et al. Correlation between response to cisplatinum-combination chemotherapy and subsequent radiotherapy in previously untreated patients with advanced squamous cell cancers of the head and neck. Cancer. 1984;54(5):811–4. doi: 10.1002/1097-0142(19840901)54:5<811::aid-cncr2820540508>3.0.co;2-e. [DOI] [PubMed] [Google Scholar]
- 4.Lee WC, Chavez YE, Baker T, Luce BR. Economic burden of heart failure: a summary of recent literature. Heart Lung. 2004;33(6):362–71. doi: 10.1016/j.hrtlng.2004.06.008. [DOI] [PubMed] [Google Scholar]
- 5.Fury MG, Shah JP. Induction chemotherapy in the management of head and neck cancer. J Surg Oncol. 101(4):292–8. doi: 10.1002/jso.21438. [DOI] [PubMed] [Google Scholar]
- 6.Minn H, Lapela M, Klemi PJ, et al. Prediction of survival with fluorine-18-fluoro-deoxyglucose and PET in head and neck cancer. J Nucl Med. 1997;38(12):1907–11. [PubMed] [Google Scholar]
- 7.Schwartz DL, Rajendran J, Yueh B, et al. FDG-PET prediction of head and neck squamous cell cancer outcomes. Arch Otolaryngol Head Neck Surg. 2004;130(12):1361–7. doi: 10.1001/archotol.130.12.1361. [DOI] [PubMed] [Google Scholar]
- 8.Hermans R, Meijerink M, Van den Bogaert W, Rijnders A, Weltens C, Lambin P. Tumor perfusion rate determined noninvasively by dynamic computed tomography predicts outcome in head-and-neck cancer after radiotherapy. Int J Radiat Oncol Biol Phys. 2003;57(5):1351–6. doi: 10.1016/s0360-3016(03)00764-8. [DOI] [PubMed] [Google Scholar]
- 9.Gandhi D, Hoeffner EG, Carlos RC, Case I, Mukherji SK. Computed tomography perfusion of squamous cell carcinoma of the upper aerodigestive tract. Initial results J Comput Assist Tomogr. 2003;27(5):687–93. doi: 10.1097/00004728-200309000-00005. [DOI] [PubMed] [Google Scholar]
- 10.Maldonado X, Alonso J, Giralt J, et al. 31Phosphorus magnetic resonance spectroscopy in the assessment of head and neck tumors. Int J Radiat Oncol Biol Phys. 1998;40(2):309–12. doi: 10.1016/s0360-3016(97)00735-9. [DOI] [PubMed] [Google Scholar]
- 11.Shukla-Dave A, Poptani H, Loevner LA, et al. Prediction of treatment response of head and neck cancers with P-31 MR spectroscopy from pretreatment relative phosphomonoester levels. Acad Radiol. 2002;9(6):688–94. doi: 10.1016/s1076-6332(03)80314-8. [DOI] [PubMed] [Google Scholar]
- 12.Bezabeh T, Odlum O, Nason R, et al. Prediction of treatment response in head and neck cancer by magnetic resonance spectroscopy. AJNR Am J Neuroradiol. 2005;26(8):2108–13. [PMC free article] [PubMed] [Google Scholar]
- 13.Kim S, Loevner LA, Quon H, et al. Prediction of response to chemoradiation therapy in squamous cell carcinomas of the head and neck using dynamic contrast-enhanced MR imaging. AJNR Am J Neuroradiol. 31(2):262–8. doi: 10.3174/ajnr.A1817. [DOI] [PMC free article] [PubMed] [Google Scholar]
- 14.Gupta RK, Sinha U, Cloughesy TF, Alger JR. Inverse correlation between choline magnetic resonance spectroscopy signal intensity and the apparent diffusion coefficient in human glioma. Magn Reson Med. 1999;41(1):2–7. doi: 10.1002/(sici)1522-2594(199901)41:1<2::aid-mrm2>3.0.co;2-y. [DOI] [PubMed] [Google Scholar]
- 15.Guo AC, Cummings TJ, Dash RC, Provenzale JM. Lymphomas and high-grade astrocytomas: comparison of water diffusibility and histologic characteristics. Radiology. 2002;224(1):177–83. doi: 10.1148/radiol.2241010637. [DOI] [PubMed] [Google Scholar]
- 16.Zhao M, Pipe JG, Bonnett J, Evelhoch JL. Early detection of treatment response by diffusion-weighted 1H-NMR spectroscopy in a murine tumour in vivo. Br J Cancer. 1996;73(1):61–4. doi: 10.1038/bjc.1996.11. [DOI] [PMC free article] [PubMed] [Google Scholar]
- 17.Chenevert TL, McKeever PE, Ross BD. Monitoring early response of experimental brain tumors to therapy using diffusion magnetic resonance imaging. Clin Cancer Res. 1997;3(9):1457–66. [PubMed] [Google Scholar]
- 18.Poptani H, Puumalainen AM, Grohn OH, et al. Monitoring thymidine kinase and ganciclovir-induced changes in rat malignant glioma in vivo by nuclear magnetic resonance imaging. Cancer Gene Ther. 1998;5(2):101–9. [PubMed] [Google Scholar]
- 19.Kauppinen RA. Monitoring cytotoxic tumour treatment response by diffusion magnetic resonance imaging and proton spectroscopy. NMR Biomed. 2002;15(1):6–17. doi: 10.1002/nbm.742. [DOI] [PubMed] [Google Scholar]
- 20.Hamstra DA, Lee KC, Moffat BA, Chenevert TL, Rehemtulla A, Ross BD. Diffusion magnetic resonance imaging: an imaging treatment response biomarker to chemoradiotherapy in a mouse model of squamous cell cancer of the head and neck. Transl Oncol. 2008;1(4):187–94. doi: 10.1593/tlo.08166. [DOI] [PMC free article] [PubMed] [Google Scholar]
- 21.Sumi M, Sakihama N, Sumi T, et al. Discrimination of metastatic cervical lymph nodes with diffusion-weighted MR imaging in patients with head and neck cancer. AJNR Am J Neuroradiol. 2003;24(8):1627–34. [PMC free article] [PubMed] [Google Scholar]
- 22.Wang J, Takashima S, Takayama F, et al. Head and neck lesions: characterization with diffusion-weighted echo-planar MR imaging. Radiology. 2001;220(3):621–30. doi: 10.1148/radiol.2202010063. [DOI] [PubMed] [Google Scholar]
- 23.Srinivasan A, Dvorak R, Perni K, Rohrer S, Mukherji SK. Differentiation of benign and malignant pathology in the head and neck using 3T apparent diffusion coefficient values: early experience. AJNR Am J Neuroradiol. 2008;29(1):40–4. doi: 10.3174/ajnr.A0743. [DOI] [PMC free article] [PubMed] [Google Scholar]
- 24.Razek AA, Megahed AS, Denewer A, Motamed A, Tawfik A, Nada N. Role of diffusion-weighted magnetic resonance imaging in differentiation between the viable and necrotic parts of head and neck tumors. Acta Radiol. 2008;49(3):364–70. doi: 10.1080/02841850701777390. [DOI] [PubMed] [Google Scholar]
- 25.Vandecaveye V, De Keyzer F, Nuyts S, et al. Detection of head and neck squamous cell carcinoma with diffusion weighted MRI after (chemo)radiotherapy: correlation between radiologic and histopathologic findings. Int J Radiat Oncol Biol Phys. 2007;67(4):960–71. doi: 10.1016/j.ijrobp.2006.09.020. [DOI] [PubMed] [Google Scholar]
- 26.Abdel Razek AA, Kandeel AY, Soliman N, et al. Role of diffusion-weighted echo-planar MR imaging in differentiation of residual or recurrent head and neck tumors and posttreatment changes. AJNR Am J Neuroradiol. 2007;28(6):1146–52. doi: 10.3174/ajnr.A0491. [DOI] [PMC free article] [PubMed] [Google Scholar]
- 27.Kim S, Loevner L, Quon H, et al. Diffusion-weighted magnetic resonance imaging for predicting and detecting early response to chemoradiation therapy of squamous cell carcinomas of the head and neck. Clin Cancer Res. 2009;15(3):986–94. doi: 10.1158/1078-0432.CCR-08-1287. [DOI] [PMC free article] [PubMed] [Google Scholar]
- 28.Kato H, Kanematsu M, Tanaka O, et al. Head and neck squamous cell carcinoma: usefulness of diffusion-weighted MR imaging in the prediction of a neoadjuvant therapeutic effect. Eur Radiol. 2009;19(1):103–9. doi: 10.1007/s00330-008-1108-5. [DOI] [PubMed] [Google Scholar]
- 29.King AD, Mo FK, Yu KH, et al. Squamous cell carcinoma of the head and neck: diffusion-weighted MR imaging for prediction and monitoring of treatment response. Eur Radiol. doi: 10.1007/s00330-010-1769-8. [DOI] [PubMed] [Google Scholar]
- 30.Vandecaveye V, Dirix P, De Keyzer F, et al. Predictive value of diffusion-weighted magnetic resonance imaging during chemoradiotherapy for head and neck squamous cell carcinoma. Eur Radiol. 20(7):1703–14. doi: 10.1007/s00330-010-1734-6. [DOI] [PubMed] [Google Scholar]
- 31.Garden AS, Asper JA, Morrison WH, et al. Is concurrent chemoradiation the treatment of choice for all patients with Stage III or IV head and neck carcinoma? Cancer. 2004;100(6):1171–8. doi: 10.1002/cncr.20069. [DOI] [PubMed] [Google Scholar]
- 32.Denis F, Garaud P, Bardet E, et al. Final results of the 94-01 French Head and Neck Oncology and Radiotherapy Group randomized trial comparing radiotherapy alone with concomitant radiochemotherapy in advanced-stage oropharynx carcinoma. J Clin Oncol. 2004;22(1):69–76. doi: 10.1200/JCO.2004.08.021. [DOI] [PubMed] [Google Scholar]
- 33.Galons JP, Altbach MI, Paine-Murrieta GD, Taylor CW, Gillies RJ. Early increases in breast tumor xenograft water mobility in response to paclitaxel therapy detected by non-invasive diffusion magnetic resonance imaging. Neoplasia. 1999;1(2):113–7. doi: 10.1038/sj.neo.7900009. [DOI] [PMC free article] [PubMed] [Google Scholar]
- 34.Sharma U, Danishad KK, Seenu V, Jagannathan NR. Longitudinal study of the assessment by MRI and diffusion-weighted imaging of tumor response in patients with locally advanced breast cancer undergoing neoadjuvant chemotherapy. NMR Biomed. 2009;22(1):104–13. doi: 10.1002/nbm.1245. [DOI] [PubMed] [Google Scholar]
- 35.Yoshida S, Koga F, Kawakami S, et al. Initial experience of diffusion-weighted magnetic resonance imaging to assess therapeutic response to induction chemoradiotherapy against muscle-invasive bladder cancer. Urology. 75(2):387–91. doi: 10.1016/j.urology.2009.06.111. [DOI] [PubMed] [Google Scholar]
- 36.Chepeha DB, Sacco AG, Oxford LE, et al. Advanced squamous cell carcinoma of the oropharynx: efficacy of positron emission tomography and computed tomography for determining primary tumor response during induction chemotherapy. Head Neck. 2009;31(4):452–60. doi: 10.1002/hed.21006. [DOI] [PubMed] [Google Scholar]
- 37.Edward Chu, DeVita Vincent T., Jr . Principles of Medical Oncology. In: DeVita Vincent T, Jr, Hellman Samuel, Rosenberg Steven A., editors. Cancer: Principles & Practice of Oncology. Philadelphia: Lippincott Williams & Wilkins; 2005. pp. 296–306. [Google Scholar]
- 38.Larocque MP, Syme A, Yahya A, Wachowicz K, Allalunis-Turner J, Fallone BG. Monitoring T2 and ADC at 9.4 T following fractionated external beam radiation therapy in a mouse model. Phys Med Biol. 55(5):1381–93. doi: 10.1088/0031-9155/55/5/008. [DOI] [PubMed] [Google Scholar]
- 39.Larocque MP, Syme A, Yahya A, Wachowicz K, Allalunis-Turner J, Fallone BG. Temporal and dose dependence of T2 and ADC at 9.4 T in a mouse model following single fraction radiation therapy. Med Phys. 2009;36(7):2948–54. doi: 10.1118/1.3147258. [DOI] [PubMed] [Google Scholar]
- 40.Madhu B, Waterton JC, Griffiths JR, Ryan AJ, Robinson SP. The response of RIF-1 fibrosarcomas to the vascular-disrupting agent ZD6126 assessed by in vivo and ex vivo 1H magnetic resonance spectroscopy. Neoplasia. 2006;8(7):560–7. doi: 10.1593/neo.06319. [DOI] [PMC free article] [PubMed] [Google Scholar]
- 41.Knegjens JL, Hauptmann M, Pameijer FA, et al. Tumor volume as prognostic factor in chemoradiation for advanced head and neck cancer. Head Neck. doi: 10.1002/hed.21459. [DOI] [PubMed] [Google Scholar]
- 42.Brenner DJ. Dose, volume, and tumor-control predictions in radiotherapy. Int J Radiat Oncol Biol Phys. 1993;26(1):171–9. doi: 10.1016/0360-3016(93)90189-3. [DOI] [PubMed] [Google Scholar]
- 43.Bentzen SM, Ruifrok AC, Thames HD. Repair capacity and kinetics for human mucosa and epithelial tumors in the head and neck: clinical data on the effect of changing the time interval between multiple fractions per day in radiotherapy. Radiother Oncol. 1996;38(2):89–101. doi: 10.1016/0167-8140(95)01689-9. [DOI] [PubMed] [Google Scholar]
- 44.Dubben HH, Thames HD, Beck-Bornholdt HP. Tumor volume: a basic and specific response predictor in radiotherapy. Radiother Oncol. 1998;47(2):167–74. doi: 10.1016/s0167-8140(97)00215-6. [DOI] [PubMed] [Google Scholar]
- 45.Wendt TG, Bank P. Prognostic factors in squamous cell carcinoma of the head and neck. Onkologie. 2002;25(3):208–12. doi: 10.1159/000064313. [DOI] [PubMed] [Google Scholar]
- 46.Forastiere AA, Ang K, Brizel D, et al. Head and neck cancers. J Natl Compr Canc Netw. 2005;3(3):316–91. doi: 10.6004/jnccn.2005.0019. [DOI] [PubMed] [Google Scholar]