Abstract
This report presents the results of a study of the frequency potentiation of inhibitory postsynaptic currents (IPSCs) in hypoglossal motoneurons and its modulation by serotonin. A release-site model of synaptic plasticity was used to characterize the frequency-related potentiation of evoked IPSCs. Data were obtained to determine if the frequency of potentiation of IPSCs occurs as a consequence of a low baseline quantal content of evoked IPSCs using whole cell patch-clamp recordings from hypoglossal motoneurons in the neonatal rat brainstem slice preparation. In these motoneurons, EPSCs and GABAergic IPSCs were blocked by the application of CNQX, AP-5 and bicuculline. Glycinergic IPSCs were evoked by threshold stimulation of inhibitory neurons in the nucleus of Roller, which is located ventro-lateral to the hypoglossal nucleus. IPSC responses to trains of stimuli were recorded in control solutions and in solutions containing serotonin, which is known to reduce IPSPs in this preparation. The amplitude of non-potentiated IPSCs was reduced and their frequency potentiation was enhanced when serotonin was added to the bath. These data were examined using a release-site model of synaptic plasticity in which facilitation is attributed to a time-dependent increase in the probability of transmitter release; depression was attributed to a time-dependent decrease in the number of sites available for release. Using this model, the effect of serotonin on frequency potentiation was explained by a combination of a reduction in the baseline probability of transmitter release and an increase in the time-constant of decay of the increase in probability of release that follows a stimulus.
Keywords: Rat, Hypoglossal, Motoneuron, Facilitation, Glycinergic, Serotonin
1. Introduction
Previously, we studied a region in the parvocellular reticular formation (PcRF) that contains glycinergic inhibitory interneurons that project to various brain stem motoneurons (Pedroarena et al., 1990; Castillo et al., 1991a, 1991b). While the PcRF is known to contain neurons involved in mastication (Mogoseanu et al., 1993), the present study was based on the observation that electrical stimulation in the PcRF produces IPSCs and IPSPs in brainstem motoneurons that exhibit diverse types of short-term synaptic plasticity, including frequency potentiation (Pedroarena et al., 1990; Donato and Nistri, 2001). The observation of frequency potentiation of IPSPs was a surprise in view of the many reports of the generation of paired-pulse and frequency-dependent depression at inhibitory synapses in the CNS (see citations in Varela et al., 1999). Since frequency potentiation of neurotransmitter release is generally believed to be due to a low initial probability of transmitter release (see reviews of short-term synaptic plasticity by Zucker (1989) and Zucker and Regehr (2002), we tested the hypothesis that the low quantal content of evoked IPSCs, induced by serotonin, was responsible for frequency potentiation. We first produced frequency potentiation of glycinergic IPSCs in hypoglossal motoneurons in a rat brain slice preparation which was bathed in a solution containing low concentrations of serotonin, which is known to inhibit the stimulus-evoked release of glycine from inhibitory interneurons in this preparation (Umemiya and Berger, 1995). We then obtained data that are consistent with the hypothesis that a low quantal content of evoked IPSCs is required for the generation of frequency potentiation of IPSPs in brainstem motoneurons.
2. Results
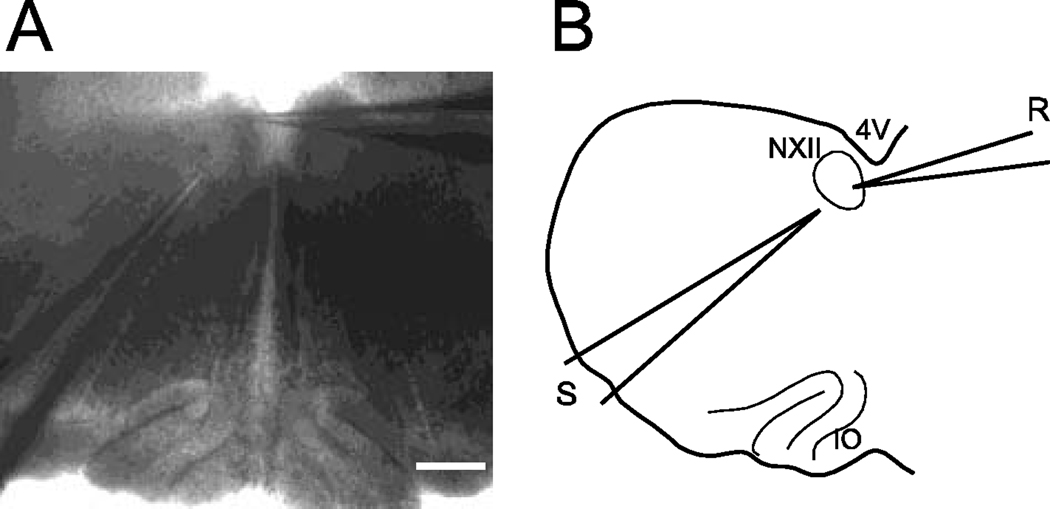
Whole-cell patch clamp records were obtained from 8 hypoglossal motoneurons in 4 brainstem slices from one week old rat pups. The relative position of the recording and stimulating electrodes in the brainstem slice is illustrated in Figure 1. In order to determine the effects of bath applied serotonin in this preparation, the passive electrical properties of 5 of these cells were first determined with the slices bathed in a control solution (which contained CNQX, AP-5 and bicuculline). When hyperpolarizing commands of 10–20 mV from a holding potential of −50 mV were employed, the input resistance was 63.3 ± 5.0 MΩ. The effective capacitance was 63.7 ± 12.4 pF (and the series resistance in these experiments was 26.7 ± 5.1 MΩ): All numbers are mean ± SEM, n =5.
Figure 1.
A- Photomicrograph of the brainstem slice preparation. The fourth ventricle is at the top of the figure; the recording electrode is shown entering from the right side of the field; its tip is located in the left hypoglossal nucleus. A stimulating electrode enters the field from the lower left; the tip is located in the nucleus of Roller. The inferior olive is at the bottom of the slice. Calibration bar: 200µM. B- Diagram of this brainstem preparation. 4V (fourth ventricle), NXII (hypoglossal nucleus), IO (inferior olive), R (recording) and S (stimulating) electrodes.
The decay of the current transient at the beginning of the voltage step could not be described by a single exponential function, indicating that the capacitance of hypoglossal motoneurons in this slice preparation was distributed in dendritic processes; consequently, an estimate of the total capacitance of these cells required a more sophisticated analysis of the current transients than that undertaken in the present report (Nadeau and Lester, 2000; Pandey and White, 2002). However, the effective capacitance reported here has been used by other investigators as an estimate of the capacitance of the soma (Lape and Nistri, 1999; Clements, 2000).
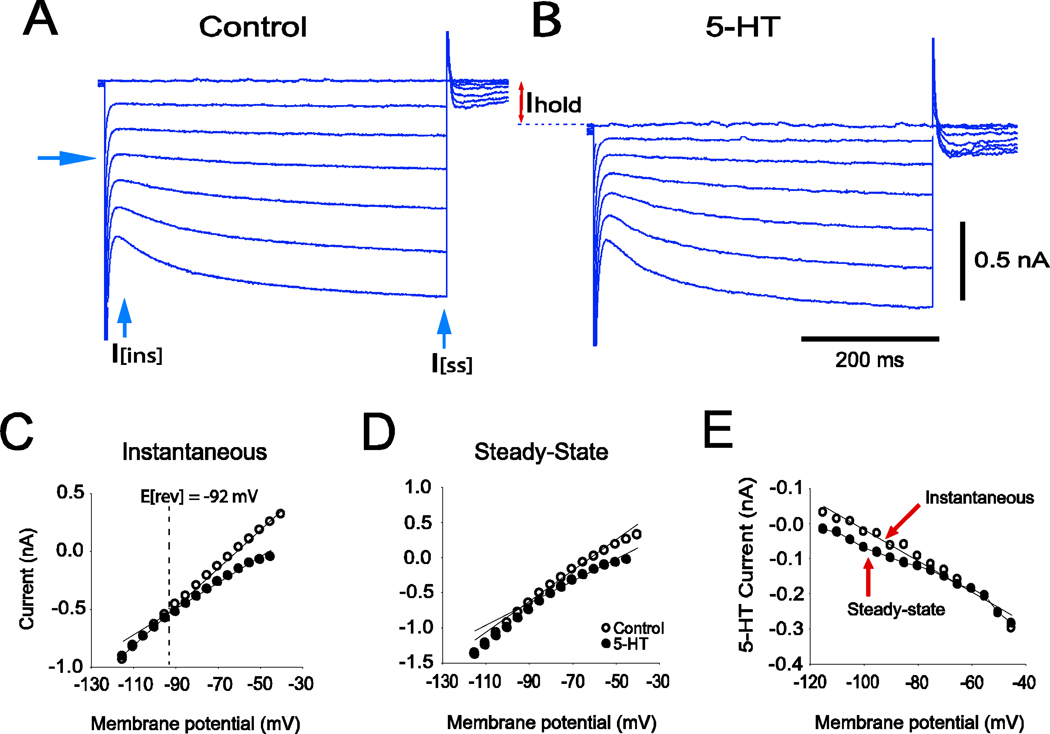
The current responses of a representative hypoglossal motoneuron to voltage pulses of increasing amplitude obtained in the control solution and after the addition of 5µM of serotonin are illustrated in Figure 2A and 2B, respectively. Note the hyperpolarization-activated inward current (presumably Ih) that is evident in this cell at voltage commands more negative than −30 mV (see arrow). Within 3 min of adding serotonin to the bathing solution, the holding current became more negative (inward). This difference in holding current is indicated in Figure 2B (I hold). In three cells in which current versus voltage (I–V) measurements were made in control and serotonin containing solutions, the average holding current was 156 ± 8 pA more negative in the presence of serotonin as compared to control conditions.
Figure 2.
Current-voltage (I–V) study in a single hypoglossal motoneuron in control and serotonin-containing solutions. A family of hyperpolarizing command voltage pulses (10mV increments) were applied from a holding potential of –50 mV. A. Control solution containing CNQX, AP-5 and bicuculline. B. Solution containing serotonin (5 µM) in addition to CNQX, AP-5 and bicuculline. Note the downward shift of the holding current when a serotonin-containing solution was employed (I hold). C. Instantaneous I–V relationship, open circles = control, filled circles = serotonin. Note the decrease in conductance in the solution containing serotonin. The equilibrium potential of the inward current that is induced by serotonin was −92 mV, which was the potassium equilibrium potential calculated for these cells. D. Steady-state I–V relationship (circles as in C), showing that the inward rectification is increased by serotonin. E. Serotonin-induced currents. Plot represents the differences in instantaneous (open circles) and steady-state (filled circles) currents between control and serotonin-containing solutions.
The instantaneous and steady-state I–V relationships are plotted in Figure 2C and 2D respectively, both for control (open circles) and serotonin-containing (filled circles) solutions. The differences between instantaneous currents (open circles) and steady state currents (filled circles) in control and serotonin containing solutions are indicated as "5-HT current" in Figure 2E. These results are similar to the effects of serotonin on guinea pig trigeminal motoneurons (compare our Figure 2 with Figure 3 in Hsiao et al., 1997).
Figure 3.
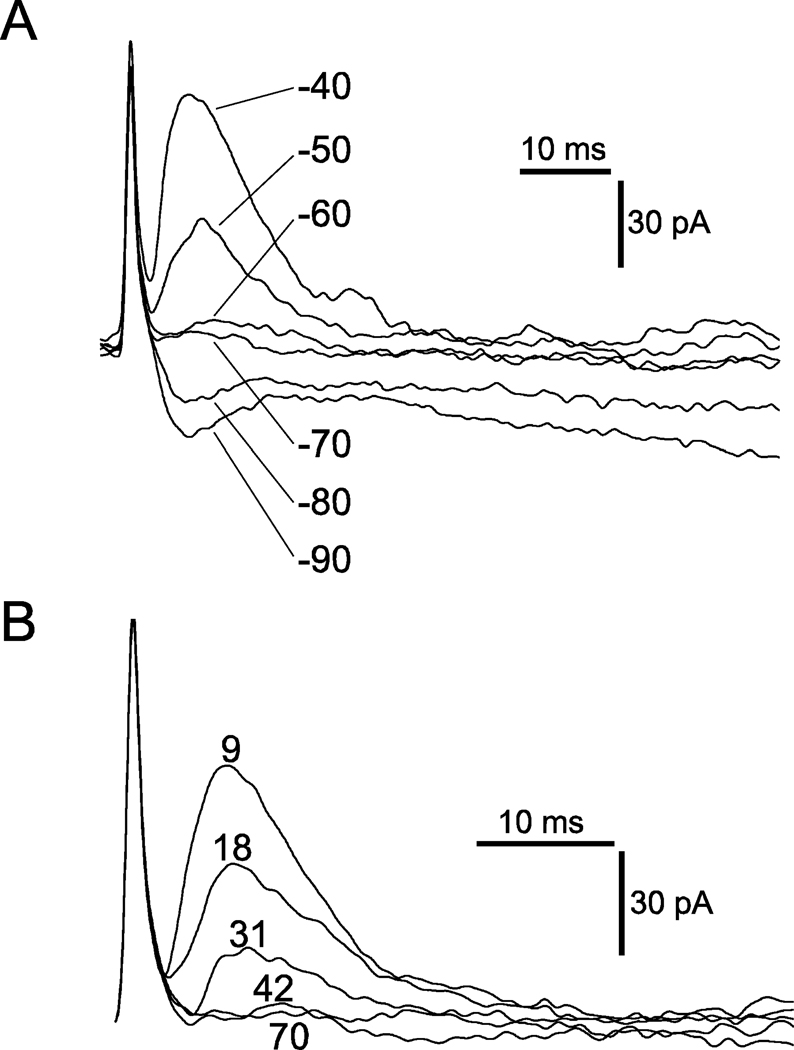
Properties of IPSCs evoked in a single hypoglossal motoneuron by stimulation of the nucleus of Roller. A. Superimposed traces of IPSCs obtained at different holding potentials (−40 to –90 mV as indicated). The reversal potential of the IPSC was −70 mV, which is near the chloride equilibrium potential calculated for these cells (−78.9 mV). B. Blockade of the IPSCs by strychnine (1 µM), which indicates that this synapse is glycinergic. Numbers indicate successive traces in the recording of the complete blockade that occurred between trace numbers 31 and 42.
The passive electrical properties of 4 hypoglossal motoneurons were measured in serotonin containing solutions (3 of the same cells were also measured in the control solution): input resistance was 119.5 ± 22.2 MΩ and the effective capacitance was 56.4 ± 6.8 pF (series resistance was 23.2 ± 3.0 MΩ). A comparison of these values with those measured in 5 cells in solutions without serotonin (see means ± SEMs presented earlier in results) indicated that while there were no statistically significant changes in either series resistance or effective capacitance, the mean input resistance of these cells increased 89% from 63.3 to 119.5 MΩ, when serotonin was added to the bath. This increase was statistically significant (unpaired t-test , t= 3.14; p < 0.05).
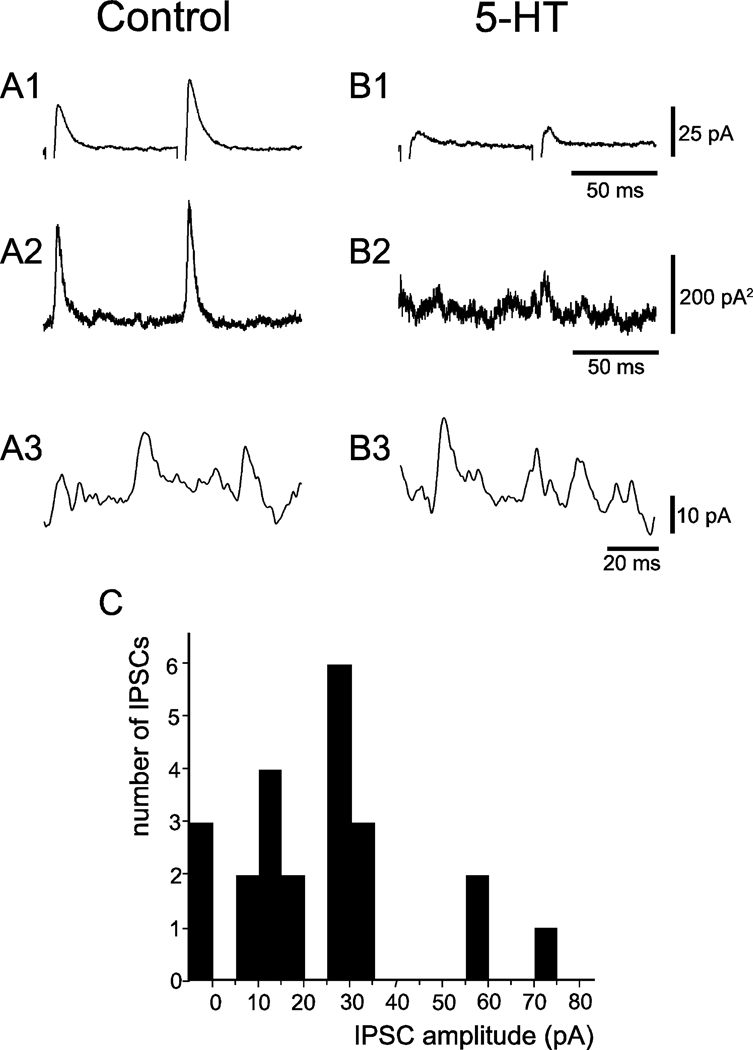
Excitatory postsynaptic currents (EPSCs) and IPSCs produced by GABA were blocked by adding CNQX (10 µM), AP-5 (50 µM) and bicuculline (10 µM) to the bathing solution. The inhibitory (outward) postsynaptic currents that remained had a reversal potential of −70 mV (Figure 3A), which was near the chloride equilibrium potential of −78.9 mV that was calculated for these cells (see Experimental procedures section). These inhibitory postsynaptic currents were blocked by strychnine (1 µM) (Figure 3B), indicating that they were produced by the release of glycine from the presynaptic terminals of the stimulated inhibitory interneurons. Adding serotonin to the bath resulted in a reduction in the average amplitude of the evoked IPSCs (Figure 4, A1 and B1), while leaving the amplitudes of spontaneous IPSCs intact (Figure 4, A3 and B3). The current variances, plotted in Figure 4, A2 and B2, were divided by the mean IPSC amplitudes in Figure 4, A1 and B1 to estimate the current produced by the release of a quantum of transmitter at this synapse. This procedure yielded estimates for the quantal components of the evoked IPSCs in this cell of 11 pA and 8 pA for the first and second stimulus, respectively, in the control solution, and of 11pA for the second stimulus in the solution containing serotonin. Not only were these estimates for the size of the quanta unaltered by serotonin, but they were the same order of magnitude as the spontaneous IPSCs (some of which are presumably miniature IPSCs) observed in the same neuron in the control and serotonin-containing solutions (Figure 4, A3 and B3). The evoked IPSCs exhibited amplitude distributions, indicating that they were composed of a maximum of 3 to 5 quanta of transmitter; as shown in the example of Figure 4C. This figure illustrates the amplitude distribution histogram for the IPSC recorded in the bath solution containing serotonin. In this case, 1 to 5 quanta with an estimated size of 14pA were present. Estimates of the quantal size based on the variance divided by the mean are used when the quantal content of the evoked IPSC is large and is known to underestimate quantal size. These observations confirm previous reports that serotonin inhibits glycinergic synaptic transmission in this preparation via a presynaptic mechanism (Umemiya and Berger, 1995). We note that estimates based on IPSC amplitude distribution histograms, which yield a more accurate estimate of quantal size, can be used when the quantal content of the evoked IPSC is low.
Figure 4.
Presynaptic inhibition of IPSCs by serotonin. A1 and B1, average IPSCs in the same cell evoked by stimuli in a control solution (90 trials) and serotonin-containing solution (43 trials), respectively. Stimulus artifacts have been suppressed. A2 and B2: variance of the current records shown in A1 and B1. A3 and B3: single, high-gain sweeps of spontaneous IPSCs with sizes that are similar to the estimated size of the quanta that comprise the evoked IPSCs in this cell. C: IPSC amplitude histogram from a cell bathed in serotonin showing that 1 to 5 quanta with an estimated size of 14 pA are present in the evoked IPSCs observed in this cell. Note that there were 3 failures in 23 trials.
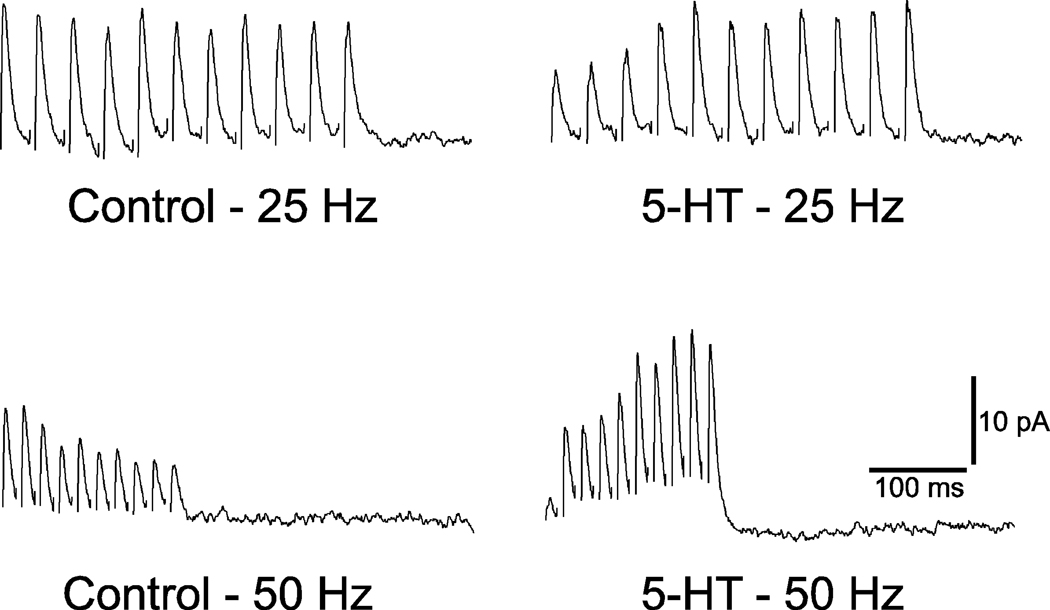
The effect of serotonin on the average amplitudes of IPSCs evoked in the same hypoglossal motoneuron by trains of stimuli at different frequencies is illustrated in Figure 5. Note that while serotonin reduces the average amplitude of the first response, the overall effect of the train of stimuli is a shift from depression, in the control solution, to facilitation in the solution containing serotonin. Furthermore, the magnitude of the facilitation was greater the higher the frequency of stimulation.
Figure 5.
Average IPSC responses to trains of stimuli in control and serotonin-containing solutions. Stimulus artifacts have been suppressed. Note that when the control solution was used, there is a depression of the IPSCs during the 25 Hz train and that this depression is more pronounced at 50 Hz. In contrast, facilitation and frequency potentiation is observed in conjunction with the solution containing serotonin.
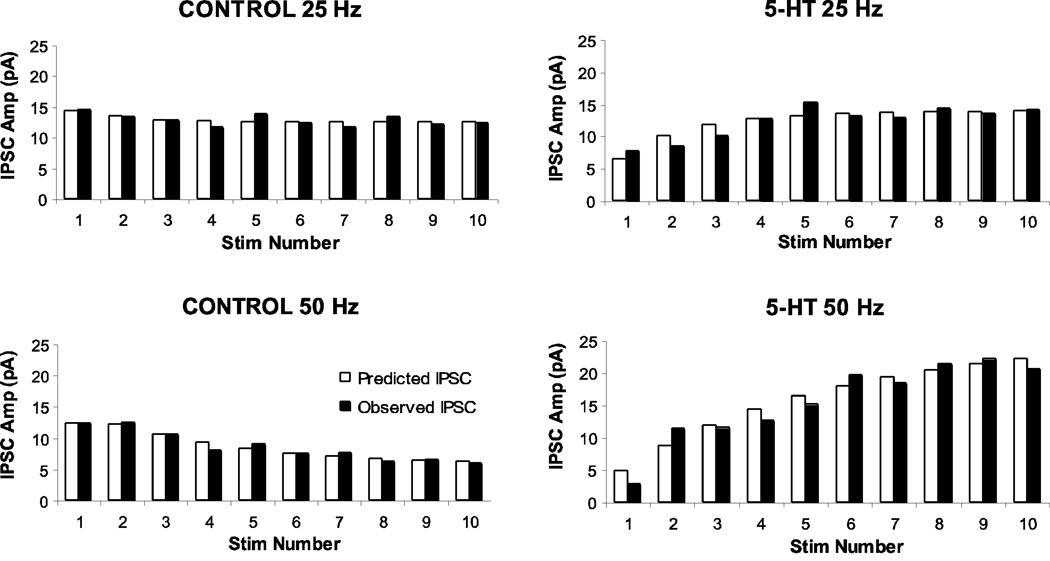
Using the release-site model described in the Experimental Procedures section, the data of Figure 5 was fit, as shown in Figure 6, using the following values for the parameters in this model: the quantal size (q) and total number of release sites (N (0)) were held constant at 19 pA and 4, respectively. For the 25 Hz stimulation, there was little change in the recovery time constant (τR), which was 58 ms in control and 50 ms in serotonin solutions. For the 50 Hz stimulation the recovery time constants required to fit the data were 170 ms in control and 20 ms in serotonin. The salient features of this model for the 25 Hz stimulus train reflected the fact that when this cell was exposed to serotonin, P(0) decreased from 19% to 9% and the time constant of the facilitation processes increased from 13 ms to 98 ms, resulting in facilitation of the overall response to the stimulus train. The frequency potentiation in conjunction with serotonin (i.e., an increase in facilitation when 50 Hz, rather than 25 Hz, stimulus trains were employed) can be explained by an increase in the time constant of the facilitatory process (from 98 ms at 25 Hz to 214 ms at 50 Hz).
Figure 6.
Release-site model of synaptic plasticity that is fit to the frequency depression and facilitation data presented in Figure 5. Fit was obtained by adjusting the facilitation time constant and the depression recovery time constant so as to minimize the chi-square test for goodness of fit. Filled bars are the observed mean IPSC amplitudes and clear bars are the amplitudes predicted by the model. The model parameters used to obtain these fits are expressed in the Results section.
IPSC responses were recorded following 25 Hz stimulus trains in 4 cells in both control and serotonin-containing solutions; all 4 cells exhibited an increase in facilitation when exposed to serotonin. When these data were fit with the release-site model, no statistically significant changes in N(0), τR, or q were required to account for the increase in facilitation that was observed with serotonin. However, P(0) decreased an average of 27 ± 6% and τF increased an average of 126 ± 22 ms; these changes were statistically significant (paired t-test, t = 4.50 and 5.86 respectively, p <0.05). Thus, the effect of serotonin on the response of IPSCs to a stimulus train can be explained by a decrease in the initial probability of transmitter release, P(0), combined with an increase in the decay time constant, τF, of the increase in probability of release that followed the stimulus.
3. Discussion
In the present work, we studied the frequency potentiation of IPSCs in hypoglossal motoneurons in vitro. We found that serotonin induced facilitation of frequency potentiation that was associated with a reduction in the quantal content of evoked transmitter release. There is growing evidence that serotonin presynaptically affects excitatory and inhibitory neurotransmission (Guo and Rainnie, 2010). In our study, the effects of serotonin could be explained by a reduction in the baseline probability of transmitter release in combination with an increase in the time constant of the facilitatory process. The molecular mechanisms of this serotonergic effect on glycinergic inhibitory synaptic plasticity remains to be determined; however, studies of the relationships between use-dependent plasticity and residual presynaptic calcium (Dittman et al., 2000), as well as microfluorometric imaging studies of the effects of serotonin on intracellular calcium concentrations (Ladewig et al., 2004), suggest that the influx and sequestration of calcium ions are involved in the phenomena we describe in this report.
We have shown, in a previous report from our laboratory, that a small number (less than or equal to 5) of small-amplitude unitary potentials constitute the large, REM (active) sleep-specific glycinergic IPSPs that are observed in cat hypoglossal motoneurons (Engelhardt et al., 2004). On the basis of the evidence available at that time, we could not determine whether these minimal unitary potentials were produced by the release of a single or multiple quanta of a neurotransmitter. The large signal-to-noise ratio of the evoked glycinergic IPSCs recorded in hypoglossal motoneurons in the present experiment may help resolve this question because they were also composed of a maximum of 3 or 4 minimal units which were clearly attributable to single quanta of inhibitory transmitter. Thus, the minimal unitary potentials that constitute the sleep-specific IPSPs that we observed in cat hypoglossal motoneurons, in vivo, we believe, are due to the release of single quanta of the neurotransmitter, glycine. The small number of quanta involved in these IPSPs and IPSCs may reflect the size of the readily releasable pool at a single synapse (5.0 ± 3.0) (Dobrumz and Stevens, 1997) or the small number of active zones (4–14) on glycinergic presynaptic terminals in the CNS (Alvarez et al., 1997). Consequently, the large REM (active) sleep-specific IPSPs observed in motoneurons, in vivo, likely reflect the synchronized release of a small number of these quanta, possibly one from each of several release sites or active zones on a single presynaptic bouton.
We wish to consider the physiological significance of the phenomena we have observed in vitro. It was initially suggested that the PcRF region of the brainstem contains neurons that inhibit motoneurons during REM (active) sleep (Castillo et al., 1991b, Rampon et al., 1996); however, anatomical studies indicate that it is unlikely that the PcRF is involved in the control of motoneurons during this sleep state (Fung et al., 1999; Morales et al., 1999, 2006). On the other hand, serotonergic neurons in the raphe obscurus and pallidus nuclei are known to project to the hypoglossal nucleus (Woch et al., 1996). There is a striking decrease in the discharge of raphe neurons during NREM (quiet) sleep compared with wakefulness and there is practically a cessation of discharge during REM (active) sleep (Heym et al., 1982; Trulson and Trulson, 1982). Consequently, we conclude that endogenous serotonin modulates the quantal content of glycinergic IPSPs in hypoglossal motoneurons during the various waking behaviors that are influenced/controlled by the serotonergic system (Martin-Cora et al., 2005; Michelsen et al., 2008; Newcomb and Katz, 2009).
4. Experimental procedures
All experimental procedures were performed according to NIH guidelines for the care and use of laboratory animals. In addition, all efforts were made to use the minimal number of animals necessary to produce reliable, statistically significant data. Neonatal Wistar rat pups (one week old) were decapitated using a guillotine, the brainstem was then removed and cut into 250 µm thick transverse sections using a vibratome (Leica VT1000S). During this procedure, the tissue was bathed in cold (4° C) artificial cerebrospinal fluid (ACSF) in which sucrose had been substituted for NaCl. Cutting from a caudal to a rostral plane, two or three slices containing hypoglossal motoneurons were obtained at a point immediately anterior to the point where the spinal canal opens into the fourth ventricle. The slices were incubated in ACSF with NaCl for 30 minutes at 35° C. The composition of ACSF was as follows (in mM): NaCl, 124; KCl, 2.69; KH2PO4, 1.25; MgSO4, 2; NaHCO3, 26; glucose, 10; CaCl2, 2; pH 7.4.
Patch-clamp pipettes were pulled from "patch clamp glass" (Catalogue no. 596800, A–M Systems, Inc., Carlsborg, WA) on a Flaming/Brown micropipette puller (Model P-87, Sutter Instruments Co.); resistances were < 10 MΩ when the pipettes were filled with a solution of the following composition (in mM): K-Gluconate, 144; EGTA, 0.2;, MgCl2·6H2O, 3; HEPES, 10; NaGTP, 0.3; Na2ATP, 4; pH 7.2. When this solution reached equilibrium with the intracellular contents, the reversal potentials calculated at a room temperature of 24°C were −92.1 mV for potassium and −78.9 mV for chloride. The pipette filling solution was connected, via an AgAgCl wire, to an Axopatch 200B integrating patch-clamp amplifier with a DigiDATA 1322A 16 bit data acquisition system programmed with Axograph 4.6 software (Axon Instruments) running on a Macintosh computer. Slices were placed in an immersion chamber and perfused with ACSF oxygenated with 95% O2 5% CO2 at the flow rate of 1 ml/min. Neurons within the hypoglossal nucleus were visualized using a Nikon research microscope designed for patch-clamp experiments (Eclipse Physiostation, E 600FN) and a spot digital camera (Diagnostic Instruments, Inc., Sterling Heights, MI). Medium size somas, which were selected for study, were located within the margins of the hypoglossal nucleus; their surface was cleaned by applying positive pressure to the recording micropipette that was directed to the surface of the selected cell. The pipette tip was manipulated to make contact with the selected neuron and negative pressure was applied to the pipette until a gigohm seal was obtained. The patch of membrane inside the mouth of the pipette was then ruptured by a brief increase in negative pressure until electrical continuity between the interior of the pipette and the cell cytoplasm was established. Paired pulses or trains of pulses (10 to 50 µA adjusted to just above threshold to evoke glycinergic IPSCs) were delivered through an extracellular stimulating electrode, which was filled with normal ACSF and positioned just ventral and lateral to the hypoglossal nucleus in a region known to consist of glycinergic premotor inhibitory interneurons. This region is referred to as the nucleus of Roller (Umemiya and Berger, 1995; Paxinos and Watson, 1998). The dorsal aspects of the parvocellular region of the medullary reticular formation overlaps with this region (PcRF) (Pedroarena et al., 1990).
4.1. Analysis of passive cell electrical properties using voltage-clamp data
The series resistance, input resistance, and effective cell capacitance of the patch clamped cells were monitored on line using the Test Cell function of the Axograph data acquisition system (Clements, 2000). These resistance parameters were estimated using the magnitudes of the transient and steady state current responses at the beginning and end of a voltage command pulse. The effective cell capacitance was estimated by fitting a single exponential to the initial few milliseconds of the transient current response at the beginning of the voltage command pulse. This value for cell capacitance is used as an estimate of the somatic capacitance of neurons (Lape and Nistri, 1999; Clements, 2000).
4.2. Analysis of trains of evoked IPSCs
The analysis of the frequency-dependent facilitation and depression of IPSCs was based on a version of the release-site model (for the history of this model see citations in Sakaba et al., 2002). In this model the amplitude of the stimulus evoked IPSC is equal to the product of three terms; 1) the average amplitude of the miniature IPSC (q), 2) the number of sites, each with a single vesicle, that are available for release (N(t)), and 3) the probability of vesicle release from each of these sites (P(t)).
Facilitation is explained in this model as an increase in the probability of release, above a resting or baseline probability of release, P(0), that follows the arrival of an action potential at the nerve terminal. This increase in probability is initially equal to P(0) times the residual probability of release, 1-P(t); it decays exponentially back to a baseline probability of release with a time constant of facilitation equal to τF. Depression is explained in this model as a reduction in the number of sites that are available for release due to a time dependent process of site recovery following release. The probability that a site recovers after releasing a vesicle follows an exponential time course with a time constant τR.
The size of the quanta used in our model, q, was determined by the average difference between amplitudes of evoked IPSCs. The total number of release sites, N(0), was evaluated by means-variance analysis (Sakaba et al., 2002) and the baseline probability of release, P(0), was determined by the mean quantal content of the IPSCs evoked by the first stimulus in a series of stimulus trains. The time constants of the processes responsible for facilitation and recovery from depression (τF, and τR) were adjusted to minimize the chi-square test for goodness of fit between the mean amplitudes of the IPSCs evoked by the stimulus train and the IPSCs predicted by our model (Crow et al., 1960).
4.3. Statistical analysis
Measurements are reported as means ± SEM. The Student's t-test was used to test for differences between sample means; a paired t-test was employed when data were obtained in the same group of cells both before and after exposure to serotonin. The null hypothesis was rejected when the probability of the observed difference was less than 0.05.
TABLE 1.
Model parameters used to fit IPSC frequency depression in control solutions and frequency potentiation in serotonin containing solutions (illustrated in Figure 6).
| CONTROL | SEROTONIN | |||||||||
|---|---|---|---|---|---|---|---|---|---|---|
| N(0) | P(0) | τF(ms) | τR(ms) | q(pA) | N(0) | P(0) | τF(ms) | τR(ms) | q(pA) | |
| 25 Hz | 4 | 0.19 | 13 | 58 | 19 | 4 | 0.09 | 98 | 50 | 19 |
| 50 Hz | 4 | 0.16 | 12 | 170 | 19 | 4 | 0.06 | 214 | 20 | 19 |
ACKNOWLEDGEMENTS
We wish to thank Michel Alvarez for his technical assistance during the experiments as well as Bindi Shukla and Jeff Flood for their help in assembling the figures. These studies were supported by USPHS grants NS23426, NS09999, MH43362, and HL60296.
Footnotes
Publisher's Disclaimer: This is a PDF file of an unedited manuscript that has been accepted for publication. As a service to our customers we are providing this early version of the manuscript. The manuscript will undergo copyediting, typesetting, and review of the resulting proof before it is published in its final citable form. Please note that during the production process errors may be discovered which could affect the content, and all legal disclaimers that apply to the journal pertain.
References
- Alvarez FJ, Dewey DE, Harrington DA, Fyffe REW. Cell-type specific organization of glycine receptor clusters in the mammalian spinal cord. J. Comp. Neurol. 1997;379:150–170. [PubMed] [Google Scholar]
- Castillo P, Pedroarena C, Chase MH, Morales FR. A medullary inhibitory region for trigeminal motoneurons in the cat. Brain. Res. 1991a;549:346–349. doi: 10.1016/0006-8993(91)90480-j. [DOI] [PubMed] [Google Scholar]
- Castillo P, Pedroarena C, Chase MH, Morales FR. Strychnine blockade of the nonreciprocal inhibition of trigeminal motoneurons induced by stimulation of the parvocellular reticular formation. Brain. Res. 1991b;567:346–349. doi: 10.1016/0006-8993(91)90818-g. [DOI] [PubMed] [Google Scholar]
- Clements J. Axograph 4.6 Data Acquisition Manual. Axon Instruments, Inc. 2000:36–37. [Google Scholar]
- Crow EL, Davis FA, Maxfield MW. Statistics Manual. New York: Dover Publications; 1960. pp. 85–87. [Google Scholar]
- Dittman JS, Kreitzer AC, Regehr WG. Interplay between facilitation, depression, and residual calcium at three presynaptic terminals. J. Neurosci. 2000;15:1374–1385. doi: 10.1523/JNEUROSCI.20-04-01374.2000. [DOI] [PMC free article] [PubMed] [Google Scholar]
- Dobrunz LE, Stevens CF. Heterogeneity of release probability, facilitation, and depletion at central synapses. Neuron. 1997;18:995–1008. doi: 10.1016/s0896-6273(00)80338-4. [DOI] [PubMed] [Google Scholar]
- Donato R, Nistri A. Differential short-term changes in GABAergic or glycinergic synaptic efficacy on rat hypoglossal motoneurons. J. Neurophysiol. 2001;8:565–574. doi: 10.1152/jn.2001.86.2.565. [DOI] [PubMed] [Google Scholar]
- Engelhardt JK, Fung SJ, Yamuy J, Xi M-C, Morales FR, Chase MH. The unique inhibitory potentials in motoneurons that occur during active sleep are comprised of minimal unitary potentials. Brain Res. 2004;1018:26–31. doi: 10.1016/j.brainres.2004.05.094. [DOI] [PubMed] [Google Scholar]
- Fung SJ, Sampogna S, Morales FR, Chase MH. Localization of c-fos-immunoreactive premotor hypoglossal interneurons during carbachol-induced active sleep in cats. Sleep Research Online. 1999;2 supplement. 1:34. [Google Scholar]
- Guo J-D, Rainnie DG. Presynaptic 5-HT 1B receptor-mediated serotonergic inhibition of glutamate transmission in the bed nucleus of the stria terminalis. Neurosci. 2010;165:1390–1401. doi: 10.1016/j.neuroscience.2009.11.071. [DOI] [PMC free article] [PubMed] [Google Scholar]
- Heym J, Steinfels GF, Jacobs BL. Activity of serotonin-containing neurons in the nucleus raped pallidus of freely moving cats. Brain Res. 1982;251:259–276. doi: 10.1016/0006-8993(82)90743-0. [DOI] [PubMed] [Google Scholar]
- Hsiao CF, Trueblood PR, Levine MS, Chandler SH. Multiple effects of serotonin on membrane properties of trigeminal motoneurons in vivo. J. Neurophysiol. 1997;77:2910–2924. doi: 10.1152/jn.1997.77.6.2910. [DOI] [PubMed] [Google Scholar]
- Ladewig T, Lalley PM, Keller BU. Serotonergic modulation of intracellular calcium dynamics in neonatal hypoglossal motoneurons from mouse. Brain Res. 2004;1001:1–12. doi: 10.1016/j.brainres.2003.10.033. [DOI] [PubMed] [Google Scholar]
- Lape R, Nistri A. Voltage-activated K+ currents of hypoglossal motoneurons in a brain stem slice preparation from the neonatal rat. J. Neurophysiol. 1999;81:140–148. doi: 10.1152/jn.1999.81.1.140. [DOI] [PubMed] [Google Scholar]
- Martin-Cora FJ, Fornal CA, Jacobs BL. Single-unit responses of serotonergic medullary raphe neurons to cardiovascular challenges in freely moving cats. Eur. J. Neurosci. 2005;22:3195–3204. doi: 10.1111/j.1460-9568.2005.04519.x. [DOI] [PubMed] [Google Scholar]
- Michelsen KA, Prickaerts J, Steinbusch HW. The dorsal raphe nucleus and serotonin: implications for neuroplasticity linked to major depression and Alzheimer’s disease. Prog. Brain. Res. 2008;172:233–264. doi: 10.1016/S0079-6123(08)00912-6. [DOI] [PubMed] [Google Scholar]
- Mogoseanu D, Smith AS, Bolam JP. Monosynaptic innervation of trigeminal motor neurons involved in mastication by neurons of the parvicellular reticular formation. J. Comp. Neurol. 1993;336:53–65. doi: 10.1002/cne.903360105. [DOI] [PubMed] [Google Scholar]
- Morales FR, Sampogna S, Yamuy J, Chase MH. C-fos expression in brainstem premotor interneurons during cholinergically induced active sleep in the cat. J. Neurosci. 1999;19:9508–9518. doi: 10.1523/JNEUROSCI.19-21-09508.1999. [DOI] [PMC free article] [PubMed] [Google Scholar]
- Morales FR, Sampogna S, Rampon C, Luppi PH, Chase MH. Brainstem glycinergic neurons and their activation during active (rapid eye movement) sleep in the cat. Neuroscience. 2006;142:37–47. doi: 10.1016/j.neuroscience.2006.05.066. [DOI] [PubMed] [Google Scholar]
- Nadeau H, Lester HA. Two-compartment model for whole-cell data analysis and transient compensation. J. Neurosci. 2000;99:25–35. doi: 10.1016/s0165-0270(00)00210-7. [DOI] [PubMed] [Google Scholar]
- Newcomb JM, Katz PS. Different functions for homologous serotonergic interneurons and serotonin in species-specific rhythmic behaviours. Proc. Biol. Sci. 2009;276:99–108. doi: 10.1098/rspb.2008.0683. [DOI] [PMC free article] [PubMed] [Google Scholar]
- Pandey S, White MH. Parameter-extraction of a two-compartment model for whole-cell data analysis. J. Neurosci. 2002;120:131–143. doi: 10.1016/s0165-0270(02)00198-x. [DOI] [PubMed] [Google Scholar]
- Paxinos G, Watson C. The Rat Brain in Stereotaxic Coordinates. Academic Press: New York; 1998. [Google Scholar]
- Pedroarena C, Castillo P, Chase MH, Morales FR. Non-reciprocal postsynaptic inhibition of digastric motoneurons. Brain Res. 1990;535:339–342. doi: 10.1016/0006-8993(90)91621-m. [DOI] [PubMed] [Google Scholar]
- Rampon C, Peyron C, Petit JM, Fort P, Gervasoni D, Luppi PH. Origin of the glycinergic innervation of the rat trigeminal motor nucleus. NeuroReport. 1996;7:3081–3085. doi: 10.1097/00001756-199611250-00058. [DOI] [PubMed] [Google Scholar]
- Sakaba T, Schneggenburger R, Neher E. Estimation of quantal parameters at the calyx of Held synapse. Neuroscience Res. 2002;44:343–356. doi: 10.1016/s0168-0102(02)00174-8. [DOI] [PubMed] [Google Scholar]
- Trulson ME, Trulson VM. Activity of nucleus raphe pallidus neurons across the sleep-waking cycle in freely moving cats. Brain Res. 1982;237:232–237. doi: 10.1016/0006-8993(82)90572-8. [DOI] [PubMed] [Google Scholar]
- Umemiya M, Berger AJ. Presynaptic inhibition by serotonin of glycinergic inhibitory synaptic currents in the rat brain stem. J. Neurophysiol. 1995;73:1192–1200. doi: 10.1152/jn.1995.73.3.1192. [DOI] [PubMed] [Google Scholar]
- Varela JA, Song S, Turrigiano GG, Nelson SB. Differential depression of excitatory and inhibitory synapses in visual cortex. J. Neurosci. 1999;19:4293–4304. doi: 10.1523/JNEUROSCI.19-11-04293.1999. [DOI] [PMC free article] [PubMed] [Google Scholar]
- Woch G, Davies RO, Pack AI, Kubin L. Behaviour of raphe cells projecting to the dorsomedial medulla during carbachol induced atonia in the cat. J. Physiol. 1996;490:745–758. doi: 10.1113/jphysiol.1996.sp021182. [DOI] [PMC free article] [PubMed] [Google Scholar]
- Zucker RS. Short-term synaptic plasticity. Annu. Rev. Neurosci. 1989;12:13–31. doi: 10.1146/annurev.ne.12.030189.000305. [DOI] [PubMed] [Google Scholar]
- Zucker RS, Regehr WG. Short-term synaptic plasticity. Annu. Rev. Physiol. 2002;64:355–405. doi: 10.1146/annurev.physiol.64.092501.114547. [DOI] [PubMed] [Google Scholar]


