No one theory of pathogenesis can properly account for human kidney stones, they are too various and their formation too complex for simple understanding. Using human tissue biopsies, intra-operative imaging and such physiology as can be accomplished in humans, we have identified at least three pathways that lead to stones. Although the final product may be very similar, the way to achieve it is so different that in attempting to create animal and cell models of the process one needs to be careful that the details of the human condition are included.
The First Pathway: Overgrowth on interstitial apatite plaque
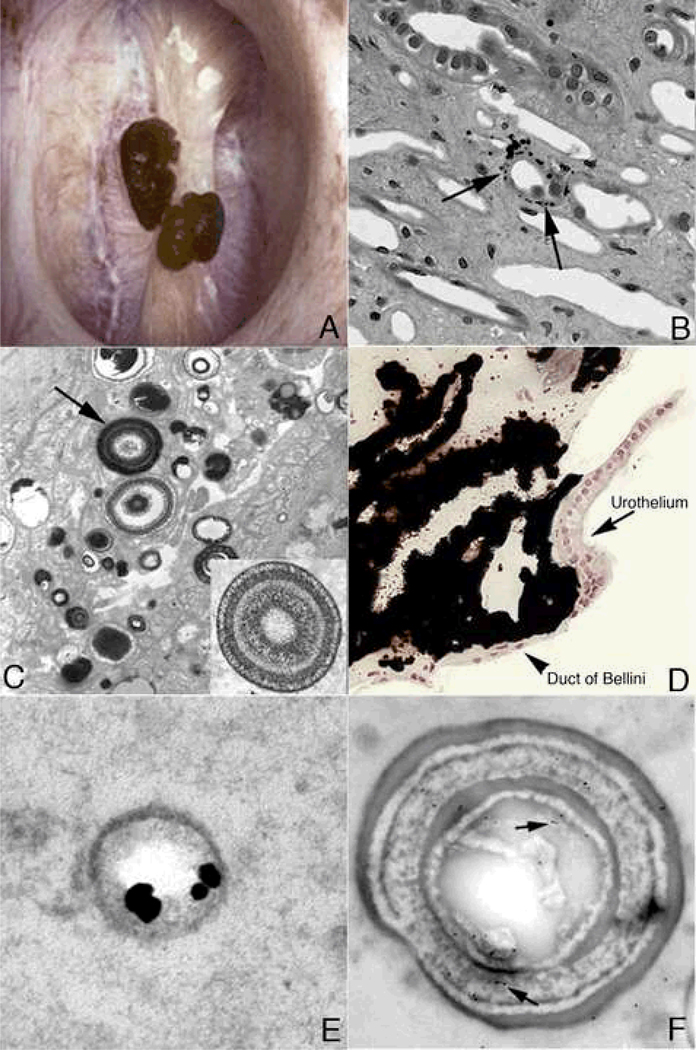
Plaque has been noticed for seven decades at least. Using modern digital imagining endoscopes one readily finds stones growing on plaque [1;2] (Figure 1A) as Randall did long ago at post mortem [3]. On biopsy, plaque forms in the basement membranes of thin limbs of Henle’s loop [4] (Figure 1B) as fine particles stained black here (arrows). No tissue reaction or cell injury occurs. On transmission electron microscopy (Figure 1C) particles are laminated microspherules of alternating white apatite crystals and black appearing organic matrix that coalesce in the interstitium to form a syncytium in which islands of crystal float in an organic sea (Figure 1D); the material readily migrates without crossing any anatomical barriers from its site of formation to the sub-urothelial space in which it can be seen from outside as the white plaque. Within plaque micro-spherules, osteopontin locates itself along the crystal – matrix boundary (panel E, black dots) [5], whereas the third heavy chain of the inter – alpha trypsin inhibitor lies in the matrix [6] (panel F, dots at arrow).
Figure 1. Endoscopic and histologic images of Randall’s plaque in ICSF patients.
Panel A shows two CaOx stones attached to the papilla tip at sites of Randall’s plaque as seen by endoscopy at the time of stone removal. On biopsy (panel B), tissue sections stained by the Yasue method reveals black, small, spherically shaped deposits (arrows) in the basement membrane of the thin loops of Henle, which appears to be the initiating site of plaque formation. By TEM, these deposits appear as multi-layered spheres with alternating light (crystal) and dark (matrix) bands. The smallest deposits were about 50 nm in diameter. Rather dense regions of interstitial plaque located near the papilla tip were commonly noted in ICSF patient (panel D) and at such sites crystal accumulated beneath the urothelium and around the distal ends of ducts of Bellini. Immunoelectron microscopic studies localized osteopontin immunogold particles (dark dots in panel E) at the crystal-matrix boundary whereas the third heavy chain of the inter-alpha trypsin molecule (arrows in panel F) was detected in the matrix layer.
All this is common in idiopathic calcium oxalate (CaOx) stone formers (ICSF), by which we mean CaOx stone formers with no known systemic disease apart from familial (idiopathic) hypercalciuria (IH). Plaque is also found in stone formers with primary hyperparathyroidism, ileostomy, and small bowel resection, and in brushite stone formers. However, the details for stone formation on plaque have been elucidated only in ICSF thus far.
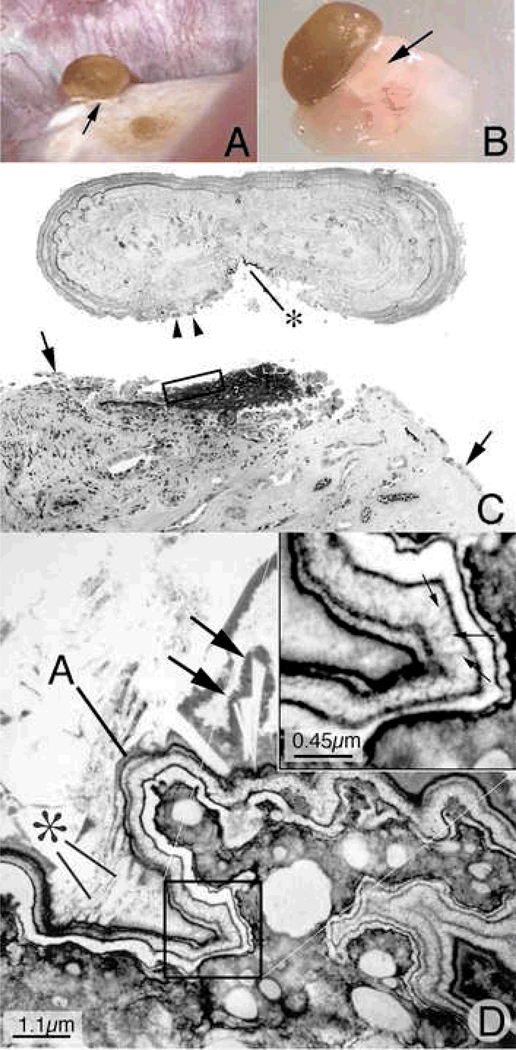
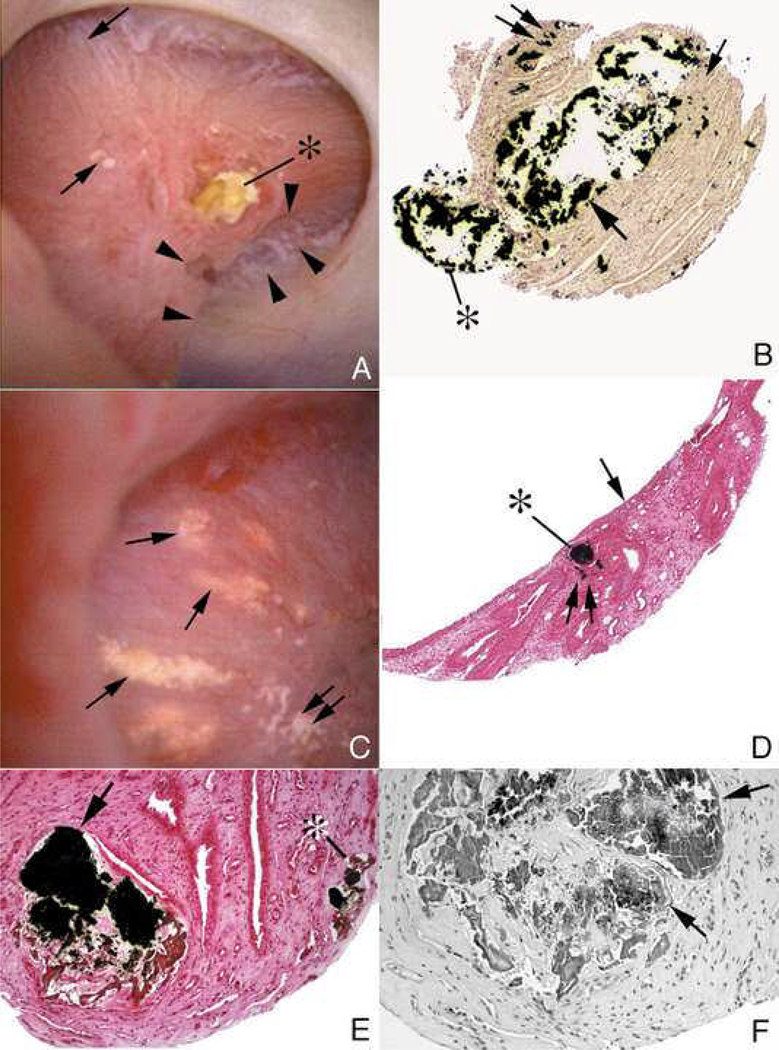
In an ICSF, a small (1 mm) stone is growing over plaque (Figure 2A, arrow) on a papillum; it was detached with its tissue underpinnings in which the plaque base is easily seen (Figure 2B, arrow) [7]. After mineral has been removed the slightly flattened stone is oriented floating above its old attachment site (Figure 2C) where a large base of plaque, stained black lies just below a small black plaque remnant on the stone (*). Remnants of urothelial cells lie on the stone (arrowheads) and at the margins of the denuded attachment site (arrows).
Figure 2. Histologic examination of attached human kidney stone.
During percutaneous nephrolithotomy for stone removal in a ICSF patient, two attached stones were noted on a single papillum (Panel A), a clear region of Randall’s plaque (arrow) is noted at the base of the larger of the two stones. Panel B shows the same stone and the underlying renal tissue with interposing region of Randall’s plaque (arrow) after biopsy removal of this entire complex. The entire biopsy specimen was subsequently decalcified and sectioned first for light microscopy (panel D). During the sectioning process the stone detached from its underpinning so the two images have been approximated in this figure. A large base of interstitial plaque, stained black here by the Yasue method, and framed in part by the rectangle was in continuity with the base of the stone that also reveals a small darkly stained regions (*). This region of plaque is completely devoid of its normal urothelial lining cells. Several attached epithelial cells (arrowheads) were seen at the periphery of the stone while arrows mark the site on the tissue where intact epithelial cells are seen again. The region in Figure 2C marked by the rectangle was prepared and sectioned for transmission electron microscopy (panel D). In this image, the region of interstitial plaque is at the lower right and the stone in the upper left. Between these two regions is a multilayered ribbon structure (labeled A) that forms a sharp boundary. This ribbon is formed by alternating layers of five thin black organic laminia and four, white crystalline laminia (see square and its enlarge in the insert at upper right of panel D). Small arrows in insert show perpendicularly oriented crystals in the white laminia. Various sized crystals (marked by * and large arrows) are seen embedded in the outer matrix layer of the ribbon-like structure.
Below Figure 2C, using TEM, plaque within the original tissue base of the stone lies under a folded multi-layered ribbon that forms an outer boundary between denuded plaque and what was the urinary space (Figure 2D; plaque at lower right, ribbon at ‘A’). The ribbon is layered apatite crystals, white, alternating with black appearing organic matrix, and over it crystals have formed in rafts and layers (*, and double arrows). An enlarged view (inset) shows the ribbon crystals aligned perpendicular to the long axis of the ribbon at small arrows. In other words, the exposed plaque was covered over by matrix (the layer immediately adjacent to the plaque) which then was covered by successive layers of crystal nuclei and more matrix; nucleation created about 7 layers, until the crystallization escaped from matrix and proceeded to form a stone proper.
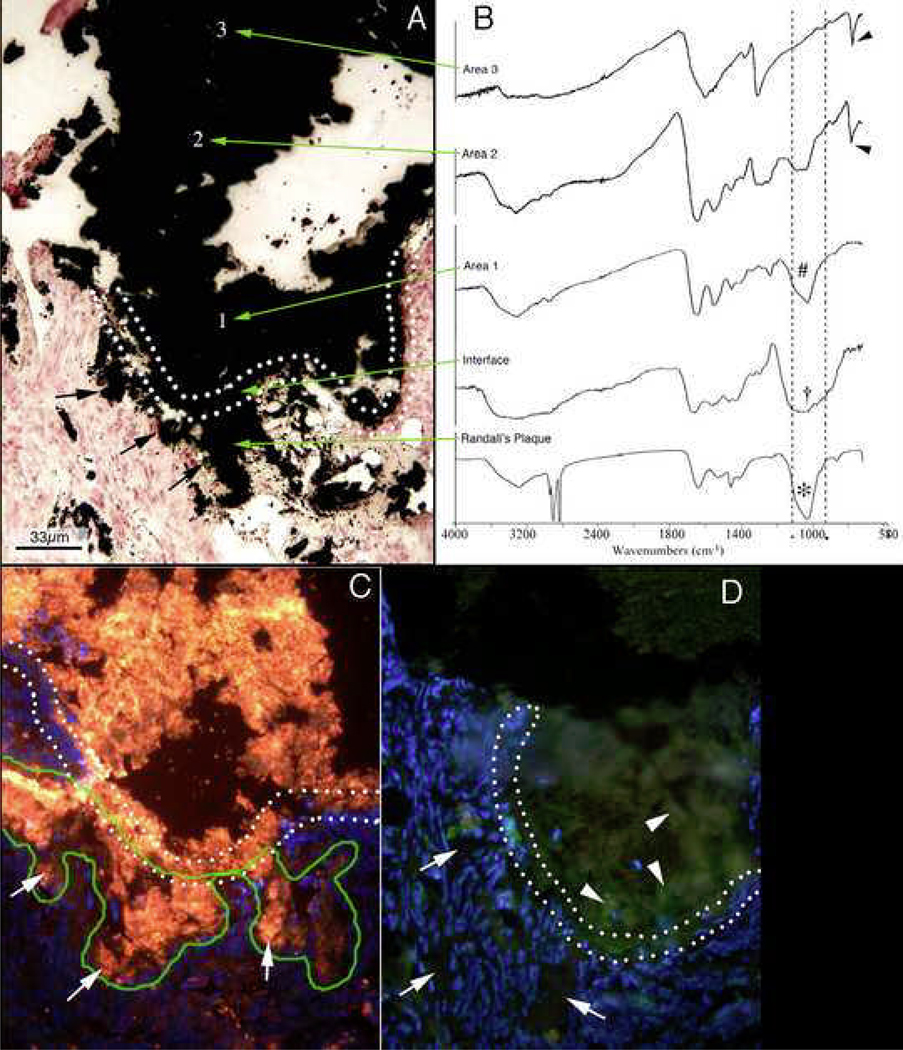
The crystal deposits under the ribbon (Figure 3A, double dotted line), which belong to plaque itself (black arrows), are apatite (Figure 3B, colored lowest arrow points from FTIR spectrum to crystal region); the vertical lines on the spectrum graph highlight the apatite signature peak (Figure 3B). Within the ribbon, the interface of plaque and new stone, apatite also predominates, but in an amorphous state giving a broadened band. Above that, at region 1 (Figure 3A), one finds apatite again, like that in plaque; this is already within the stone itself. By region 2 (Figure 3A), well within the stone body, CaOx (at arrowhead) admixes with apatite and by the outermost region, region 3 (Figure 3A), CaOx is alone.
Figure 3. Mineral analysis of attachment site of human kidney stone.
A second stone was removed from another ICSF patient and this stone was processed so that the mineral composition of the stone-plaque interface retained intact so that a precise FTIR analysis could be performed across the interface. The double-doted line in panel A delineates the transition from interstitial plaque to stone. Sites of Randall’s plaque marked by arrows at the lower left side of the panel were confirmed to be composed of hydroxyapatite (lower green arrow in panel B). The region of the interface was composed of amorphous apatite. Region 1 (panel A) was hydroxyapatite while region 2 was a mixture of calcium oxalate and hydroxyapatite. Region 3, a site well within the stone was only calcium oxalate. Immunohistochemistry was used to determine the distribution of osteopontin (panel C) and Tamm-Horsfall protein (panel D) in sites of Randall’s plaque (outlined by a green line) in the tissue, through the interface region (outlined with the double dotted lines) and into the three areas of the stone. Panel C is a serial section to panel A. Note the presence of osteopontin (stained orange) in the interstitial plaque (arrows), interface and all three areas of the stone. Tamm-Horfall protein (stained green) was only found in the stone (arrowheads).
The matrix at the interface contains osteopontin ((Figure 3C) which is in urine and plaque alike and so crosses the interface without discontinuity. Tamm Horsfall protein (THP) present in urine but not renal papillum is in the matrix outside the interface, but not within (Figure 3D). From this we infer that the original plaque exposed to urine was covered over with molecules of urine origin, including THP and osteopontin, crystals formed in it driven by urine supersaturations (SS), among which those for calcium phosphate were paramount, and a ribbon of alternating matrix and crystal resulted. Eventually, urine SS drove enough crystallization to escape from matrix modulation, more apatite formed and CaOx oxalate came to predominate. How and why that crystal transition occurs is not known. One possibility is that the original matrix covering is conditioned by the plaque affinities for urine molecules and later matrix is simply what layers of amorphous apatite attract. Possibly, formation of apatite lowers local pH essentially self extinguishing apatite development so CaOx begins to predominate. This is a crucial area for new research.
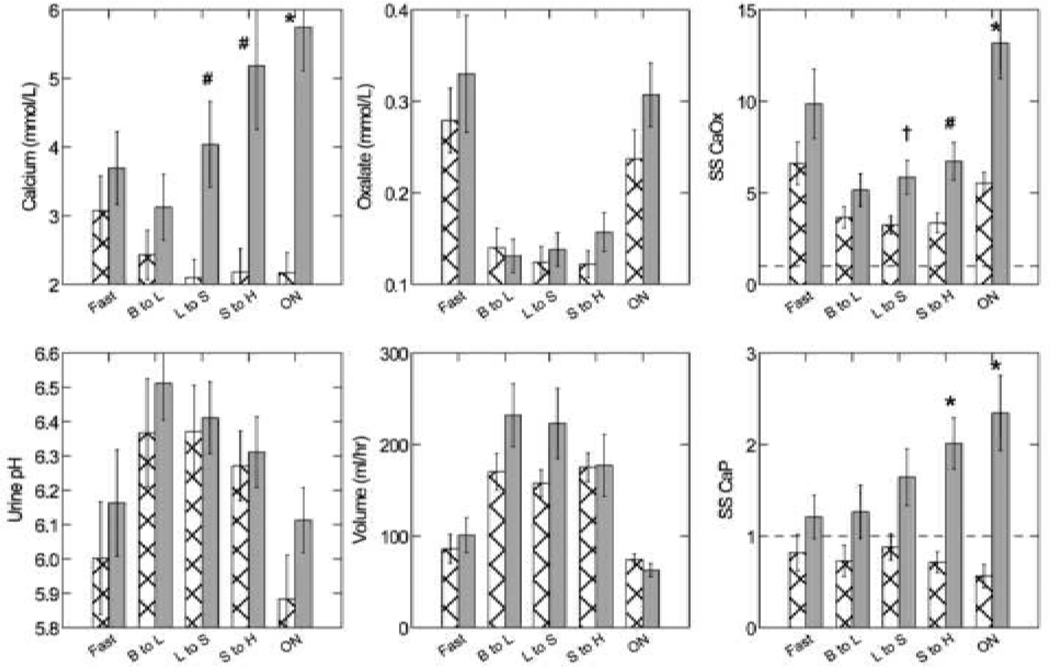
The driving forces must include calcium phosphate as well as CaOx if we are to have the ribbon and the initial phases of a CaOx stone attachment and in fact ICSF have both (Figure 4) [8]. Because they are generally hypercalciuric from IH, ICSF have much higher urine calcium molarities than normals (solid and crosshatch bars, upper left panel), and the difference becomes more marked as day wanes into night. Oxalate molarities, pH, and volume are not different in this diet controlled GCRC day long study. SS CaOx is higher in ICSF than normals, but present in both. SS CaP is not present in N, but is marked in INSF, especially overnight. So, the crystal patterns we observe, apatite initiation followed by CaOx overgrowth could be driven in SF but not well in normals. IH is clearly of paramount importance for apatite, but high urine oxalate could do as well as high calcium for the CaOx component.
Figure 4. Urine Measurements in idiopathic calcium stone formers ICSF).
Urine molarity of calcium (Upper left and middle panels) among ICSF (Grey solid bars) exceed normals (crosshatch) in the intervals from lunch to supper (L to S), supper to home (S to H) and overnight (ON). Oxalate molarity (upper middle panel), urine pH (lower left panel), and urine volumes (lower middle panel) do not differ between groups. SS CaOx and CaP are higher among ICSF vs. normal at multiple periods (+, p<0.05; #, <0.01; *, p<0.001. Note that normals never exhibit SS values above 1 for CaP whereas values above 1 are common among ICSF.
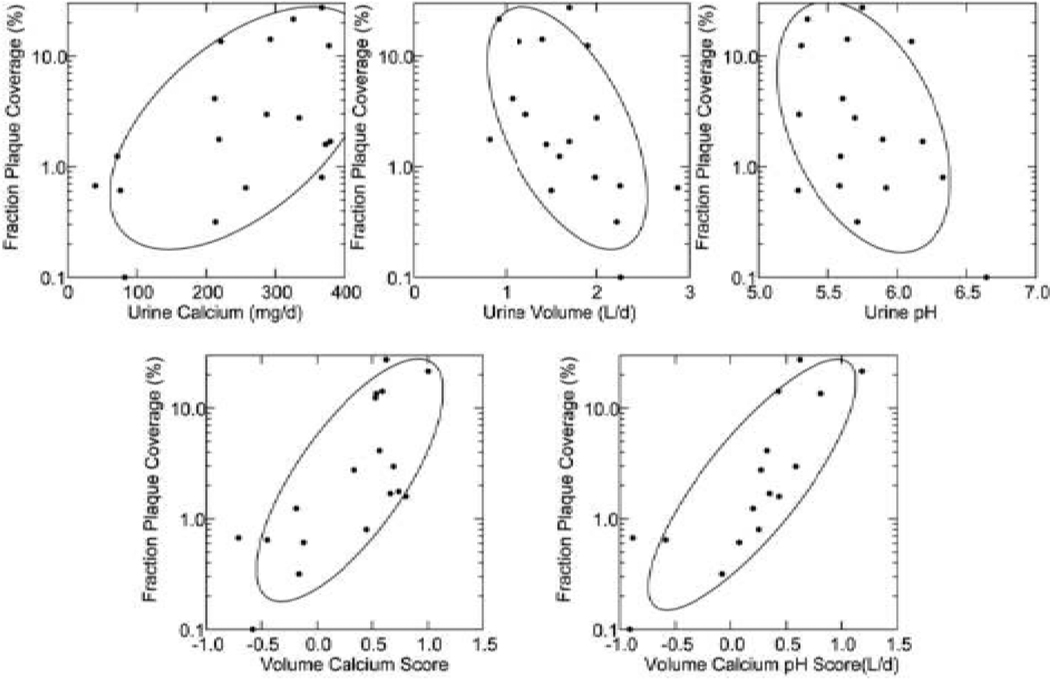
This is all about ICSF; for the other conditions in which CaOx stones grow over plaque we do not have this kind of refined mechanistic analysis. Brushite and hyperparathyroid SF have hypercalciuria and high CaP SS, so the system of overgrowth could proceed. But ileostomy and small bowel resection are acid urine states, so the initial crystal phases may not be apatite; this is a crucial open research question. Plaque itself cannot, of course, be driven from urine SS as it forms within the papillum, and in fact within a basement membrane, so we have to look elsewhere for mechanisms. Our beginning was simply physiology correlations: with what urine measurements, if any, did plaque abundance correlate? For ICSF, normals and obesity bypass SF, plaque abundance, measured as fraction of papillae covered, varies directly with urine calcium excretion (Figure 5, upper left panel) and inversely with urine volume and pH (upper middle and right panels) [9]. Combined multivariate scores which include urine volume, pH and calcium (bottom panels) correlate very well with plaque. From this we deduce that IH, urine acidification and water conservation all play a role, which is not a surprise given the origin of plaque in the thin loops of Henle. Water conservation would naturally raise concentrations of calcium salts along the loop, and acidification of tubule fluid in collecting ducts must raise the pH of the interstitium, so as a first approximation the effects of volume and pH seem accessible to experiment.
Figure 5. Relationship between plaque abundance (Y-Axes of each panel) and urine measurements.
Plaque area is proportional to urine calcium excretion and inverse to volume and pH (upper panels); multivariate scores using calcium and volume or all three variables (lower panels) account for much of the variation in plaque.
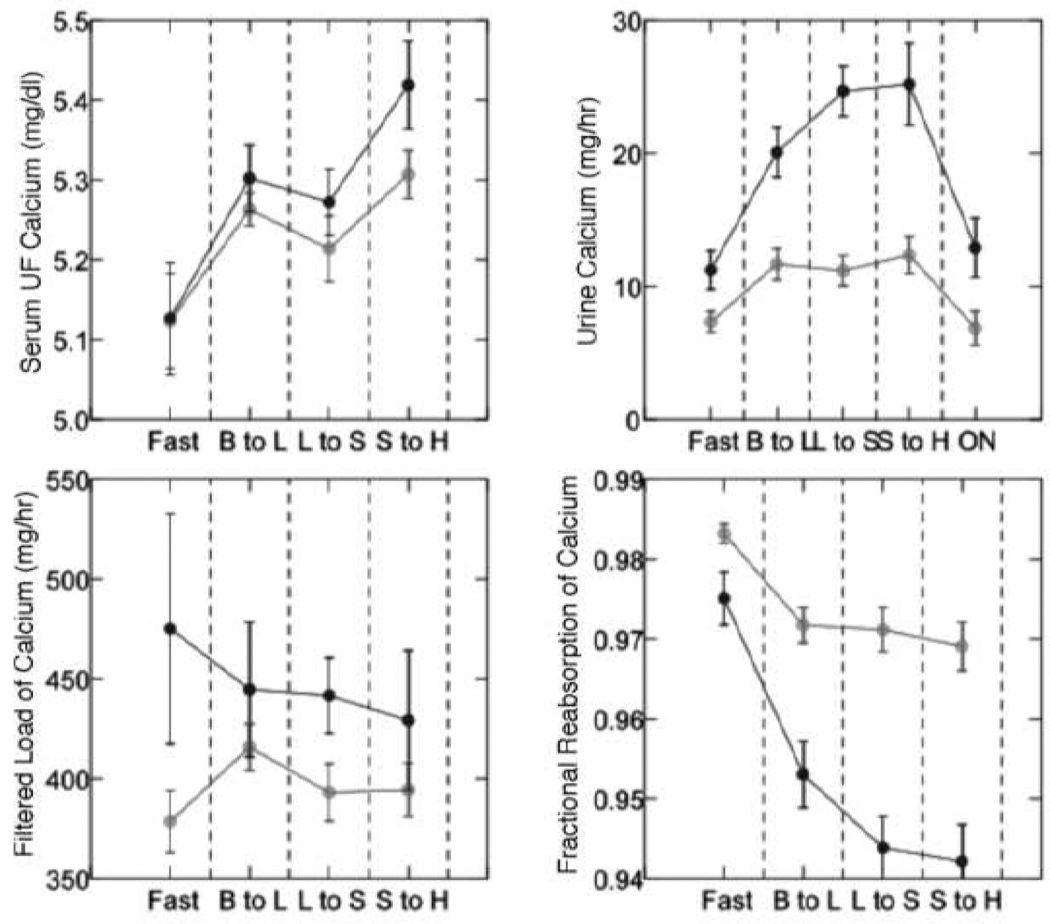
The effects of calcium excretion, which arises from IH in ICSF, are not immediately obvious because the physiology of IH is itself complex and not fully understood. Recent work by our group has shown that the high urine calcium excretion of IH is a mealtime phenomenon: with each meal, fractional renal tubule calcium reabsorption falls (Figure 6 lower right panel) at fixed levels of filtered load and with no difference of ultra-filtrate or serum calcium concentration between IH and normals (Figure 6, remaining panels) [10]. So if IH contributes to plaque, it must do so in part because of the altered tubule function from which it arises.
Figure 6. Evidence for reduced tubule calcium reabsorption in ICSF.
In a CGRC controlled diet three meal day, serum Ultrafiltrate calcium (upper left panel) rose modestly and equally in ICSF (black circles) and normals (Grey circles) after breakfast (B to L) and remained high after lunch (L) and supper (S), but urine calcium rose (upper right panel) above normal throughout the day and overnight (ON) and tubule calcium reabsorption (lower right panel) fell far more in INSF; filtered loads of calcium (lower left panel) did not change in either group.
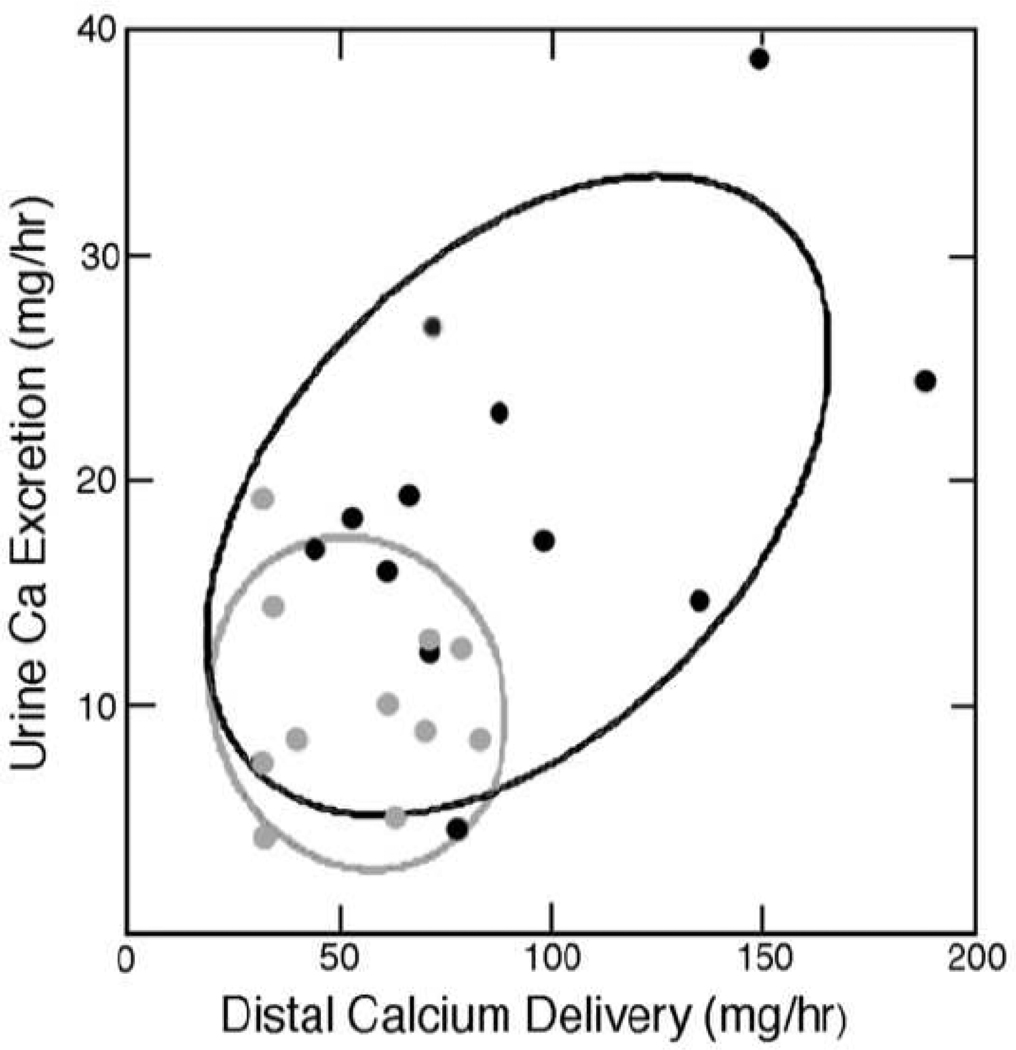
At least the proximal tubule is abnormal in IH (Figure 7). Using endogenous lithium clearance measurements, we found that with meals proximal tubule reabsorption of IH fall far more than in normals so that distal nephron calcium delivery is increased [11]. Urine calcium excretion is in fact roughly proportional to distal delivery as in the figure. Delivery of abnormally large amounts of calcium down the thin limbs and to the thick ascending limb offer possible mechanisms for plaque which are being explored in new research. Links to plaque in the other conditions are not as well established and therefore we do not discuss them here, in this review, at this time.
Figure 7. Relationship between delivery out of proximal tubule and urine calcium excretion.
Distal calcium delivery from proximal tubule estimated by endogenous lithium clearance was higher in ICSF (Black circles) vs. normals (Grey circles) and highest urine calcium excretions corresponded with highest delivery. Each point is a complete study in a single individual.
One might rightly ask for a trial to prove that howsoever attractive our pictures of stone overgrowth, this is indeed the main, or even exclusive mode for stone formation in ICSF. To test this we used a kind of gambler’s experiment: for a series of stones in successive ICSF patients, with no stones excluded from the count, what fraction of stones were found attached, and of those attached, what fraction were attached to plaque [12]? Among 9 patients, 12 kidneys, 115 stones, 90 were found attached; the 25 unattached, incidentally all had residual apatite cores that could have serves as attachment sites. Of the 90, 81 were on plaque as determined at operation and on reviewing intra-operative movies later on. The other 9 were on plaque at surgery but the movies were not clear enough to be sure. From these numbers, using proper mathematics, and allowing for within patient correlation we determined that the true attachment rate had to be at least 75% (95% CI for estimate was 58–93%) and the trial was stopped. Of note, as seen on our figures, plaque occupies no more than 5% of papillary area. Our hypothesis was that growth on or off plaque was equally probable. It was rejected at p<0.05. Had we used the proper figure, that by chance 5% of stones would be on plaque, the trial could have been far smaller. Plaque is clearly a powerful accumulator of stones in that the small fraction of papillary surface covered by plaque accumulates the vast majority of stones; this means they grow there and plaque is essential to their existence.
ICSF are the most pure example of the first pathway. They form their CaOx stones by overgrowth on plaque, driven by urine SS values that are clinically accessible and modifiable. Plaque is itself a reflection of mechanisms that alter urine volume pH and calcium excretion and its formation may be subject to clinical interventions; trials are a worthwhile possibility given ways to measure plaque non- invasively. Since ICSF are very common, the first pathway is probably the main one operating in the usual patient. Of note, plaque is seemingly benign in that tissues around it do not show inflammation or fibrosis. We have made no mention of crystals within tubules because none have thus far been found in ICSF [13]. Perhaps for these reasons, renal function is well preserved in most patients apart from effects of stones, obstructions, instrumentations, and infections.
The Second Pathway: Crystal Deposits in Renal Tubules
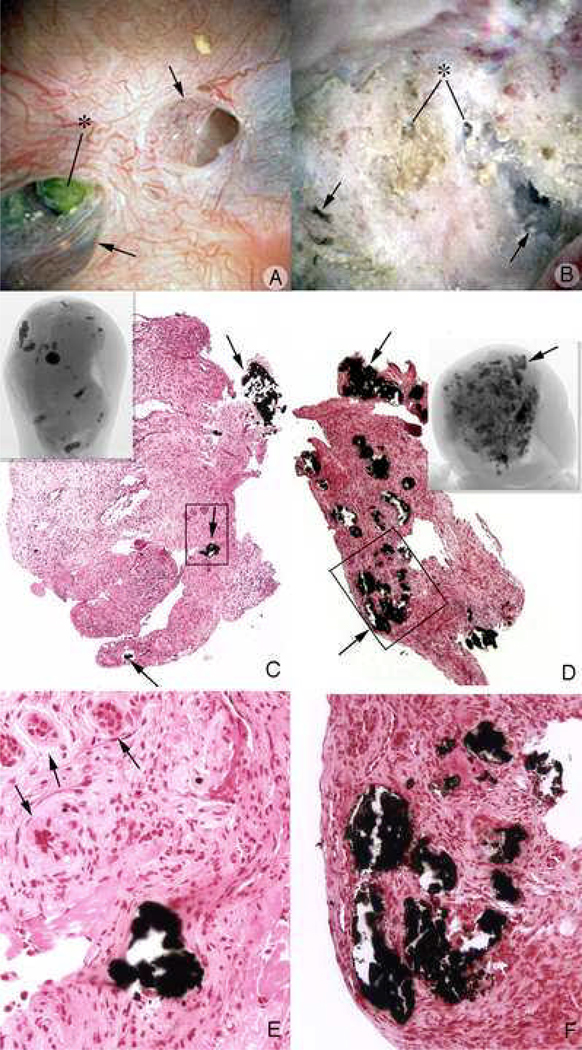
By contrast, all other stone formers are prone to deposit crystals in their tubules and these deposits may be related to stone formation. Brushite stone formers [14] (Figure 8) form apatite deposits in ducts of Bellini (BD) and inner medullary collecting ducts (IMCD) that can massively dilate the duct and even protrude from its mouth into the urinary space (Figure 8A). On biopsy (Figure 8B) the dilated duct has no epithelial cell lining remaining and is surrounded by interstitial fibrosis. Deposits appear as elongate yellow tinted risings beneath the urothelium (Figure 8C, single arrows) easily distinguished from white interstitial plaque (double arrow). Biopsy through the yellow region in the middle upper panel reveals it to be a deposit (Figure 8D, at *) just below the urothelium (at arrow). Biopsy tissue highlights the extensive, though focal, damage one can find (Figures 8E and F). Huge deposits replace epithelial cells and interstitial fibrosis is marked. The full pathogenesis remains a matter of research, presently; crystal mediated injury, reasons for the crystal deposits, and possible role of shock wave lithotripsy – a well established cause of focal papillary injury – all require study.
Figure 8. Endoscopic and histologic observations of brushite stone formers.
Brushite stone formers have unique papillary characteristics in that they possess white and yellow plaque as well as protruding plugs from ducts of Bellini. Although the papilla from brushite stone formers have sites of white plaque (arrows in panel A and double arrow in panel C), the most prominent features are mineral plugs protruding from dilated ducts of Bellini (* in panels A and B) and radially oriented sites of yellow plaque (single arrows in panel C) shown to be localized to inner medullary collecting ducts (*, panel D) just beneath the urothelium (arrow, panel D). Many of the papilla of brushite stone formers are deformed as noted by flattening, large dilated opening to ducts of Bellini (Panel A) and large pits (arrowheads in panel A). Histopathology detected grossly dilated inner medullary collecting ducts and ducts of Bellini filled with mineral deposits (arrows in panel B) shown to be apatite. These dilated tubules were surrounded by interstitial fibrosis. Regions of interstitial plaque were easily found (double arrows, panels B and D). Using light microscopy of 1 micron thick plastic sections of decalcified papillary biopsies, extensive regions of cellular damage with mineralization were seen in inner medullary collecting ducts (arrows, panels E and F) and loops of Henle (*, panel E) adjacent to normal appearing tubular segments (panel E). Extensive interstitial fibrosis is noted around these sites of tubular injury.
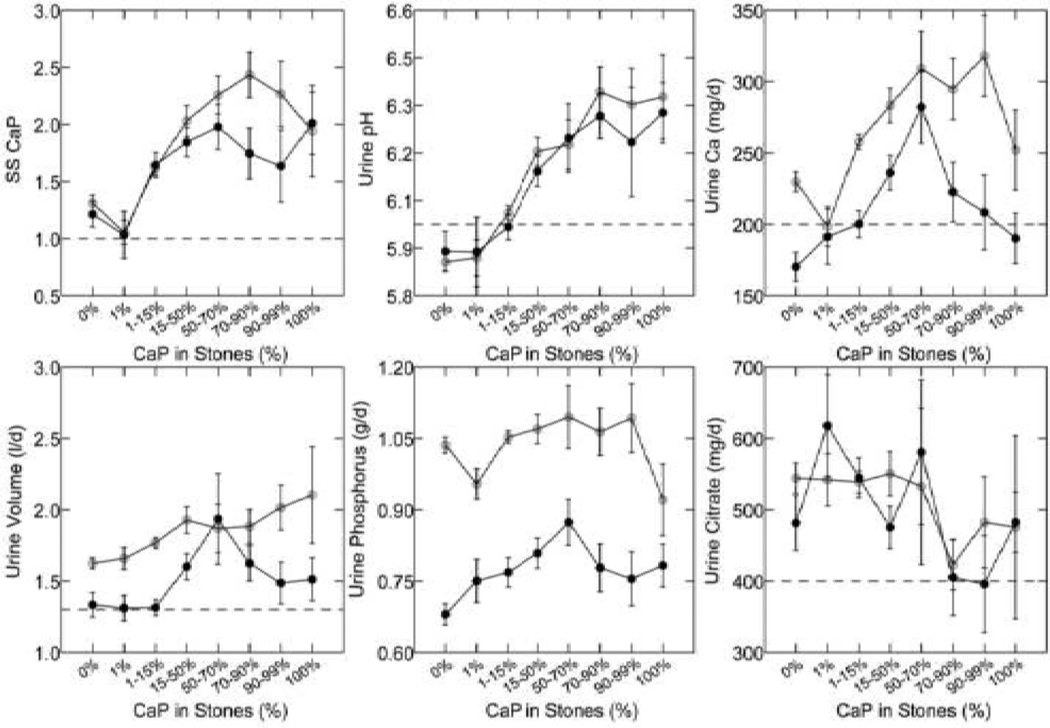
But even now, some elements are clear. Calcium phosphate crystals will form in BD and IMCD more readily as urine CaP SS rises, because tubule fluid in these segments closely tracks the composition of the final urine [15]. As average stone CaP percent rises (X axes of all 6 panels in Figure 9), CaP SS (upper left panel) rises because of increasing urine pH (upper middle panel). Increasing hypercalciuria (upper right panel) plays a less constant role, and changes in urine volume, phosphate excretion and citrate excretion are too variable to have been a consistent cause. So for pathogenesis of BD and IMCD CaP deposits, as for pathogenesis of CaP stones, the mechanism is high SS, itself driven by a higher average urine pH than found in ICSF and we are left with the question of how urine pH is increased.
Figure 9. Urine measurements in ICSF with increasing stone calcium phosphate (CaP) percent.
With increasing percent of CaP in analyzed stones (X-axes of all panels) SS CaP and urine pH (upper left and middle panels) rose progressively, and urine calcium excretion (upper right panel) in a less constant manner. Urine volume, and phosphate and citrate excretions (lower panels) showed no consistent relationship to stone CaP.
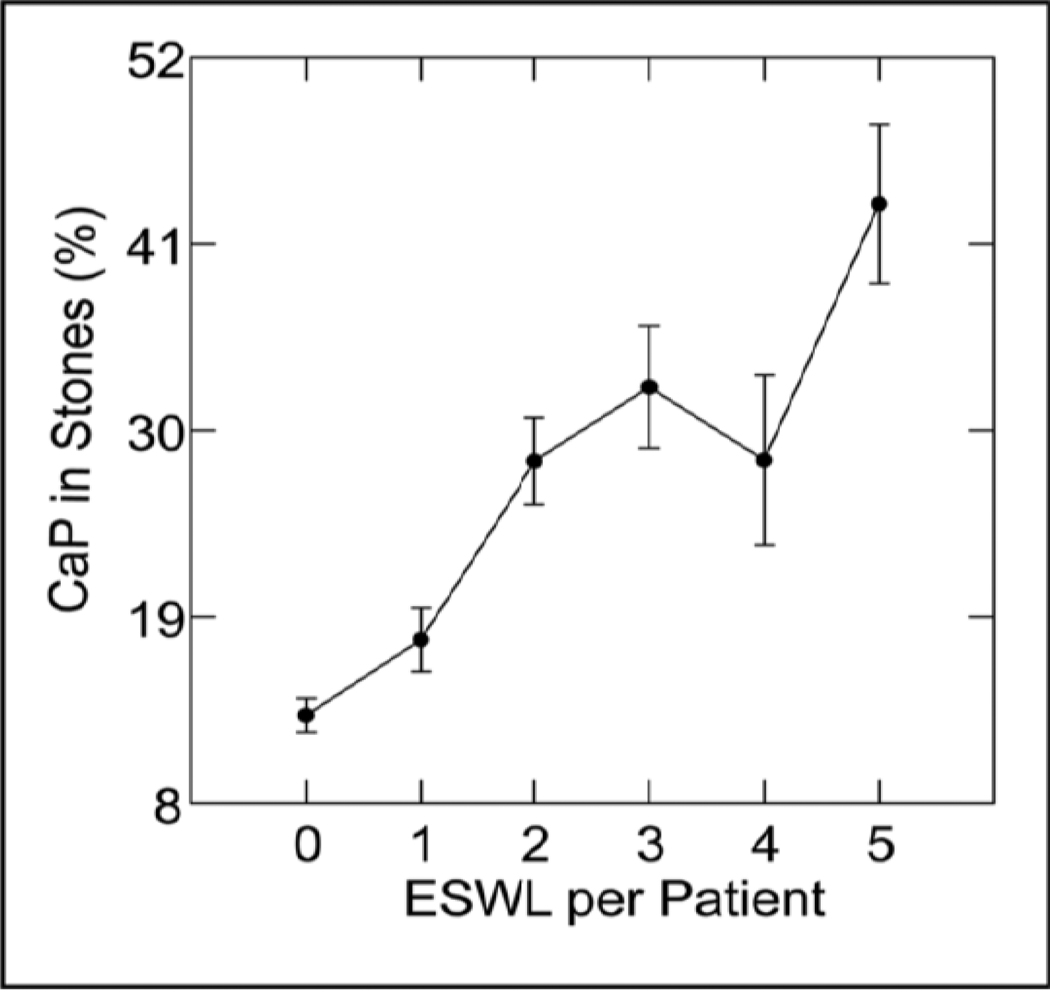
One culprit may be SWL (Figure 10). Looking for covariates of urine pH, we stumbled on SWL, and no amount of correcting for confounders can remove its effects. When stone CaP percent is regressed on number of extra corporeal shock wave lithotripsies (ESWL) and one allows for sex, age, years of stone disease and numbers of stones formed, the relationship is a strong one (Figure 10). This is also true for those patients who convert from CaOx to CaP stones [16]. SWL can surely injure papillae and medulla, so perhaps this modern and valuable treatment for stones has its dark side.
Figure 10. Stone CaP percent vs. extra-corporeal shock wave lithotripsies (ESWL).
Stone CaP% rose with numbers of ESWL procedures after correcting for sex, age, number of stones, and years of stone disease.
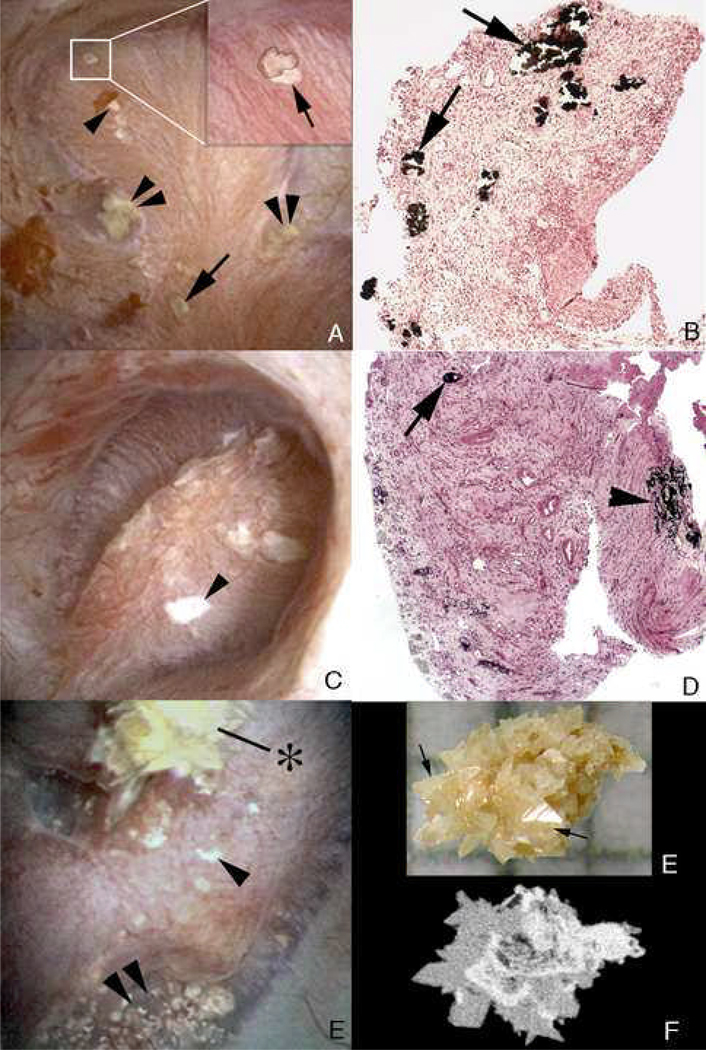
The same pattern of deposits occurs in patients with primary hyperparathyroidism, but in a less pure form [17]. Like brushite SF, these patients produce BD and IMCD deposits that can protrude from the mouths of dilated BD (Figure 11A, arrow) and appear as yellow elongate structures (double arrowheads). But they also produce considerable interstitial apatite plaque (Figure 11A, at single arrowhead; this specific region was the attachment site of a CaOx stone that has been removed. Just above it (in inset box) a CaOx stone remains attached (detailed in blowup box). The massive extent of tubule plugging is seen in biopsy tissue (Figure 11B, arrows). Figure 11C and D illustrate how extensive white plaque (arrowheads) can be as seen endoscopically and on biopsy. Plugging and plaque coexist in nearby regions (arrow shows plugging, arrowheads show plaque in a single biopsy section). By endoscope a large attached CaOx stone resides on a region of white plaque (Figure 11E, *); unoccupied white plaque is scattered about (single arrowhead) and yellow plaque, meaning BD and IMCD deposits, lies just nearby (double arrowheads). The stone (Figure 11F) from Figure 11E, detached, shows, on light microscopy, calcium oxalate dihydrate (COD) planar crystals (arrows) more dramatic in micro – CT analysis (Figure 11G). In the CT image, the brighter streaks are apatite; the sided planar gray is COD. So, in hyperparathyroidism the first and second pathways coexist: CaOx stones grow over apatite interstitial plaque, while nearby, often within a single biopsy sample one finds BD and IMCD plugged with apatite crystals.
Figure 11. Endoscopic and histologic observations of stone formers with primary hyperparathyroidism.
Endoscopic evaluation of papilla from stone formers with primary hyperparathyroidism shows the coexistence of attached stones (panel A, withinwhite box; , panel E) and plugging of ducts of Bellini (panel A, lower single arrow) on the same papilla. In additions, regions of white plaque (arrowhead, panels A, C and E) and yellow plaque double arrowheads, panels A and E) were also seen on the same papilla. Histopathology of the papillary biopsies showed extensive regions of intratubular plugging of inner medullary collecting ducts and ducts of Bellini (arrows, panels B and D) with areas of interstitial plaque (arrowhead, panel D). Extensive interstitial fibrosis surrounded the plugged tubular segments. Panel E shows an attached calcium oxalate stone (*) before while panel E shows it after detachment. Micro-CT analysis of this same stone (panel F) reveals a mixture of apatite (white regions) and calcium oxalate dihydrate (gray regions).
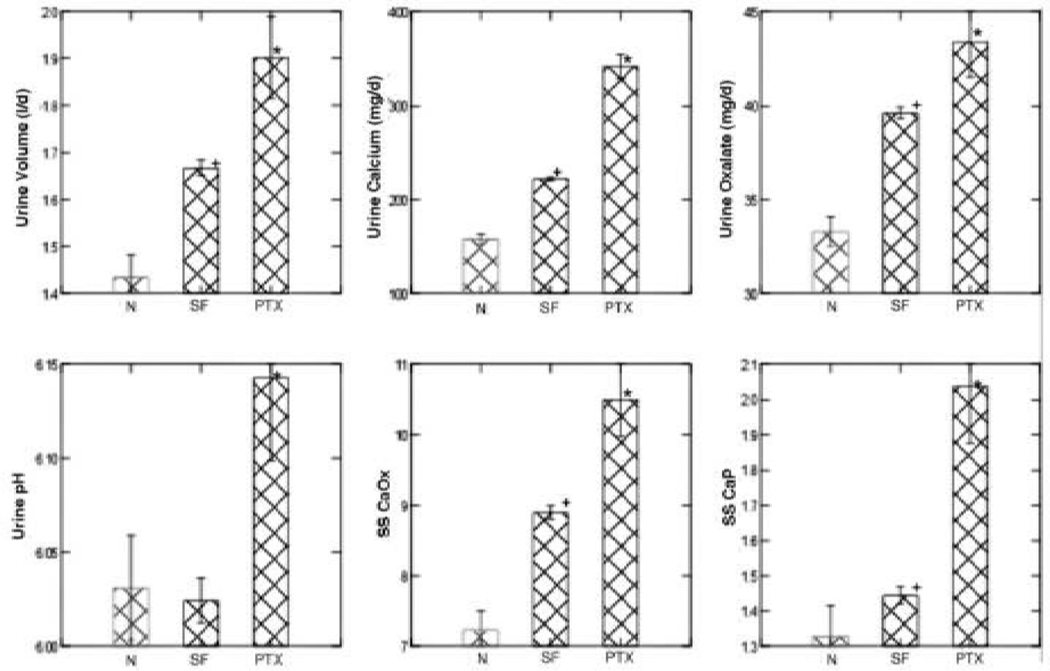
How the plugging occurs is not too mysterious given what we have already said about brushite patients. Compared to normals (Figure 12, left hand bars of each panel), and to ICSF (middle bars of each panel) urine volume, calcium, oxalate, but especially pH is high, so that SS CaOx and CaP are higher even than in ICSF [18]. One would expect CaOx and CaP stones, and that is what one finds. In fact, in our biopsied cases, collected stones were mainly CaP, even though we clearly documented small attached CaOx stones on papillae. Even how urine calcium and volume and pH get this abnormal is not a mystery given the pathophysiology of primary hyperparathyroidism, but this review must have boundaries, and we simply, at this point, direct the reader to standard textbook sources.
Figure 12. Urine abnormalities in primary hyperparathyroid stone formers (PTX).
Compared to ICSF and normals (SF and N on X axes of all panels) PTX showed higher urine volume, calcium and oxalate excretion, and especially urine pH and SS CaP. This was true even though the main bulk of stone mineral in this series was CaOx. *, differs from N and SF, p<0.01; +, differs from N, p<0.01.
Perhaps the most extreme of the high pH CaP stone forming states is renal tubular acidosis, in which urine pH cannot be lowered substantially below that of blood and CaP SS is perpetually high. All tubules are involved via either heredity or such diseases as Sjogren’s syndrome. Papillae show multiple dilated BD (Figures 13A and B, arrows) and deposits within BD (*) [19]. Distortion, flattening and fibrosis are evident. The extent of scarring and deposit formation is evident by biopsy and micro-CT analysis (Figures 13 C and D; deposits at arrows). At higher magnification (Figures 13 E and F) the extent of fibrosis is highlighted. Atrophic remnants of nephron structures lie within fibrotic fields of interstitium. White plaque is not present above normal values, and attached CaOx stone have not been found.
Figure 13. Endoscopic and histologic observations of stone formers with renal tubular acidosis.
Stone patients with renal tubular acidosis had normal papilla apart from an occasional dilated duct of Bellini (arrows, panel A) to severely flattened and fibrotic with pitted appearance (arrow, panel B). These papilla possess multiple dilated ducts of Bellini, some with protruding mineral plugs (*, panels A and B). Histopathlogy and micro-CT imagery shows a range of abnormalities. Plugging of inner medullary collecting ducts varied from minimal in number of tubules involved and size of deposits (arrows, panel C) with some interstitial fibrosis (arrows, panel E), to extensive plugging (arrows, panel D), loss of tubular cells and dense cuffs of fibrotic tissue (arrows, panel F).
At this point, an astute observer might ask exactly how CaP stones form. In brushite, hyperparathyroid and RTA SF we observe CaP stones readily, and also massive amounts of CaP deposits, but do we see the stones growing as extensions of the deposits? Randall said he did see this, and called this ‘Type 2’ deposition; but we do not see the phenomenon except rarely. What we find is CaP stones free in the renal pelvis and among the calyces. We don’t know, in other words, how the stones form. Clearly the pathways to crystallization are not those of ICSF, so we are right in naming this a second pathway, but we are, when faced with the obvious question, silent.
The Third Pathway: Free Solution Crystallization
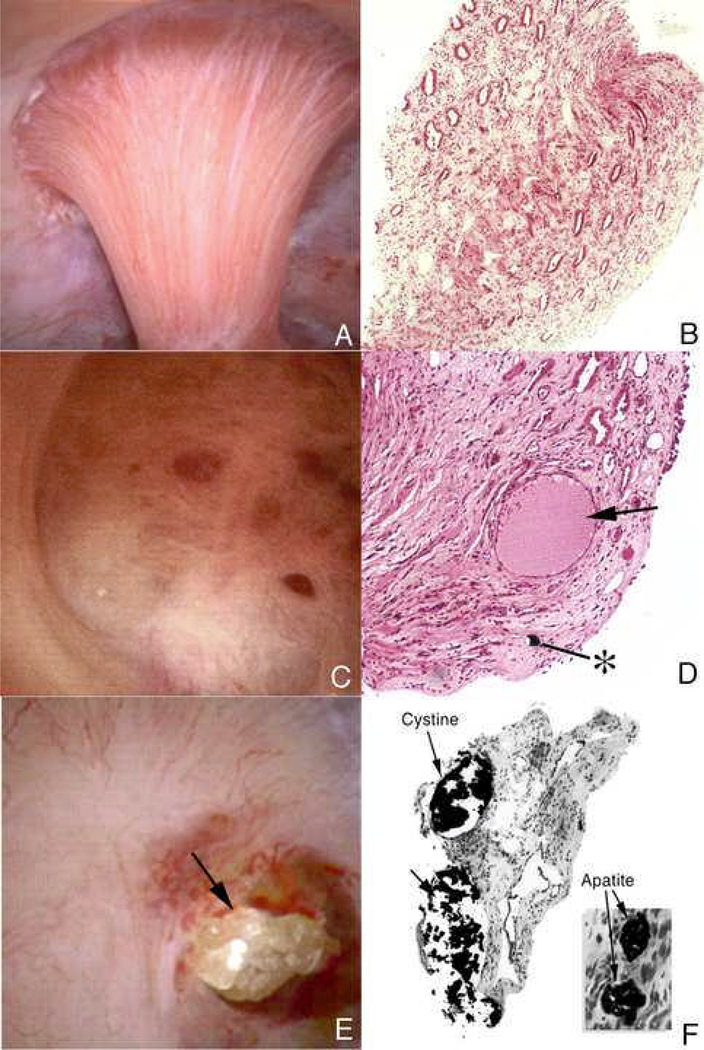
Perhaps the least controversial example must be cystinuria [20]. Huge numbers of stones, often themselves large enough to fill the renal pelvis form because cystine is poorly soluble and excreted in very excessive amounts that supersaturate the urine. One expects to find, and indeed does find that stones are free in the renal pelvis and never attached. The papillae range from normal (Figures 14 A and B) to mildly or markedly involved with BD and IMCD plugging (Figures 14 C and D). As expected, BD plugs often contain cystine (Figures 14 E and F). Unlike apatite plugs, cystine plugs could never anchor stones because they are themselves mobile and slip out easily at surgery. Sometimes they grow to very large size (Figures 14 E and F) and dilate ducts markedly, but when exposed surgically the crystals wash away. Unexpectedly, apatite deposits also form (Figures 14C–F); usually these are in IMCD, not BD, and cystine is found in BD, not IMCD. Some apatite has also been found in thin limbs, a site not involved in the other states we have described thus far. Of note, BD dilation is quite striking, and dilated IMCD filled with cast material (Figure 14D, *) can be found surrounded by fibrotic interstitium.
Figure 14. Endoscopic and histologic observations of stone formers with cystinuria.
Papillary morphology varied in these patients with some appearing normal (panel A) to distorted with flattening and greatly dilated opening of ducts of Bellini (panel C). Protruding plugs of cystine were noted in some dilated ducts (arrow, panel E). Histopathology confirmed the observations seen by endoscopy, in that, tissues form papillary biopsies appeared normal (panel B) to abnormal characterized by extensive inner medullary plugging with (panel F) and without mineral deposits (panel D). An occasional mineral plug was noted in loops of Henle (*, panel D). Intraluminal plugs of the ducts of Bellini were primarily cystine in nature while deposits in inner medullary and loops of Henle were always apatite (panel F).
We believe, and most will agree, that cystine merely crystallizes, in urine, in BD, and causes stones and BD plugging. Physicians treat this disease with alkali loading to raise urine pH and dissolve cystine, and perhaps promote apatite deposits. Urine pH of cystinuric patients runs high even without alkali treatment [21] perhaps because of BD plugging and secondary acidification defects. But in the main this is an example of the third pathway and is important, perhaps, mostly because it illustrates that even the most simplified mechanisms for crystallization can lead to complex secondary events such as apatite deposits and considerable papillary disease.
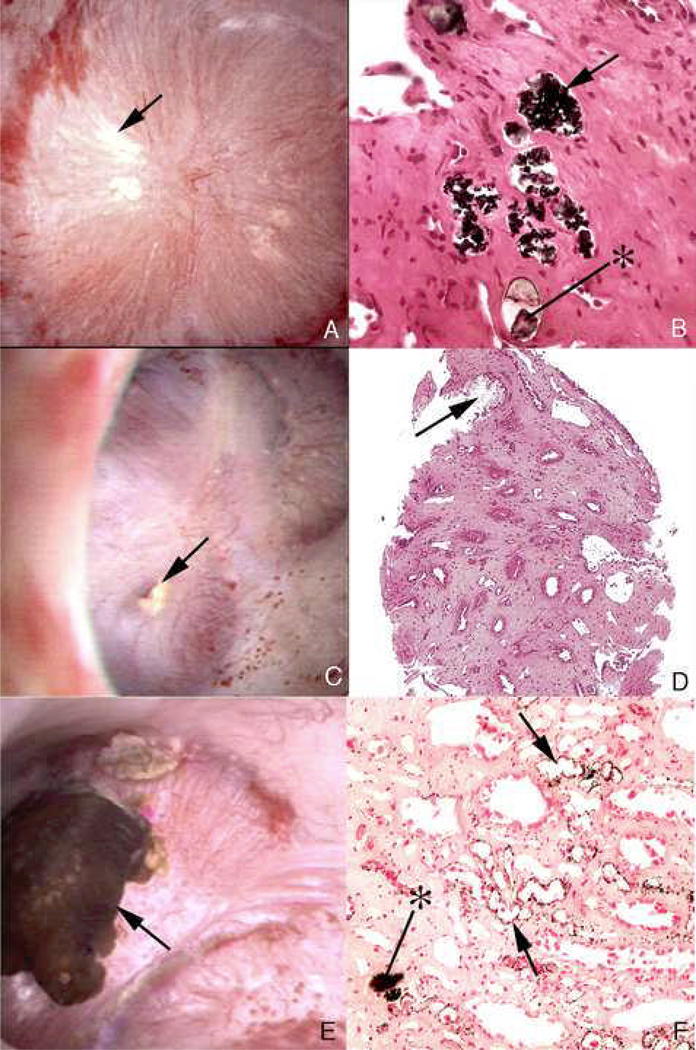
Ileostomy and colectomy with pouch are states of persistent acid urine and stones are COM and uric acid [22]. The stones are found, for the most part, free in the urinary system, and one is led to suspect that at least the uric acid component would form much as in cystinuria: an organic poorly soluble molecule in large amounts crystallizing in free solution. But this disease has a very complex tissue reflection [23]. Although at surgery the main impression is of many free stones, one can easily find white plaque (Figure 15A, arrow) with CaOx stones growing on it (Figure 15E). Uric acid itself, although uric acid stones form in these patients and urine has uric acid SS, is not found in BD or IMCD; instead one finds plugs of the sodium and ammonium salts of uric acid (Figures 15C and D), which form at higher pH levels (above 6) along with apatite (Figures 15B and F), which forms at an even higher pH.
Figure 15. Endoscopic and histologic observations of ileostomy patients with stones.
Papillary morphology as observed by endoscopy varied from a normal conical shape (panel A) to flattened and retracted (panel C). Papilla show areas of white plaque (arrow, panel A), plugs in opening of ducts of Bellini, (arrow, panel C) and attached stones (arrow, panel E). Histopathology revealed intraluminal plugs of apatite in dilated inner medullary collecting ducts (arrows, panels B and F), those with a mixture of apatite and sodium acid urate/ammonium acid urate (*, panel B) while others had only sodium acid urate/ammonium acid urate (arrow, panel D). Some biopsy sections contained large amounts of interstitial plaque (arrows, panel F).
How do urates and apatite form in the tubules? One cannot simply say the tubule fluid differs from urine in pH without meaning that somehow tubule acidification is deranged, that in some IMCD and BD tubule fluid is not acidified properly whereas in the bulk of tubules it is – leading to the low bulk phase urine pH. Spotty ‘renal tubular acidosis’ at a tubular level is not a recognized clinical entity, but we believe it must exist in this condition.
So, like cystinuria, ileostomy has elements of free solution stone formation in the uric acid component and perhaps some CaOx, but is complicated. A few, but clearly very few CaOx stones grow on white plaque – the first pathway. Tubules are plugged with crystals that are not stable at the measured pH the patients produce, so second pathway is engendered, perhaps via focal tubule acidification defects. In other words, this condition exhibits all three pathways at once – or seems to. Much research is needed here.
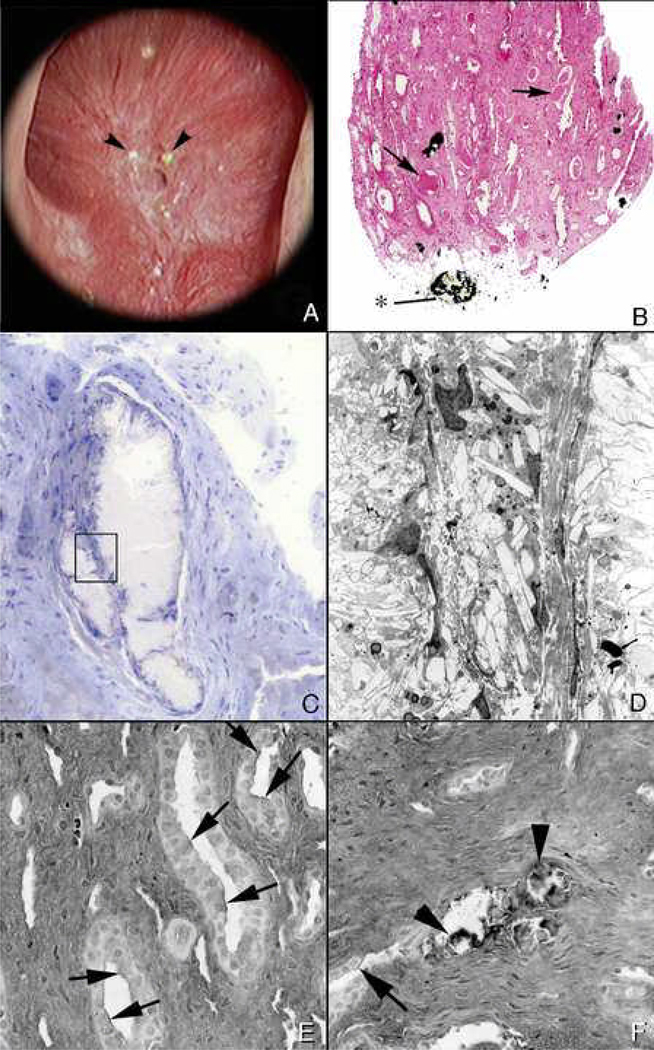
Patients with the now obsolete obesity bypass procedure, and those with the new bariatric surgeries form CaOx stones that are round and never attached to white plaque – free in the renal pelvis. White plaque is itself very minimal [4]. In bypass patients, scattered IMCD contain small apatite plugs, even though urine pH is low; this is presumably a minor version of what we find in ileostomy: focal nephron limited renal acidification defects. Urates are never present. Yellow plaque (Figure 16A, arrowheads) is easily seen, surrounding a dilated BD. Biopsy (Figure 16B) reveals plugs and dilated IMCD with cast material (Figure 16B, arrows); a protruding plug in a BD is at *. Plugs are apatite and can dilate ducts and destroy epithelium (Figures 16C and D). Hyaluronan expression, a marker for cell injury, is increased in bypass patients (Figure 16E, arrows) not associated with crystals, and also where crystals are present (Figure 16F at arrowheads) [13]. The general increase of hyaluronan is never seen in ICSF and has not been looked for in other diseases; it presumably marks an otherwise unrecognized injury that could perhaps be part of the mechanism for apatite deposits, for after all they must form because of abnormal acidification and some cause of the abnormality must be presumed.
Figure 16. Endoscopic and histologic observations of stone patients with bypass surgery for obesity.
Endoscopic observations revealed normal appearing papilla except for an occasional dilated opening of a duct of Bellini with adjacent nodular-appearing structures (arrowheads, panel A). Histopathogy shows an occasional intraluminal deposit in an inner medullary collecting duct and plugs in the ducts of Bellini (*, panel B). A few dilated inner medullary collecting ducts possessed cast material and regions of fibrosis (arrows, panel B). At a higher magnification (panel C), a site of intraluminal plugging reveals a loss of tubular lining cells and cuffs of interstitial fibrosis. A region within panel C (see rectangle) is further magnified in panel D with transmission electron microscopy. There is a complete loss of cellular detail. Biopsy sections from stone patients with bypass surgery for obesity were also stained for hyaluronan to detect sites of cellular injury. A number of inner medullary collecting ducts with (arrowheads, panel F) and without mineral deposits showed focal regions of hyaluronan staining of their apical cell membranes (arrows, panels E and F).
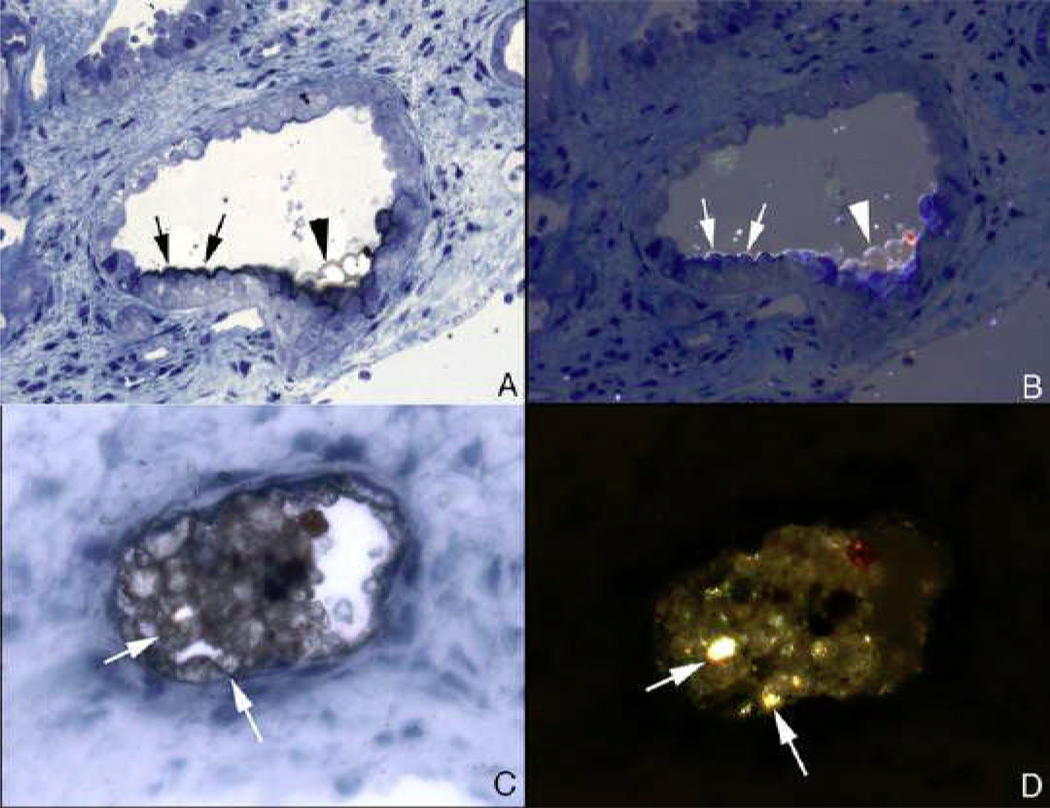
Bypass is a hyperoxaluric state, and stones are CaOx. For this reason we exerted ourselves scanning everywhere with oil immersion polarization light microscopy looking for birefringent crystals, and found traces of them as a kind of scrim (Figures 17A and B) over occasional IMCD cells otherwise normal appearing, and in a part of a several deposits otherwise non – birefringent (Figure 17C and D) [13]. We presume therefore that some CaOx crystals lodge in IMCD, perhaps mediating cell injury. This is an unexplored problem to date.
Figure 17. Birefringent and nonbirefringent crystals in inner medullary collecting ducts of stone patients with bypass surgery for obesity.
Panels A and B show serial sections of a inner medullary collecting duct stained by the Yasue method and viewed direct (panel A) and with polarized light (panel B). The inner medullary collecting duct cells seen in panel A are coated with a thin black layer (arrows) that represent areas of calcium deposits. At the arrowhead is a thin region through apical cell surfaces in which the black overlay on the cells is particularly clear. By polarizing light (panel B) the overlay is birefringent suggesting the mineral is calcium oxalate while the rest of the nonbirefringent material is apatite. Panels C and D show another inner medullary collecting duct seen in serial sections by direct (panel C) and polarized light (panel D). The intraluminal plug that partial fills the tubular lumen was stained by Yasue and shows small sites of Yasue negative staining (arrows, panel C) which are birefringent with polarizing optics (arrows, panel D) suggesting the presences of two minerals as seen in panels A and B.
Some Final Words
Much of the time, in doing our investigations, we feel like a tiny band of archeologists unearthing buried and mysterious ruins filled with the damaged remnants of an unknown violence. Ultimately we must presume everything we find begins with crystallization, and crystals, being what they are, form because of supersaturations. But we are at the very beginning of a real understanding of just what these supersaturations are in specific renal locales, and how they might be produced. Like ancient wars they will yield up their secrets and for the moment we must be content with what we have by way knowledge, and hope to continue studying this strange biology of crystal mediated disease.
Reference List
- 1.Evan A, Lingeman J, Coe FL, Worcester E. Randall's plaque: pathogenesis and role in calcium oxalate nephrolithiasis. Kidney Int. 2006;69:1313–1318. doi: 10.1038/sj.ki.5000238. [DOI] [PubMed] [Google Scholar]
- 2.Matlaga BR, Williams JC, Jr, Kim SC, Kuo RL, Evan AP, Bledsoe SB, Coe FL, Worcester EM, Munch LC, Lingeman JE. Endoscopic evidence of calculus attachment to Randall's plaque. J Urol. 2006;175:1720–1724. doi: 10.1016/S0022-5347(05)01017-7. [DOI] [PubMed] [Google Scholar]
- 3.Randall R. Papillary pathology as precursor of primary renal calculus. Journal of Urology. 1940;44:580–589. [Google Scholar]
- 4.Evan AP, Lingeman JE, Coe FL, Parks JH, Bledsoe SB, Shao Y, Sommer AJ, Paterson RF, Kuo RL, Grynpas M. Randall's plaque of patients with nephrolithiasis begins in basement membranes of thin loops of Henle. J Clin.Invest. 2003;111:607–616. doi: 10.1172/JCI17038. [DOI] [PMC free article] [PubMed] [Google Scholar]
- 5.Evan AP, Coe FL, Rittling SR, Bledsoe SM, Shao Y, Lingeman JE, Worcester EM. Apatite plaque particles in inner medulla of kidneys of calcium oxalate stone formers: osteopontin localization. Kidney Int. 2005;68:145–154. doi: 10.1111/j.1523-1755.2005.00388.x. [DOI] [PubMed] [Google Scholar]
- 6.Evan AP, Bledsoe S, Worcester EM, Coe FL, Lingeman JE, Bergsland KJ. Renal inter-alpha-trypsin inhibitor heavy chain 3 increases in calcium oxalate stone-forming patients. Kidney Int. 2007;72:1503–1511. doi: 10.1038/sj.ki.5002569. [DOI] [PubMed] [Google Scholar]
- 7.Evan AP, Coe FL, Lingeman JE, Shao Y, Sommer AJ, Bledsoe SB, Anderson JC, Worcester EM. Mechanism of formation of human calcium oxalate renal stones on Randall's plaque. Anat.Rec.(Hoboken.) 2007;290:1315–1323. doi: 10.1002/ar.20580. [DOI] [PubMed] [Google Scholar]
- 8.Bergsland KJ, Coe FL, Gillen DL, Worcester EM. A test of the hypothesis that the collecting duct calcium-sensing receptor limits rise of urine calcium molarity in hypercalciuric calcium kidney stone formers. Am J Physiol Renal Physiol. 2009;297:F1017–F1023. doi: 10.1152/ajprenal.00223.2009. [DOI] [PMC free article] [PubMed] [Google Scholar]
- 9.Kuo RL, Lingeman JE, Evan AP, Paterson RF, Parks JH, Bledsoe SB, Munch LC, Coe FL. Urine calcium and volume predict coverage of renal papilla by Randall's plaque. Kidney Int. 2003;64:2150–2154. doi: 10.1046/j.1523-1755.2003.00316.x. [DOI] [PubMed] [Google Scholar]
- 10.Worcester EM, Gillen DL, Evan AP, Parks JH, Wright K, Trumbore L, Nakagawa Y, Coe FL. Evidence that postprandial reduction of renal calcium reabsorption mediates hypercalciuria of patients with calcium nephrolithiasis. Am.J Physiol Renal Physiol. 2007;292:F66–F75. doi: 10.1152/ajprenal.00115.2006. [DOI] [PubMed] [Google Scholar]
- 11.Worcester EM, Coe FL, Evan AP, Bergsland KJ, Parks JH, Willis LR, Clark DL, Gillen DL. Evidence for increased postprandial distal nephron calcium delivery in hypercalciuric stone-forming patients. Am.J Physiol Renal Physiol. 2008;295:F1286–F1294. doi: 10.1152/ajprenal.90404.2008. [DOI] [PMC free article] [PubMed] [Google Scholar]
- 12.Miller NL, Gillen DL, Williams JC, Jr, Evan AP, Bledsoe SB, Coe FL, Worcester EM, Matlaga BR, Munch LC, Lingeman JE. A formal test of the hypothesis that idiopathic calcium oxalate stones grow on Randall's plaque. BJU.Int. 2009;103:966–971. doi: 10.1111/j.1464-410X.2008.08193.x. [DOI] [PMC free article] [PubMed] [Google Scholar]
- 13.Evan AP, Coe FL, Gillen D, Lingeman JE, Bledsoe S, Worcester EM. Renal intratubular crystals and hyaluronan staining occur in stone formers with bypass surgery but not with idiopathic calcium oxalate stones. Anat.Rec.(Hoboken.) 2008;291:325–334. doi: 10.1002/ar.20656. [DOI] [PubMed] [Google Scholar]
- 14.Evan AP, Lingeman JE, Coe FL, Shao Y, Parks JH, Bledsoe SB, Phillips CL, Bonsib S, Worcester EM, Sommer AJ, Kim SC, Tinmouth WW, Grynpas M. Crystal-associated nephropathy in patients with brushite nephrolithiasis. Kidney Int. 2005;67:576–591. doi: 10.1111/j.1523-1755.2005.67114.x. [DOI] [PubMed] [Google Scholar]
- 15.Parks JH, Worcester EM, Coe FL, Evan AP, Lingeman JE. Clinical implications of abundant calcium phosphate in routinely analyzed kidney stones. Kidney Int. 2004;66:777–785. doi: 10.1111/j.1523-1755.2004.00803.x. [DOI] [PubMed] [Google Scholar]
- 16.Parks JH, Coe FL, Evan AP, Worcester EM. Urine pH in renal calcium stone formers who do and do not increase stone phosphate content with time. Nephrol.Dial.Transplant. 2009;24:130–136. doi: 10.1093/ndt/gfn420. [DOI] [PMC free article] [PubMed] [Google Scholar]
- 17.Evan AE, Lingeman JE, Coe FL, Miller NL, Bledsoe SB, Sommer AJ, Williams JC, Shao Y, Worcester EM. Histopathology and surgical anatomy of patients with primary hyperparathyroidism and calcium phosphate stones. Kidney Int. 2008;74:223–229. doi: 10.1038/ki.2008.161. [DOI] [PubMed] [Google Scholar]
- 18.Parks JH, Coe FL, Evan AP, Worcester EM. Clinical and laboratory characteristics of calcium stone-formers with and without primary hyperparathyroidism. BJU.Int. 2009;103:670–678. doi: 10.1111/j.1464-410X.2008.08064.x. [DOI] [PubMed] [Google Scholar]
- 19.Evan AP, Lingeman J, Coe F, Shao Y, Miller N, Matlaga B, Phillips C, Sommer A, Worcester E. Renal histopathology of stone-forming patients with distal renal tubular acidosis. Kidney Int. 2007;71:795–801. doi: 10.1038/sj.ki.5002113. [DOI] [PubMed] [Google Scholar]
- 20.Evan AP, Coe FL, Lingeman JE, Shao Y, Matlaga BR, Kim SC, Bledsoe SB, Sommer AJ, Grynpas M, Phillips CL, Worcester EM. Renal crystal deposits and histopathology in patients with cystine stones. Kidney Int. 2006;69:2227–2235. doi: 10.1038/sj.ki.5000268. [DOI] [PubMed] [Google Scholar]
- 21.Sakhaee K, Poindexter JR, Pak CY. The spectrum of metabolic abnormalities in patients with cystine nephrolithiasis. J Urol. 1989;141:819–821. doi: 10.1016/s0022-5347(17)41019-6. [DOI] [PubMed] [Google Scholar]
- 22.Parks JH, Worcester EM, O'Connor RC, Coe FL. Urine stone risk factors in nephrolithiasis patients with and without bowel disease. Kidney Int. 2003;63:255–265. doi: 10.1046/j.1523-1755.2003.00725.x. [DOI] [PubMed] [Google Scholar]
- 23.Evan AP, Lingeman JE, Coe FL, Bledsoe SB, Sommer AJ, Williams JC, Jr, Krambeck AE, Worcester EM. Intra-tubular deposits, urine and stone composition are divergent in patients with ileostomy. Kidney Int. 2009 doi: 10.1038/ki.2009.321. [DOI] [PMC free article] [PubMed] [Google Scholar]


