

Abstract
Developing Dictyostelium cells form large aggregation streams that break up into groups of 0.2 × 10⁵ to 1 × 10⁵ cells. Each group then becomes a fruiting body. smlA cells oversecrete an unknown factor that causes aggregation streams to break up into groups of ∼5 × 10³ cells and thus form very small fruiting bodies. We have purified the counting factor and find that it behaves as a complex of polypeptides with an effective molecular mass of 450 kD. One of the polypeptides is a 40-kD hydrophilic protein we have named countin. In transformants with a disrupted countin gene, there is no detectable secretion of counting factor, and the aggregation streams do not break up, resulting in huge (up to 2 × 10⁵ cell) fruiting bodies.
Keywords: Cell number, cell counting, tissue size, diffusion
Very little is known about how a group of cells or a tissue senses the number of cells in it or its absolute size. An excellent system to study processes such as cell counting and size determination is the simple eukaryote Dictyostelium discoideum. Dictyostelium normally exists as a single cell that eats bacteria on soil surfaces and increases in number by fission. When a cell starves, it signals that it is starving by slowly secreting a cell-density sensing factor, the glycoprotein CMF (Mehdy et al. 1985; Gomer et al. 1991; Jain et al. 1992; Jain and Gomer 1994; Yuen and Gomer 1994; Yuen et al. 1995). As more and more cells in a 1 to 10 mm diameter area of soil starve, the concentration of CMF increases. When there is a high density of starving cells and thus a high concentration of CMF, the cells aggregate by use of relayed pulses of cAMP as a chemoattractant (for review, see Robertson and Grutsch 1981). Starving cells also secrete a phosphodiesterase and a phosphodiesterase inhibitor; the phosphodiesterase causes the levels of cAMP to return to a baseline level in the interval between pulses (Riedel and Gerisch 1971; Dicou and Brachet 1979; Kessin et al. 1979; Tsang and Coukell 1979; Franke and Kessin 1981; Orlow et al. 1981; Faure et al. 1988, 1989; Hall et al. 1993; Wu et al. 1995) and also steepens the cAMP gradient sensed by the cell (Nanjundiah and Malchow 1976). The aggregate forms a migrating slug, which, in turn, forms a fruiting body containing a mass of spore cells supported by a column of stalk cells (for review, see Loomis 1975, 1993; Devreotes 1989; Schaap 1991; Firtel 1995).
The function of the fruiting body is to hold the spore mass as high off the ground as possible, for optimal spore dispersal. Thus, there is a strong selective pressure to have a large number of cells in the fruiting body. However, there is a limit to the strength of both the stalk and the attachment of the spore mass to the top of the stalk, so that if there are too many cells in a fruiting body, the fruiting body will fall over or the spore mass will slide down the stalk. Because spores on the ground will probably not get dispersed, there is a strong selective pressure to have an upper limit on the number of cells in a fruiting body. Therefore, in a field of starving Dictyostelium, the slugs are usually of approximately the same size. Depending on the plating density, slugs contain 2 × 10⁴ to 1 × 10⁵ cells (Bonner and Hoffman 1963).
There are many Dictyostelium mutants with an abnormal aggregate size (Sussman and Sussman 1953; Hohl and Raper 1964; Gerisch 1968). Once aggregate size is determined, later events may alter fruiting body size and number. Overexpression of the gp80 adhesion protein causes aggregation streams to break up and form small fruiting bodies (Faix et al. 1992). In Streamer F cells, which lack the cGMP-specific phosphodiesterase, the aggregation streams do not break up (Newell and Liu 1992). A mutant described by Sussman and Sussman (1953), bushy, makes aggregates of normal size, but then the slug breaks up into many tiny fruiting bodies. There also exist species of Dictyostelium that form large aggregates, which then break up into a bouquet of small fruiting bodies (for review, see Schaap 1986). Overexpression of a modified ras gene or disruption of a MEK also cause this phenotype (Reymond et al. 1986; Ma et al. 1997).
Hohl and Raper (1964) examined several small-aggregate mutant strains of D. discoideum and found that the phenotypes were due to disruption of either of two different mechanisms. The first mechanism is aggregation, and mutants with defective aggregation could be rescued by crowding the cells together so that aggregation became unnecessary. Mutants with a defect in the extracellular phosphodiesterase fall into this class (Riedel et al. 1973; Faure et al. 1988). The second mechanism is a cell number or mass sensor, which in Dictyostelium and other systems has been hypothesized to regulate aggregate size and cause the aggregate to break up if it exceeds a critical size (Spratt and Haas 1961). Hohl and Raper (1964) also found mutants of this type, as some mutant cells, when starved at very high cell densities, still formed small aggregates and fruiting bodies.
One possible mechanism that would allow individual cells to sense the number of cells in an aggregate or group could theoretically be mediated by a signal that is simultaneously secreted and sensed by cells, and that can diffuse into or be degraded by the surrounding environment (Clarke and Gomer 1995; Gomer 1999). With a small number of cells in the group, the signal concentration in the vicinity of the cells will be low, and as the number of cells increases, the signal concentration increases.
To isolate genes involved in aspects of Dictyostelium morphogenesis such as size determination, we developed shotgun antisense, in which Dictyostelium cells are transformed with an antisense vector containing a library of cDNAs (Spann et al. 1996). The transformed cells were cloned out and allowed to form plaques on a lawn of bacteria, and clones with unusual fruiting body morphologies were picked. A transformant that develops at a normal speed, but which forms very small fruiting bodies, was designated smlAas for small aggregates, with the as suffix designating antisense. A 275-bp antisense cDNA fragment was purified from smlAas cells by PCR. The isolated antisense cDNA showed no significant sequence similarity to any known gene. The antisense cDNA was religated into the antisense vector, and the resulting construct, when transformed into wild-type cells, recapitulated the original smlAas phenotype (Spann et al. 1996). These transformants were called smlAasr. The 275-bp antisense cDNA fragment was also used to screen a cDNA library, and a 1.2-kb cDNA was isolated and used to make a gene disruption construct. Cells transformed with this construct, designated smlA cells, had a disruption of the smlA gene as determined by Southern blots, had no detectable smlA mRNA on Northern blots, and had a small-fruiting-body phenotype (Spann et al. 1996).
smlA mRNA is expressed in vegetative and early developing cells (Brock et al. 1996). The sequence of the cDNA and the derived amino acid sequence of the SmlA protein show no significant similarity to any known sequence. There are no obvious motifs in the protein or large regions of hydrophobicity or charge. Immunofluorescence and staining of Western blots of cell fractions indicated that SmlA is a 35-kD cytosolic protein present in all vegetative and developing cells and is absent from smlA cells. The absence of SmlA did not affect the growth, motility, differentiation, or developmental speed of cells. Mixing 5% smlA cells with wild-type cells caused the wild-type cells to form smaller fruiting bodies and aggregates. Although there was no detectable SmlA protein secreted from cells, conditioned starvation medium (CM) from smlA cells also caused Ax-4 cells to form many small aggregates (Brock et al. 1996). Fractionation indicated that the component in the smlA CM that affects aggregate size is a protein with molecular weight >100 kD, but is not CMF, phosphodiesterase, or the phosphodiesterase inhibitor. The data thus suggest that there exists a secreted factor that regulates aggregate size, and that the secretion or processing of this factor is regulated by SmlA. In this report, we characterize the factor oversecreted by smlA cells, and find that it is a complex of polypeptides we call counting factor. Counting factor appears to be an example of a signal that is part of a general mechanism that measures the approximate number of cells in a group.
Results
We showed previously that the smlA transformant forms small aggregates and fruiting bodies due to the oversecretion of an unknown factor that is retained in a 100-kD cutoff centrifugal microfilter (Brock et al. 1996). This activity appeared to allow aggregation to begin normally, but then caused aggregation streams to break up (Brock et al. 1996). To characterize the factor, we used conventional column chromatography to fractionate starvation buffer in which either smlA or wild-type Ax4 cells had been starved (CM). After ion exchange chromatography of concentrated CM from both cell types, a bioassay of the various fractions showed that in the fractionated smlA CM, a peak that eluted at ∼0.56 m NaCl, caused aggregation streams to break up. The fractions from the 0.56 m peak were pooled and further fractionated by hydroxyapatite chromatography. As a control, the same fractions from the Ax4 CM were also pooled and run on a hydroxyapatite column. In a bioassay, the Ax4 hydroxyapatite column fractions all formed approximately the same number of aggregates. In the smlA fractions, an activity eluting at 0.3 m phosphate allowed streams to form normally, but then caused them to break up into small subaggregates.
When the hydroxyapatite peak was fractionated by electrophoresis on a nondenaturing polyacrylamide gel (exposure to SDS destroyed the activity of counting factor), a 30-fold dilution of the material eluting out of two adjacent slices (2 and 3) of the smlA hydroxyapatite fractions gel showed a strong peak of bioassay activity that caused an increase in aggregate number. Similarly eluted and diluted material from the Ax-4 hydroxyapatite fractions gel slices had little effect on cell aggregation in the bioassay. We observed that this activity increased aggregate number by causing aggregation streams to break up (Fig. 1A,B). At higher concentrations, the material eluting out of gel slices 2 and 3 from the Ax4 prep also caused aggregate streams to break up. As shown in Figure 1C, there are several different proteins present in the nondenaturing gel peak. Comparing the material purified from the smlA cells and from the Ax4 cells, we observed the same proteins, with a roughly fourfold greater amount in the smlA material. This suggests that smlA cells oversecrete a factor normally secreted by Ax4 cells.
Figure 1.
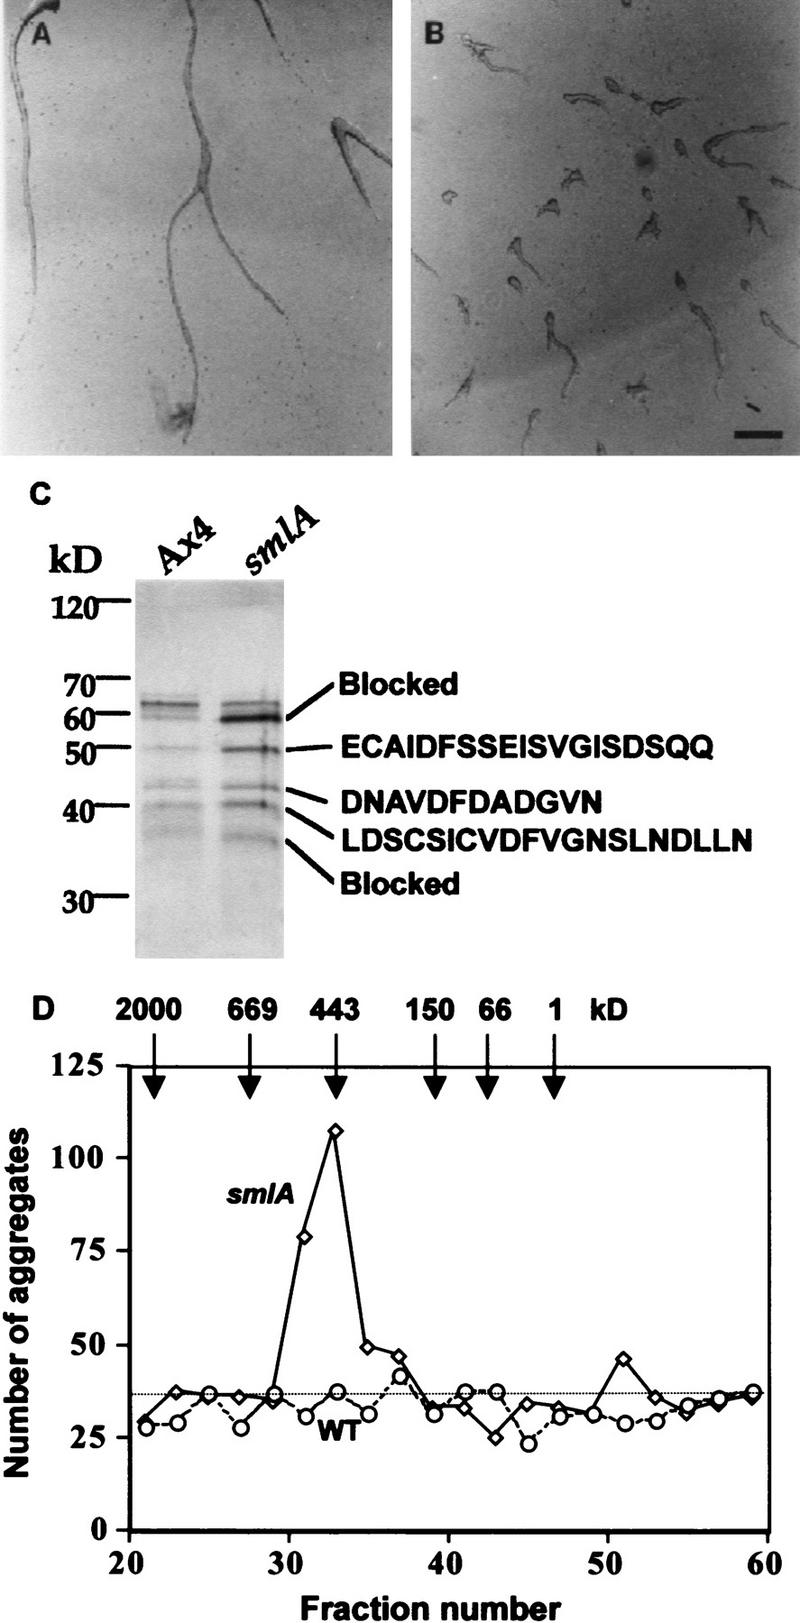
Purification of the counting factor. (A,B) Bioassay of the purified counting factor activity. Fractions 18–23 from the hydroxyapatite column were pooled, concentrated, desalted, and run on a 10% nondenaturing polyacrylamide gel. Then, 0.5-cm slices were excised, electroeluted, and concentrated. Ax4 cells were starved in submerged culture for 15 hr in the presence of (A) the material eluted from slice 3 of the nondenaturing gel of Ax4 CM, (B) material eluted from the same slice from smlA CM. Slice 2 from the smlA preparation had a similar number of small aggregates as seen for slice 3 from smlA; all other slices from the smlA prep and all the slices from the Ax4 prep had normal aggregation streams as shown for the Ax4 slice 2. Bar in B, 200 μm. (C) Silver-stained SDS–polyacrylamide gel of the combined material eluted from gel slices 2 and 3. In other experiments, the polypeptide composition of the material from the two slices was seen to be identical. The amino-terminal amino acid sequences of the proteins are shown at right. The sequence we obtained for the 43-kD band was a mixture of two sequences; the sequence of the more abundant polypeptide is shown. (D) Gel-filtration chromatography of the active fractions from the hydroxylapatite column. (Solid line) Number of aggregates formed in the presence of fractionated smlA; (broken line) wild-type (WT) control; (dotted line) number of aggregates formed in PBM.
We tried a variety of columns to further fractionate the polypeptides from the nondenaturing gel purification, but were unsuccessful. When the partially purified counting factor from the hydroxyapatite chromatography was fractionated on a gel filtration column, a single peak of activity was found, with an approximate molecular mass of 450 kD (Fig. 1D). An SDS–polyacrylamide gel of this peak showed essentially the same pattern of bands as seen in a gel of the material purified by elution from a nondenaturing gel. The observation that a factor with an effective molecular mass of 450 kD consists of polypeptides with molecular masses below 80 kD suggests that some of these polypeptides form a complex.
We attempted to sequence the amino termini of each of the proteins from the nondenaturing gel peak, and obtained sequences for the 50-, 43-, and 40-kD polypeptides (Fig. 1C). The 60- and 36-kD proteins appeared to have blocked amino termini. Iijima et al. (1995) described a 450-kD complex of proteins secreted by Dictyostelium cells. Although the protein profiles of counting factor and the Iijima factor are mostly different, both factors contain a roughly 50-kD polypeptide. The sequence of the 50-kD protein had only 3 of 14 amino acids identical with a 49-kD protein present in the Iijima factor, suggesting that the two proteins are different, and the difference in protein profiles suggests that the two complexes are different.
To further characterize the polypeptides eluted from the nondenaturing gel, we made degenerate oligonucleotides to isolate cDNA clones. As of yet, we were unable to isolate clones for the 50- and 43-kD proteins. For the 40-kD protein, we isolated a 920-nucleotide cDNA with the first AUG being followed by a 738-nucleotide ORF (Fig. 2). The ORF encodes a protein with a predicted molecular mass of 26.7 kD. The amino acid sequence of the originally sequenced peptide was present in the predicted amino acid sequence. The predicted sequence shows no significant similarity to any known protein. The predicted protein, which we have named countin, is hydrophilic, has a potential signal sequence upstream of where we observe the amino terminus of the secreted protein, and has two potential glycosylation sites (Fig. 2). To examine when during development the countin gene is expressed, a Northern blot of RNA from cells at different stages of development was probed with the countin cDNA. The countin mRNA is ∼1.2 kb, and is expressed in vegetative cells and throughout development (Fig. 3H and data not shown). To determine whether countin is present in all or just some cells, as well as its subcellular localization, cells were stained by immunofluorescence with anti-countin antibodies. As shown in Figure 3A, staining of vegetative wild-type cells shows countin present in all cells, associated with what appear to be vesicles. smlA cells show a weaker staining with a distribution roughly equivalent to wild-type cells (Fig. 3C).
Figure 2.

Sequence of the countin gene. The sequence starts with genomic DNA; the 5′ end of the cDNA is indicated by an arrow. The first AUG is at nucleotide 457. A broken underline indicates a potential signal sequence. The amino-terminal amino acid sequence obtained from the purified 40-kD protein is marked with a heavy underline. Two potential amino-linked glycosylation sites (Alexander 1997) are marked with boxes around the amino acid sequence. There is an intron between nucleotides 552 and 681. A light underline marks the sequence of the synthetic peptide used to immunize rabbits for antibody production. The KpnI sites used for the insertion of a blasticidin resistance cassette to make a gene disruption transformant are indicated by lines over the DNA sequence. (*) Start of an AAUAAA poly(A) addition signal. An open arrow marks where the cDNA sequence had 21 A’s and then terminated. The remainder of the sequence is genomic DNA. The sequence is available as AF140780 in Genbank.
Figure 3.


Countin is present in all cells and is absent from countin transformants. (A–F) Cells stained with anticountin antibody. (A,B,C) Immunofluorescence staining of cells; (D,E,F) corresponding phase images. A and D are Ax4 cells, B and E are countin knockout cells, and C and F are smlA cells. Bar in F, 10 μm. (G) Western blot of protein from wild-type (WT) and countin CM stained with anti-countin antibodies. (H) Northern blot of total RNA from vegetative cells probed with the countin cDNA.
Next, we wanted to see the effect of disrupting expression of countin. A gene disruption construct made with the cDNA failed to give homologous recombination as determined by PCR of DNA from transformant clones, so the cDNA was used to probe Southern blots to map the genomic DNA, and a 3-kb genomic fragment was then isolated. This was used to make a gene disruption construct to replace 0.5 kb of the countin coding region with a blasticidin resistance cassette. When transformed into Ax2 or Ax4 cells, this disrupted the countin gene as determined by PCR (data not shown). Northern blots of parental and transformed cells indicated that the countin cells lack the countin mRNA (Fig. 3H). Immunofluorescence showed that countin cells do not show the staining observed in wild-type cells (Fig. 3B), and Western blots indicated that a 40-kD band is stained with anti-countin antibodies in concentrated CM from wild-type but not countin cells (Fig. 3G). The above results suggest that countin mRNA and protein are absent from the countin cells.
The countin cells grew in shaking culture and on bacterial lawns approximately as well as the parental cells. At low cell density, the differentiation of countin cells into CP2-positive and SP70-positive was indistinguishable from wild-type cells (data not shown). When the countin cells were starved on either agar or filter pads, their development was slightly delayed with respect to that of the parental cells. On both agar and filter pads, the countin and parental cells formed aggregation territories of approximately the same size. However, the aggregation streams of the parental cells broke up into subgroups, whereas the streams of the countin cells continued to flow in toward the aggregation center (Fig. 4A,B). Occasionally, the large aggregates formed by the countin cells would then separate into several smaller groups. The countin cells were able to form fruiting bodies, but these were considerably larger than those of the parental cells (Fig. 4C), and as a consequence often fell over (Fig. 4D,E). Disruption of countin in Ax4 or smlA cells also resulted in larger aggregates (data not shown).
Figure 4.
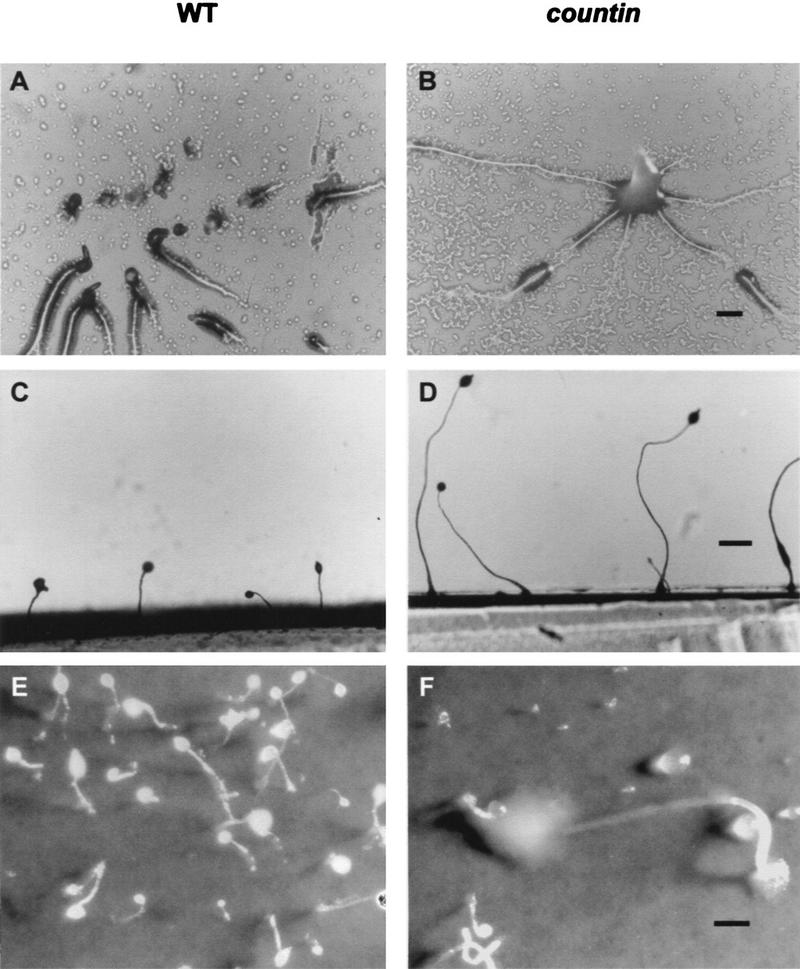
The development of countin cells. (A,B) Aggregation of wild-type (WT) and countin cells. Cells were starved at 107 cells/cm2 on PBM agar. (A) Wild-type cells showing aggregation streams breaking up. (B) countin cells with unbroken streams forming a large aggregate. Bar, 200 μm. (C,D) Side views of wild-type and countin fruiting bodies. (C) Wild-type fruiting bodies are normal size. (D) Fruiting bodies formed by starved countin cells are much taller than wild-type. Bar, 500 μm. (E,F) The effect of forming large fruiting bodies. Cells were starved at 107 cells/cm2 on filter pads moistened with PBM. (E) A field of wild-type fruiting bodies depicting normal size. (F) A large, toppled countin fruiting body. Bar, 500 μm.
To determine whether the phenotype of the countin cells was due to the lack of a secreted factor, the CM from countin cells was assayed for counting factor activity. When countin cells were starved at low density in the presence of CM from countin cells starved at high cell density, they formed no more aggregates than when they were starved in buffer alone; but when they were starved in CM from wild-type or smlA cells, they formed more aggregates (Fig. 5). Similar results were obtained starving Ax4 cells in the various conditioned media. When CM from smlA cells was treated for 1 hr at room temperature with a 1:500 dilution of anti-countin antibodies, the number of aggregates decreased by ∼50%. No effect was seen using countin CM or preimmune sera. When countin cells were mixed with 10% Ax4 cells and starved on either agar or filter pads, they formed Ax4-size fruiting bodies, and when mixed with smlA cells, they formed small fruiting bodies. A similar effect was observed when countin cells were starved on filter pads soaked with Ax4 or smlA CM. These results suggest that countin cells do not secrete a factor that causes aggregate streams to break up, but can sense and respond to a such a factor secreted by Ax4 and smlA cells.
Figure 5.

Assay of conditioned medium for counting factor activity. countin cells were starved in the presence of either PBM alone (Buffer), or buffer conditioned by a high density of starved countin, Ax4 (WT), or smlA cells. The number of aggregates was counted after 20 hr. Bars, s.e.m.
Discussion
Very little is known about how groups of cells are able to count themselves to regulate tissue size. An evenly spread culture of starved Dictyostelium cells breaks up into groups of ∼2 × 10⁴ cells. Previously, we hypothesized that individual cells would be able to sense the number of cells in a group by secreting and sensing a diffusible factor. We found a transformant (smlA) that appears to oversecrete such a factor, and apparently as a result of the high levels of the cell-counting factor, gives cells a false sense of the nearby presence of a large number of cells. A prediction of this hypothesis is that in the absence of the cell-counting factor, cells will be unable to sense whether they have formed an excessively large group, and thus will tend to form large aggregates. To test this prediction, we made transformants with a defective factor by purifying the factor, isolating the gene encoding a putative component of the factor, and then using this to make a gene disruption construct. To our delight, transformants lacking this component formed large aggregates, verifying the hypothesis.
The nature of the counting factor is rather unusual, in that it appears to be a complex of polypeptides (Fig. 1B,C). The counting factor would thus appear to be a multimer of countin, or a complex of countin and other proteins. If the counting factor is a multimer of different polypeptides, countin could either interact with a cell-surface receptor by itself, furnish part of the binding domain for a receptor, activate one receptor while another polypeptide in the counting factor complex activates a different receptor, or hold other proteins in a configuration necessary for them to interact with receptors. Like the cell-density signal CMF, countin has a polypeptide backbone that is smaller than the observed protein molecular mass, suggesting that like CMF and other secreted Dictyostelium proteins, countin has a considerable amount of glycosylation (Yuen et al. 1991; Alexander 1997). The ability of the countin transformants, as well as the smlA cells, which oversecrete countin, to form fruiting bodies indicates that countin is not involved with the differentiation of cells.
We were surprised to see a secreted signal with such a large molecular mass. Diffusion calculations by a secreted signal with a molecular mass of 10 kD, or even 1 kD, indicated that signals of these sizes could be used to sense the number of cells in a group (Fig. 6). Using an effective diffusion distance of x = √4Dt, in which D is the diffusion coefficient and t is the amount of time the material has been diffusing, we find that for a 450-kD signal diffusing through agar or moist dirt for 5 hr, the effective distance is ∼1 mm. For a 10-kD signal, the effective distance is roughly twice this. These distances are typical for the spacing between fruiting bodies, but much greater than the width of an aggregation stream or the diameter of the aggregated group of cells forming a fruiting body. Thus, one possible reason that the counting factor is so large is that this results in a relatively small propagation distance, allowing cells within a group to communicate with each other, but reducing the amount of signal a group of cells would see from neighboring groups.
Figure 6.

The theoretical concentration of counting factor at the center of a group of cells as a function of the number of cells in the group. The calculations were done for close-packed disks of cells on an agar or moist dirt surface, starting with one cell, then one cell with a ring of 6 cells around it (a total of 7 cells), up to a total of 200 concentric rings. The cells in the calculation were secreting counting factor continuously for 5 hr. The graph shows the concentrations for a 450-kD factor as well as a 10-kD factor, both being secreted from cells at 3 × 10⁻¹⁰ ng/sec.
Low-power microscopy of cells in the presence and absence of countin suggests that when Dictyostelium cells are starved at high density they form a converging aggregation stream pattern over a relatively very large area, and that countin is involved in the aggregation streams breaking up into chains of discrete groups of cells, each of which will go on to form a fruiting body. Disruption of the MAP kinase kinase, MEK1, causes a highly broken up stream phenotype very similar to that seen in smlA (Ma et al. 1997), suggesting the possibility that MEK1 is involved in either counting factor secretion or signal transduction. Because cells lacking countin have streams that do not break up, but form aggregates that occasionally break up, one possibility is that there exists more than one size determination mechanisms in Dictyostelium.
There is ∼2 μg of protein in the active fractions eluted from the nondenaturing gel peak from the prep of smlA CM (Table 1). The 40-kD polypeptide is ∼10% of this protein (Fig. 1B), so from 150 ml of 5 × 10⁶ cells/ml secreting for 20 hr we purified ∼0.2 μg of the 40-kD protein. Assuming that there is no internalization or degradation of the 40-kD protein, that the secretion is uniform with time, and that the yield is 13% (Table 1), there are ∼250 molecules of the 40-kD protein secreted per smlA cell per minute.
Table 1.
Purification of the counting factor
| Material
|
Volume (ml)
|
Differentiation activity
|
Protein
|
Specific activity (U/μg)
|
||||
|---|---|---|---|---|---|---|---|---|
| U/ml
|
units
|
%
|
μg/ml
|
μg
|
%
|
|||
| Whole CM | 150 | 1 | 150 | 100 | 14 | 2100 | 100 | 0.07 |
| Ion exchange fractions | 8 | 5 | 40 | 26 | 60 | 480 | 23 | 0.08 |
| Hydroxyapatite fractions | 5 | 5 | 25 | 16 | 30 | 150 | 7 | 0.16 |
| Gel elution purification | 0.66 | 30 | 20 | 13 | 3 | 2 | 0.1 | 10 |
The U/ml activity is defined as the lowest fold dilution at which the material produces a significant (1.5×) increase in the number of aggregates for A×4 starved in submerged culture.
Previously, we used calculations to show that a secreted factor that diffuses away from a group of cells can be used as part of a mechanism to sense the number of cells in a group (Yuen and Gomer 1994; Clarke and Gomer 1995). We used 450 kD as the molecular mass of counting factor to calculate a diffusion coefficient of 3.4 × 10⁻⁷ cm2/sec. Assuming that countin is secreted at an even rate by all starving cells, from the purification table we determined the approximate secretion rate of countin to be 3 × 10⁻¹⁰ ng/sec. This allows us to calculate the concentration of countin as a function of the number of cells secreting it. With the cells closely spaced, and the cells in a flat disk on a surface with the bulk diffusion properties of moist dirt or agar, the theoretical concentration of countin increases with the number of cells in the group (Fig. 6). At the lower number of cells, the concentration approaches the concentration for a single cell; previously, we saw that this concentration quickly reaches and stays at a fixed value (Yuen and Gomer 1994). We also calculated the concentration of a 10-kD signal, also being secreted at 3 × 10⁻¹⁰ ng/sec (Fig. 6, bottom curve). The concentration of this signal also increases with the number of cells, but is lower overall, due to the dissipation of this faster-diffusing signal. Similar results were obtained for different geometries of cells, such as an elongated stream. These calculations were done for groups of cells that had been secreting the factor continuously for 5 hr. Qualitatively similar results (signal concentration increasing with the number of cells in the group) were obtained for shorter and longer secretion times (results not shown).
From the purification (Table 1), 2 μg of counting factor was purified from 150 ml of smlA CM with a 13% purification efficiency, giving an estimated concentration of counting factor in smlA CM to be ∼100 ng/ml. The diffusion calculations indicate that this concentration is reached when there are ∼3 × 10³ cells in a group (Fig. 6). If we assume that the secretion of counting factor from smlA cells is fourfold greater than the secretion from wild-type cells (Fig. 1C), then the counting factor concentration would theoretically reach ∼100 ng/ml when there are ∼105 Ax4 cells in a group. Thus, there is a very crude agreement between the theoretical effect of countin and the observed number of cells in aggregates.
Our current working hypothesis is that to sense the number of cells in a group, the cells secrete a factor that diffuses into the surrounding environment. The environment thus becomes a concentration sink for the material. The cells measure at their plasma membranes the extracellular concentration of the factor, and this increases, although not linearly, with the number of cells in the group. Such a mechanism would work with the surrounding environment being either a tissue completely surrounding the group, or the surface of a permeable material that the cells sit on, such as moist dirt or agar. In addition to passive diffusion being a sink for the secreted factor, one can envision a surrounding layer of cells or material that absorbs, adsorbs, or enzymatically breaks down the signal, or removes it by a process such as endocytosis. In addition, the essential polarity of the mechanism could also be reversed, with the surrounding material or tissue supplying the signal, and the cells competing for the signal in any of the ways described above (Raff et al. 1998). Then, in the vicinity of the cells, the concentration of the signal would decrease as the number of cells increase. In several ways, a secreted signal can thus form the basis of a simple and elegant cell-counting mechanism.
Materials and methods
Cell culture
Dictyostelium discoideum Ax4 wild-type and smlA knockout cells (Brock et al. 1996) were grown as described previously (Jain and Gomer 1994), with the exception that for the HL5 growth medium the peptone was a mix of 7.15 grams of bacterial peptone (Oxoid Limited, Basingstoke, Hampshire, UK) and 7.15 grams of BBL Thiotone E peptone (Becton Dickinson, Cockeysville, MD) per liter; the HL5 was supplemented, after autoclaving, with 20 μg/liter biotin, 5 μg/liter vitamin B12, 200 μg/liter folic acid, 400 μg/liter lipoic acid, 500 μg/liter riboflavin, and 600 μg/liter thiamine. A mixture of 0.3 grams/liter streptomycin sulfate and 0.1 grams/liter ampicillin was used for the antibiotics. CM was made by harvesting mid-log phase cells by centrifugation at 500g for 5 min, resuspending cells in PBM [20 mm KH2PO4, 1 mm MgCl2, 0.01 mm CaCl2 (pH 6.1) with KOH], recentrifuging, resuspending to 5 × 10⁶/ml, and shaking at 110 RPM. After 20 hr, the cells were removed by centrifugation as above, and the supernatant was clarified by centrifugation at 12,000g for 10 min. Cell differentiation at low cell density was assayed following Wood et al. (1996).
Gel electrophoresis
Nondenaturing protein separating gel stock was 7.5 ml of 40% acrylamide (Fisher, Fairlawn, NJ), 2 ml of 2% bis-acrylamide (Fisher), 11.2 ml of 1 m Tris/HCl at pH 8.7, and 9.3 ml of water. Gels were polymerized with 15 μl of 20% ammonium persulfate and 1.5 μl TEMED/4 ml of gel stock, and overlaid with isobutanol. Nondenaturing stacking gel stock was 1.25 ml of 40% acrylamide, 0.65 ml of 2% bis-acrylamide, 1.25 ml of 1 m Tris/HCl (pH 6.8) and 6.85 ml of water. Stack stock (1 ml) was polymerized with 5 μl of 20% ammonium persulfate and 1.5 μl of TEMED. Gels were cast and run in a Mini-Protean II apparatus with 0.75-mm spacers and 15-tooth combs (Bio-Rad, Hercules, CA).
Protein purification and sequencing
CM (150 ml) from Ax-4 and smlA cells was concentrated with Centricon Plus-80 30,000 NMWL centrifugal filter devices (Millipore, Bedford, MA) to 1–1.5 ml. This and all subsequent concentration steps were done at 4°C. The chromatographic steps were done with an Econo system (Bio-Rad, Hercules, CA) at 4°C collecting 1-ml samples with all flow rates 1 ml/min. The concentrated CM was loaded on a 5-ml Econo-Pac High Q column (Bio-Rad). After washing the column with 5 ml of PBM, the bound material was eluted with a 35-ml gradient of 0–800 mm NaCl in PBM. To prevent proteolysis, a Boehringer complete protease inhibitor cocktail tablet (Roche, Indianapolis, IN) was dissolved in 1 ml of PBM to make a 50× cocktail, and 20 μl was added to each collected fraction. The peak activity fractions from the High Q column were pooled (typically a total of 6 ml) and diluted with PBM to 15 ml. This was then concentrated with an Ultrafree-15 10-kD cutoff centrifugal concentrator (Millipore) to 1 ml, and loaded on a 5-ml Econo-Pac CHT-II hydroxyapatite cartridge (Bio-Rad). After washing the column with 5 ml of PBM, the bound material was eluted with a 35-ml gradient of 0–800 mm potassium phosphate at pH 6.1 in PBM. Protease inhibitor was added to the fractions as described above. The peak activity fractions from the hydroxyapatite column were concentrated as described above to 1 ml. This material was then concentrated to 50 μl with a Microcon 30-kD cutoff centrifugal concentrator (Millipore). A total of 12.5 μl of 5× nondenaturing sample buffer (3.5 ml of 1 m Tris/HCl at pH 6.8, 3.6 ml of glycerol, 1.2 mg of bromphenol blue, with water added to 10 ml) was added, and the mixture was clarified by centrifugation at 14,000g for 2 min at room temperature. The supernatant was loaded on a 10% polyacrylamide nondenaturing gel. The gel was run at 50 V for 15 min, and then at 100 V for ∼1 hr, until the dye front was 1 cm from the bottom of the gel. The gel was cut into 5 mm slices. Each slice from one lane was crushed in 200 μl of PBM with a small pestle in an eppendorf tube, and 400 μl of PBM was used to rinse the pestle. After adding 12 μl of 50× protease inhibitor, the crushed gels were rotated end over end at 4°C overnight. The eluted protein was then clarified by centrifugation at 14,000g for 5 min and stored at −80°C. Alternatively, protein was electroeluted out of gel slices with a model 422 electroeluter with 12- to 15-kD cutoff membranes following the manufacturer’s directions (Bio-Rad). To obtain protein for amino acid sequencing, the material from several preps was pooled and concentrated as described above. This was loaded in a well of a 20% SDS–polyacrylamide gel. The top chamber contained 40 μl of thioglycolic acid (Sigma, St. Louis, MO) in 200 ml of running buffer. After electrophoresis, the gel was blotted to Problot PVDV (Applied Biosystems, Foster City, CA) in Laemmli running buffer containing 20% methanol for 5 hr at 35 V in a water-cooled transblot apparatus (Bio-Rad). The blot was stained with amido black following Jain et al. (1992) and the bands were excised. Amino-terminal amino acid sequencing of the protein in the bands was done at the Baylor College of Medicine core facility.
Gel filtration
Size fractionation of conditioned medium or partially purified counting factor was done at 4°C with a 1.5 × 47.5-cm column of A 1.5-m resin (Bio-Rad) equilibrated in PBM and collecting 1.4-ml fractions. The column was calibrated with Bromphenol Blue and a 29- to 700-kD gel filtration chromatography standards kit (Sigma).
Assay for counting factor activity
To avoid interference from protease inhibitors and salt from the column fractions, 300 μl of every sample for the counting factor bioassay (except for whole CM and sieving gel fractions) was concentrated with a Microcon 30-kD cutoff centrifugal concentrator as described above and resuspended in 300 μl of PBM. The concentration and resuspension was then repeated two more times. For the bioassay, Ax4 cells growing in shaking culture at 1 × 10⁶ to 2 × 10⁶ cells/ml were harvested by centrifugation, washed in PBM, and resuspended in PBM to 1 × 10⁶ cells/ml. A total of 150 μl of these cells were mixed with 10–300 μl of column fraction or eluted material and 40 μl of Ax4 conditioned medium. PBM was added to a final volume of 450 μl. This was placed in the well of a 24 well plate (type 3047, Falcon, Lincoln Park, NJ). The plates were examined 15–24 hr later with an inverted microscope, and the number of aggregates was counted.
cDNA and genomic DNA isolation
A degenerate oligonucleotide encoding the amino acid sequence ICVDFVG from the 40-kD protein, with a MluI site at the 5′ end, GCACGCGTAT(TCA)TG(TC)GT(AGTC)GA(TC)TT(TC)GTAGG and a primer ACCTCTATACTTTAACGTCAAGGAG binding to the λ YES plasmid were used for PCR following Compton (1990) with a Dictyostelium cDNA library (a gift from Dr. Gino de Hostos, UCSF) as the template. The products from the PCR reaction were cloned into a TA-cloning vector (Invitrogen, Carlsbad, CA) following the manufacturer’s protocol. Several PCR products were obtained and were sequenced at the University of Texas Houston core facility. One cloned PCR product had a sequence corresponding to the primer, and then encoded a protein with the same initial sequence as the rest of the sequenced protein. An oligonucleotide with a portion of the sequence of the PCR product was then labeled with 32P and used to screen the λ yes library, and a larger cDNA clone was obtained. This clone and the original PCR product were sequenced by primer walking.
To isolate genomic countin DNA, Southern blots of Dictyostelium genomic DNA digested with a variety of restriction enzymes were probed with the countin cDNA following Wood et al. (1996). After generating a restriction map, we chose to isolate a 3.0 kb HindIII–SacI fragment that had the countin-coding region near its center. A genomic sublibrary was made by digesting genomic DNA with SacI and HindIII, and gel purifying the ∼3-kb DNA. This was cloned into pBluescript, and this library was screened with the countin cDNA as a probe following Wood et al. (1996).
Gene disruption
The 3.0-kb fragment of countin genomic DNA in pBluescript was excised with HindIII and SacI and ligated into the same sites in pUC 19. A 0.5-kb KpnI fragment in the approximate middle of the coding region in the genomic DNA was then replaced with the 1.4-kb KpnI fragment from pBSR479 containing a Dictyostelium blasticidin resistance cassette. The pBSR479 plasmid was a gift from Dr. Frantisek Puta (Charles University, Prague, Czech Republic), and is a modification of the blasticidin resistance cassette developed by Sutoh (1993). This construct was then digested with EcoR1 (this cuts inside the genomic DNA, on the 3′ side of the countin gene, and in pUC 19, outside the genomic DNA) to yield a 3.3-kb linear construct with 0.6 kb of the countin 5′ sequence, the blasticidin resistance cassette, and 1.3 kb of countin 3′ sequence. This was used to transform both Ax2 and Ax4 cells following Shaulsky et al. (1996).
Antibody preparation, immunofluorescence, and Western blots
The synthetic peptide CGSPHPNTYTLANGTT was conjugated to keyhole limpet hemocyanin and this was then used to immunize a rabbit at Biosynthesis Inc. (Lewisville, TX). Antibodies were purified from sera with a 25%–50% ammonium sulfate cut followed by dialysis against 10 mm sodium phosphate at pH 7.4. After dialysis, the antibodies were clarified by centrifugation at 12,000g for 5 min, and then sodium azide and NaCl were added to 10 mm and 120 mm, respectively. For immunofluorescence, cells were fixed with ethanol and stained following Gomer (1987). With stained cells mounted in glycerol, we observed that the antibody came off the cells slowly, so slides were observed immediately after mounting.
Diffusion calculations
The diffusion of a factor such as countin was calculated following Yuen and Gomer (1994). The calculations were done for point sources on a thick layer of moist dirt secreting a 450-kD molecule at 3 × 10⁻¹⁰ ng/sec continuously for 5 hr. We used an effective diffusion coefficient of 1.7 × 10⁻⁷ cm2/sec (Moore 1962). As a comparison, we also did the calculations for a 10-kD signal, with a diffusion coefficient of 1.2 × 10⁻⁶ cm2/sec. The cells were assumed to be in a circular disk in a closely packed array. The concentration at the center of the disk was calculated for one cell at the center, then for one cell plus a contribution from a ring of surrounding cells, etc.
Acknowledgments
We thank Richard Cook for the protein sequencing, Diane Hatton for assistance with preparation of the figures, and Sheila A. Herman for assistance with photographic printing. R.H.G. is an associate investigator of the Howard Hughes Medical Institute.
The publication costs of this article were defrayed in part by payment of page charges. This article must therefore be hereby marked ‘advertisement’ in accordance with 18 USC section 1734 solely to indicate this fact.
Footnotes
E-MAIL richard@bioc.rice.edu; FAX (713) 285-5154.
References
- Alexander S. Developmental regulation and function of glycoproteins in Dictyostelium discoideum. In: Maeda Y, Inouye K, Takeuchi I, editors. Dictyostelium - A model system for cell and developmental biology. Tokyo, Japan: Universal Academy Press; 1997. pp. 349–362. [Google Scholar]
- Bonner JT, Hoffman ME. Evidence for a substance responsible for spacing pattern of aggregation and fruiting bodies in the cellular slime mold. J Embryol Exp Morphol. 1963;11:571–589. [PubMed] [Google Scholar]
- Brock DA, Buczynski F, Spann TP, Wood SA, Cardelli J, Gomer RH. A Dictyostelium mutant with defective aggregate size determination. Development. 1996;122:2569–2578. doi: 10.1242/dev.122.9.2569. [DOI] [PubMed] [Google Scholar]
- Clarke M, Gomer RH. PSF and CMF, autocrine factors that regulate gene expression during growth and early development of Dictyostelium. Experientia. 1995;51:1124–1134. doi: 10.1007/BF01944730. [DOI] [PubMed] [Google Scholar]
- Compton T. Degenerate primers for DNA amplification. In: Innis MA, Gelfand DH, Sninsky JJ, White TJ, editors. PCR protocols. A guide to methods and applications. San Diego, CA: Academic Press; 1990. pp. 39–45. [Google Scholar]
- Devreotes P. Dictyostelium discoideum: A model system for cell-cell interactions in development. Science. 1989;245:1054–1058. doi: 10.1126/science.2672337. [DOI] [PubMed] [Google Scholar]
- Dicou EL, Brachet P. Multiple forms of an cyclic-AMP phosphodiesterase from Dictyostelium discoideum. Biochim Biophys Acta. 1979;578:232–242. doi: 10.1016/0005-2795(79)90131-4. [DOI] [PubMed] [Google Scholar]
- Faix J, Gerisch G, Noegel AA. Overexpression of the csA cell adhesion molecule under its own cAMP- regulated promoter impairs morphogenesis in Dictyostelium. J Cell Sci. 1992;102:203–214. doi: 10.1242/jcs.102.2.203. [DOI] [PubMed] [Google Scholar]
- Faure M, Podgorski GJ, Franke J, Kessin RH. Disruption of Dictyostelium discoideum morphogenesis by overproduction of cAMP phosphodiesterase. Proc Natl Acad Sci. 1988;85:8076–8080. doi: 10.1073/pnas.85.21.8076. [DOI] [PMC free article] [PubMed] [Google Scholar]
- Faure M, Podgorski GJ, Franke J, Kessin RH. Rescue of a Dictyostelium discoideum mutant defective in cyclic nucleotide phosphodiesterase. Dev Biol. 1989;131:366–372. doi: 10.1016/s0012-1606(89)80010-7. [DOI] [PubMed] [Google Scholar]
- Firtel RA. Integration of signaling information in controlling cell-fate decisions in Dictyostelium. Gene & Dev. 1995;9:1427–1444. doi: 10.1101/gad.9.12.1427. [DOI] [PubMed] [Google Scholar]
- Franke J, Kessin RH. The cyclic nucleotide phosphodiesterase inhibitory protein of Dictyostelium discoideum purification and characterization. J Biol Chem. 1981;256:7628–7637. [PubMed] [Google Scholar]
- Gerisch G. Cell aggregation and differentiation in Dictyostelium. Curr Top Dev Biol. 1968;3:157–197. doi: 10.1016/s0070-2153(08)60354-3. [DOI] [PubMed] [Google Scholar]
- Gomer RH. A strategy to study development and pattern formation: Use of antibodies against products of cloned genes. Methods Cell Biol. 1987;28:471–487. doi: 10.1016/s0091-679x(08)61664-7. [DOI] [PubMed] [Google Scholar]
- ————— Cell density sensing in a eukaryote. ASM News. 1999;65:23–29. [Google Scholar]
- Gomer RH, Yuen IS, Firtel RA. A secreted 80 × 103 Mr protein mediates sensing of cell density and the onset of development in Dictyostelium. Development. 1991;112:269–278. doi: 10.1242/dev.112.1.269. [DOI] [PubMed] [Google Scholar]
- Hall AL, Franke J, Faure M, Kessin RH. The role of the cyclic nucleotide phosphodiesterase of Dictyostelium discoideum during growth, aggregation, and morphogenesis: Overexpression and localization studies with the separate promoters of the pde. Dev Biol. 1993;157:73–84. doi: 10.1006/dbio.1993.1113. [DOI] [PubMed] [Google Scholar]
- Hohl HR, Raper KB. Control of sorocarp size in the cellular slime mold Dictyostelium discoideum. Dev Biol. 1964;9:137–153. [Google Scholar]
- Iijima N, Takagi T, Maeda Y. A proteinous factor mediating intercellular communication during the transition of Dictyostelium cells from growth to differentiation. Zool Sci. 1995;12:61–69. doi: 10.2108/zsj.12.61. [DOI] [PubMed] [Google Scholar]
- Jain R, Gomer RH. A developmentally regulated cell surface receptor for a density-sensing factor in Dictyostelium. J Biol Chem. 1994;269:9128–9136. [PubMed] [Google Scholar]
- Jain R, Yuen IS, Taphouse CR, Gomer RH. A density-sensing factor controls development in Dictyostelium. Genes & Dev. 1992;6:390–400. doi: 10.1101/gad.6.3.390. [DOI] [PubMed] [Google Scholar]
- Kessin RH, Orlow SJ, Shapiro RI, Franke J. Binding of inhibitor alters kinetic and physical properties of extracellular cyclic AMP phosphodiesterase from Dictyostelium discoideum. Proc Natl Acad Sci. 1979;76:5450–5454. doi: 10.1073/pnas.76.11.5450. [DOI] [PMC free article] [PubMed] [Google Scholar]
- Loomis WF. Dictyostelium discoideum: A developmental system. New York, NY: Acadademic Press; 1975. [Google Scholar]
- ————— Lateral inhibition and pattern formation in Dictyostelium. Curr Top Dev Biol. 1993;28:1–46. doi: 10.1016/s0070-2153(08)60208-2. [DOI] [PubMed] [Google Scholar]
- Ma H, Gamper M, Parent C, Firtel RA. The Dictyostelium MAP kinase kinase DdMEK1 regulates chemotaxis and is essential for chemoattractant-mediated activation of guanylyl cyclase. EMBO J. 1997;16:4317–4332. doi: 10.1093/emboj/16.14.4317. [DOI] [PMC free article] [PubMed] [Google Scholar]
- Mehdy MC, Firtel RA. A secreted factor and cyclic AMP jointly regulate cell-type-specific gene expression in Dictylstelium discoideum. Mol Cell Biol. 1985;5:705–713. doi: 10.1128/mcb.5.4.705. [DOI] [PMC free article] [PubMed] [Google Scholar]
- Moore WJ. Physical Chemistry. 3rd Edition. Englewood Cliffs, N.J: Prentice-Hall, Inc.; 1962. [Google Scholar]
- Nanjundiah V, Malchow D. A theoretical study of the effect of cyclic AMP phosphodiesterase during aggregation in Dictyostelium. J Cell Sci. 1976;22:49–58. doi: 10.1242/jcs.22.1.49. [DOI] [PubMed] [Google Scholar]
- Newell PC, Liu G. Streamer F mutants and chemotaxis of Dictyostelium. BioEssays. 1992;14:473–479. doi: 10.1002/bies.950140708. [DOI] [PubMed] [Google Scholar]
- Orlow SJ, Shapiro I, Franke J, Kessin RH. The extracellular cyclic nucleotide phosphodiesterase of Dictyostelium discoideum. Purification and characterization. J Biol Chem. 1981;256:7620–7627. [PubMed] [Google Scholar]
- Raff M, Durand B, Gao F. Cell number control and timing in animal development: the oligodendrocyte cell lineage. Int J Dev Biol. 1998;42:263–267. [PubMed] [Google Scholar]
- Reymond CD, Gomer RH, Nellen W, Theibert A, Devreotes P, Firtel R. Phenotypic changes induced by a mutated ras gene during the development of Dictyostelium transformants. Nature. 1986;323:340–343. doi: 10.1038/323340a0. [DOI] [PubMed] [Google Scholar]
- Riedel V, Gerisch G. Regulation of extracellular c-AMP-PDE activity during development of Dictyostelium discoideum cAMP-phophodiesterase. Biochem Biophys Res Comm. 1971;42:119–124. doi: 10.1016/0006-291x(71)90370-6. [DOI] [PubMed] [Google Scholar]
- Riedel V, Gerisch G, Muller E, Beug H. Defective cyclic adenosine-3,5′-phosphate-phosphodiesterase regulation in morphogenetic mutants of Dictyostelium discoideum. J Mol Biol. 1973;74:573–585. doi: 10.1016/0022-2836(73)90048-x. [DOI] [PubMed] [Google Scholar]
- Robertson ADJ, Grutsch JF. Aggregation in Dictyostelium discoideum. Cell. 1981;24:603–611. doi: 10.1016/0092-8674(81)90087-8. [DOI] [PubMed] [Google Scholar]
- Schaap P. Regulation of size and pattern in the cellular slime molds. Differentiation. 1986;33:1–16. [Google Scholar]
- ————— . Intercellular interactions during Dictyostelium development. In: Dworkin M, editor. Microbial cell-cell interactions. Washington, DC.: American Society of Microbiology; 1991. pp. 147–178. [Google Scholar]
- Shaulsky G, Escalante R, Loomis WF. Developmental signal transduction pathways uncovered by genetic suppressors. Proc Natl Acad Sci. 1996;93:15260–15265. doi: 10.1073/pnas.93.26.15260. [DOI] [PMC free article] [PubMed] [Google Scholar]
- Spann TP, Brock DA, Lindsey DF, Wood SA, Gomer RH. Mutagenesis and gene identification in Dictyostelium by shotgun antisense. Proc Natl Acad Sci. 1996;93:5003–5007. doi: 10.1073/pnas.93.10.5003. [DOI] [PMC free article] [PubMed] [Google Scholar]
- Spratt NT, Haas H. Intergrative mechanisms in development of the early chick blastoderm. III. Role of cell population size and growth potentiality in synthetic systems larger than normal. J Exptl Zool. 1961;147:271–293. doi: 10.1002/jez.1401470308. [DOI] [PubMed] [Google Scholar]
- Sussman RR, Sussman M. Cellular differentiation in Dictyosteliaceae: Heritable modifications of the developmental pattern. Ann NY Acad Sci. 1953;56:949–960. doi: 10.1111/j.1749-6632.1953.tb30274.x. [DOI] [PubMed] [Google Scholar]
- Sutoh K. A transformation vector for Dictyostelium discoideum with a new selectable marker bsr. Plasmid. 1993;30:150–154. doi: 10.1006/plas.1993.1042. [DOI] [PubMed] [Google Scholar]
- Tsang AS, Coukell MB. Biochemical and genetic evidence for two extracellular adenosine 3′:5′- Monophosphate phosphodiesterases in Dictyostelium purpureum. Eur J Biochem. 1979;95:407–417. doi: 10.1111/j.1432-1033.1979.tb12979.x. [DOI] [PubMed] [Google Scholar]
- Wood SA, Ammann RR, Brock DA, Li L, Spann TP, Gomer RH. RtoA links initial cell type choice to the cell cycle in Dictyostelium. Development. 1996;122:3677–3685. doi: 10.1242/dev.122.11.3677. [DOI] [PubMed] [Google Scholar]
- Wu L, Franke J, Blanton RL, Podgorski GJ, Kessin RH. The phosphodiesterase secreted by prestalk cells is necessary for Dictyostelium morphogenesis. Dev Biol. 1995;167:1–8. doi: 10.1006/dbio.1995.1001. [DOI] [PubMed] [Google Scholar]
- Yuen IS, Gomer RH. Cell density-sensing in Dictyostelium by means of the accumulation rate, diffusion coefficient and activity threshold of a protein secreted by starved cells. J Theo Biol. 1994;167:273–282. doi: 10.1006/jtbi.1994.1069. [DOI] [PubMed] [Google Scholar]
- Yuen IS, Taphouse C, Halfant KA, Gomer RH. Regulation and processing of a secreted protein that mediates sensing of cell density in Dictyostelium. Development. 1991;113:1375–1385. doi: 10.1242/dev.113.4.1375. [DOI] [PubMed] [Google Scholar]
- Yuen IS, Jain R, Bishop JD, Lindsey DF, Deery WJ, Van Haastert PJM, Gomer RH. A density-sensing factor regulates signal transduction in Dictyostelium. J Cell Biol. 1995;129:1251–1262. doi: 10.1083/jcb.129.5.1251. [DOI] [PMC free article] [PubMed] [Google Scholar]