

Abstract
Genetic information encoded by DNA is organized in a complex and highly regulated chromatin structure. Each chromosome occupies a specific territory, that may change according to stage of development or cell cycle. Gene expression can occur in specialized transcriptional factories where chromatin segments may loop out from various chromosome territories, leading to co-localization of DNA segments which may exist on different chromosomes or far apart on the same chromosome. The Associated Chromosome Trap (ACT) assay provides an effective methodology to identify these long-range DNA associations in an unbiased fashion by extending and modifying the chromosome conformation capture technique. The ACT assay makes it possible for us to investigate mechanisms of transcriptional regulation in trans, and can help explain the relationship of nuclear architecture to gene expression in normal physiology and during disease states.
Keywords: Molecular Biology, Issue 50, Associated chromosomal Trap, DNA long-range interaction, nuclear architecture, gene regulation
Protocol
1. Formaldehyde fixation of long-range chromatin interactions
Culture human cell line HL-60 in RPMI1640 medium with 15% FBS and 1 x penicillin/streptomycin to 80-90% confluence in an incubator supplied with 5% CO2 at 37°C.
Collect the cells into a 50-ml Nunc tube, centrifuge at 1,200 rpm for 15 minutes, and then remove the medium by aspiration
Add 5 ml of culture medium to resuspend the cell pellets, and count the cells using a hemocytometer. Take approximately 1 x 10⁷ cells to a volume of 40 ml with RPMI1640 /10% FBS, then add 1.7 ml of 37% formaldehyde to fix the dilute chromatin.
Incubate at room temperature for 10 minutes with gentle shaking, and then quench with 2.4 ml of 2M glycine. Centrifuge for 15 minutes at 1,200 rpm at 4°C, and remove the supernatant. Wash the pellet once with 40 ml ice cold PBS, then spin down the pellet and remove the PBS.
2. Cell lysis to isolate nuclei
Resuspend cells in 40 ml of ice cold lysis buffer (10 mM Tris-HCl, pH8.0, 10 mM NaCl, 0.2% NP-40) with freshly added protease inhibitors (1:500 dilution) and 0.1 mM PMSF. Incubate in a cold room with rotation for 90 minutes, centrifuge at 2,500 rpm for 15 minutes, and remove the supernatant.
3. Restriction enzyme digestion with Bgl II
Resuspend the nuclei in 0.5 ml of 1 x NEB buffer 3, and add 15 μlof 10% SDS. Incubate at 37°C for 1 hour with shaking, then add 45 μl of 20% Triton X-100 to sequester the SDS. Incubate at 37°C for 1 hour with shaking.
Use an aliquot of 1 x 10⁶ nuclei (about 15 μg, one tenth of the original cells) for restriction enzyme digestion. Take out 55 μl of nuclei solution from Step 3.1 and make up to 500 μl with 433 μl of 1 x NEB buffer 3 and 12 μl of Bgl II(50U/ul). Incubate at 37°C overnight.
4. Ligation of interacting DNA segments
Inactivate the restriction enzyme by adding 95 μl of 10% SDS, and denature by heating at 65 °C for 20 minutes in a water bath.
Add 7 ml of 1 x ligation buffer (30 mM Tris-HCl, pH 8.0, 10 mM MgCl2, 10 mM DTT, 1 mM ATP) and 360 μl of 20% Triton X-100 and incubate at 37°C for 1 hour.
Lower the temperature to 16°C and add 50 μl of 400 U/μl T4 DNA ligase. Incubate the sample at 16 °C for 4 hours and then at room temperature for 30 minutes.
5. DNA Purification
Add 300 μg of proteinase K, and incubate at 65°C overnight.
Add 5 μg of RNase A and incubate at 37°C for 30 minutes
Purify DNA by phenol/chloroform extraction, and precipitate DNA in isopropanol. Dissolve DNA in 150 μl of sterile distilled water.
6. Digestion with Msp I and ligation with oligonucleotide linkers
Incubate 2μg of purified DNA with 5 units of Msp I at 37°C for 4-6 hours. Inactivate Msp I at 65°C for 10 minutes, then precipitate the DNA in ethanol with 1 μl of 5 mg/ml glycogen. Dissolve the DNA pellet in 50 μl of sterile distilled water.
Mix 50 μl of Msp I-treated DNA with 2 μl of a 20 μM linker oligonucleotide L (5'-gctgaccctgaattcgcacgtgcctgtcgttagcggacacagggcgattcac-3'), 1 μl of a 20 μM oligonucleotide S (5'-cggtgaatc-3'), 1 μl of sterile distilled water and 6 μl of 10 x T4 DNA ligase buffer. Cover the mixture with liquid wax.
Denature oligonucleotides at 50°C for 1 minute and allow to cool down gradually to 10°C in a 0.5°C /minute gradient in a thermal cycler.
Add 1 μl of 400 U/μl T4 DNA ligase and incubate at 15°C overnight. Purify the linker-ligated DNA using a QIAquick PCR Purification kit, and elute in 50 μl of sterile distilled water.
7. PCR amplification and sequence analysis
Choose a primer for the specific region of DNA that you wish to examine for long-range interactions (i.e., the 'bait'). In this example, we use ABL-1.
Take 1 μl of the purified DNA to perform the first round PCR using 1 μl of 20 μM ABL-1 specific primer #4656 (5'-gttcaagcgattctcctgcctcga-3'), 1 μl of 20 μM linker specific primer #2963 (5'-gctgaccctgaattcgcacgtgcct-3'), 3μl of 3 x Klen Taq DNA polymerase I cocktail and 3 μl of sterile distilled water. Two μl of 32P-dCTP is added to 100 μl of 3 x Klen Taq DNA polymerase I cocktail before PCR amplification. The thermal cycle for a hot start PCR is 72°C for 2 min, 95° Cfor 2 minutes; 18 cycles of 95°C for 20 seconds, 65°C for 40 seconds, and 72°C for 1 minute; the final extension is performed at 72°C for 5 minutes.
Purify the first round PCR products using a QIAquick PCR Purification kit, and elute DNA in 30 μl of sterile distilled water.
Take 1 μl of 100 x diluted first PCR product to perform a second round of PCR using nested primers by adding 1 μl of 20 μM ABL-1 specific primer #4626 (5'-ggagaatttttatctgcctctgtga-3') (Figure 1a),1 μl of 20 μM of linker specific primer #2961 (5'-gtcgttagcggacacagggcgattc-3'), 3 μl of 3 x Klen Taq DNA polymerase I cocktail and 3 μl of sterile distilled water. The thermal cycling schedule is 25 cycles of 95°C for 20 seconds, 67°C for 40 seconds, and 72°C for 1 minute, followed by extension at 72°C for 5 minutes.
Visualize the PCR products by running a 5% urea-PAGE gel and scanning the exposed screen in a PhosphoImager (Figure 1b). Each PCR band can be recycled from the gel by dissolving the gel strips in an Eppendorf tube containing 60 μl of sterile distilled water, and incubating at 95°C for 5 minutes. Centrifuge briefly at 10,000 rpm for 10 sec to collect all the samples. Remove 1 μl to use as the DNA template to perform PCR with the primer pair 2961/4626 using the same conditions as described above. Sequence analysis can be performed after purification using a QIAquick PCR Purification kit.
DNA sequences are analyzed using an online tool to determine their chromosomal location at the web site:http://genome.ucsc.edu(Figure 1c). Click 'BLAT' to enter a new window which allows to paste a DNA sequence, a new window appears after clicking 'submit', and shows the 'BLAT Search Results'. Click 'browser' of the hit with 100% identity to enter a next window to show the location of the DNA sequence.
8. Representative Results
1. ACT assay using ABL-1 region as bait to determine its long range DNA interactions
As illustrated in Figure 1a, two Bgl II sites and one BamH I site were chosen for the ACT assay. In the second round of PCR, primer set 4626/2961 was used to amplify ABL-M1, 4630/2961 was used for ABL-M2, and 4636/2961 was used for ABL-M3. A typical gel pattern shows one to several bands (Figure 1b). Each fragment from an ACT assay consists of two combined DNA segments: one segment is derived from the bait DNA region, while the second segment comes from the associated partner, which was joined to the bait region segment by the first restriction enzyme recognition sequence. The second enzyme recognition sequence will appear at the end of the associated partner sequence (Figure 1c). The cloned ABL-M1 fragment contains DNA from the region of ABL1 located at chromosome 9q32.4 from +133,592,306-133,592,399, and the associated partner is located at chromosome 3p13 from +71,869,882-71,870,107. The identities of the associated partners are discovered by blasting their sequences using the UCSC genome browser (GRCh7/hg19 released in February, 2009). PROK2 was identified as the associated partner at the chr3p13 locus.
Similarly, the ABL-M2 associated partner was localized to chr5q21.1, while clone ABL-M3 was identified as an intra-chromosomal association near the ABL-1 locus.
2. Determining less prevalent long range interactions using ACT assay
Other assays based on 3C have reported many more interacting partners than that we have shown in Figure 1 and at the Igf2/H19 locus12. The methodology that we have outlined will select the most prevalent long range interactions. However, by increasing the number of PCR cycles, it is possible to identify additional, less frequent associations as well (Figure 2).
3. Differences in long range interactions in cancer cells when compared to normal tissues.
The ACT assay can also be used to identify differences in nuclear architecture and long range interactions between normal cells and cancer cells (Figure 3). These differences may reflect nuclear architecture changes that occur during cell transformation, and thus this assay may ultimately be applicable for diagnostic purposes. The similar gel patterns that occur in both normal and cancer tissues indicated that the ACT assay is reliable and repeatable. While the ACT assay can identify long range DNA partners, further analyses, such as FISH and ChIP assays, are required to verify the presence of the identified associations between distant loci. Genetic, physiological and biochemical studies can then be performed to elucidate the biological implications of these long range DNA associations.
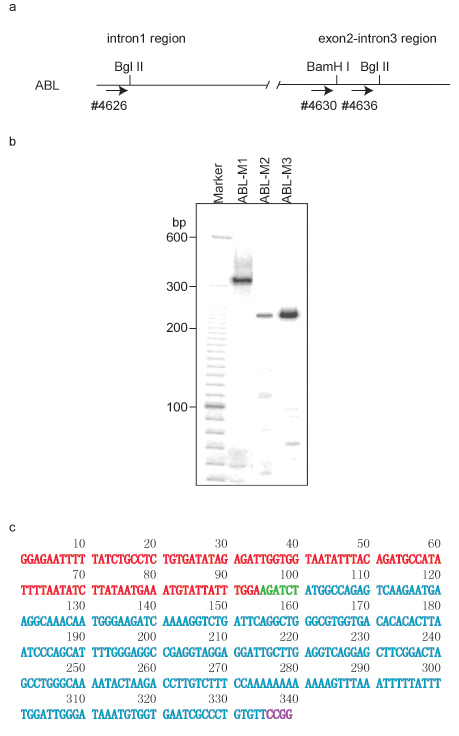 Figure 1 ACT assay using ABL-1 region as bait DNA in HL-60 cells. a. DNA structure in ABL-1 region. The first restriction enzyme used in ACT assay was Bgl II. The primers for the second round of PCR are also labeled by arrows and corresponding primer numbers. b. Gel pattern of the ACT assay in 5% urea-PAGE. Primer pair 4626/2961 was used for amplifying clone ABL-M1 in the nested PCR, 4630/2961 was used for clone ABL-M2, and 4636/2961 was used for clone ABL-M3. c. DNA sequence of clone ABL-M1. DNA fragment from ABL-1 bait DNA is labeled in red, and the associated DNA partner is labeled in cyan. Bgl II site (AGACTC) was labeled in green, and Msp I site (CCGG) is labeled in purple.
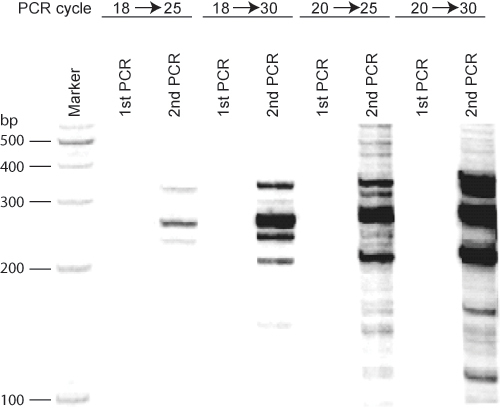 Figure 2 PCR cycles affect ACT assay results. Using the imprinting control region (ICR) at the Igf2/H19 locus as bait DNA in mouse fibroblast cells, different cycling programs were applied in the first and second rounds of PCR in the ACT assay. 18-20 cycles in the first round of PCR did not amplify enough signal to be visualized. Twenty five cycles in the second PCR results in clear bands, while increasing the number of cycles for the second round of PCR induced a smear pattern in addition to more bands.
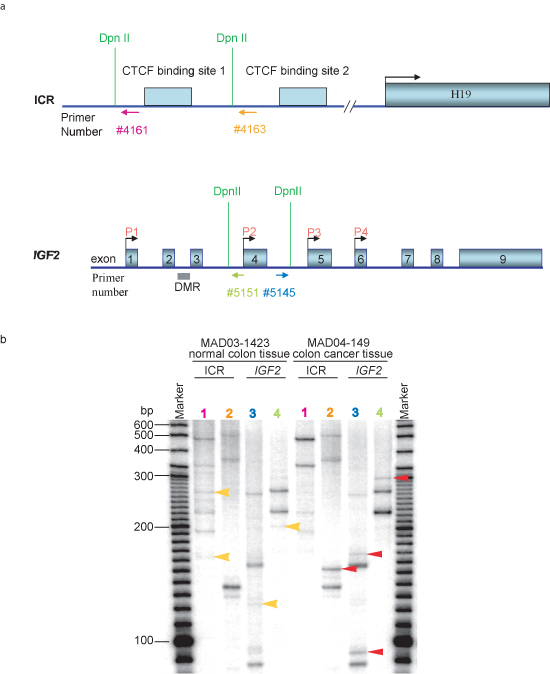 Figure 3 Detection of differences in nuclear architecture between normal colon tissue and colon cancer tissue in ACT assay. a. DNA structure of the ICR region at IGF2/H19 locus and IGF2 gene. Dpn II sites for ACT assay are labeled. Primers used in the second round PCR are labeled by arrows and numbers in different colors which correspond to each lane in panel b of the figure. b. Gel pattern of the ACT assay in 5% urea-PAGE. Normal colon tissue MAD03-1423 and colon cancer tissue MAD04-149 was obtained from Cooperative Human Tissue Network (CHTN) Western Division. After each colon tissue was homogenized, ACT assay was performed following the procedures described herein. Lane 1 represents the PCR results using primer pair #2961and #4161(5'-tctgcgccatcagggcagtgagac-3') labeled in pink in panel a; lane 2 represents the PCR results using primer pair #2961 and #4163 (5'-gccgcgcggccacttccgattcc-3') labeled in orange in panel a; lane 3 represents the PCR results using primer pair #2961 and #5145 (5'-gccatgcaggtaggatttgagctg-3') labeled in blue in panel a; lane 4 represents the PCR results using primer pair #2961 and #5151(5'-gtctcaaataggggccagctagcttgg-3') labeled in green in panel a. Unique bands that appear only in normal colon tissue are labeled by yellow arrows, and those bands that appeared only in colon cancer tissue are labeled in red arrows. ICR, imprinting control region; DMR, different methylated region.
Discussion
Dekker et al. developed the chromosome conformation capture (3C) approach to detect the frequency of interaction between two genomic loci1, and 3C has been used extensively to investigate intra-chromosomal and inter-chromosomal associations between two known DNA regions in mammalian cells2-9. Although newly developed Hi-C methodology can be applied for study of genome-wide DNA association, ACT assay is still an effective technique for study of locus-specific DNA interaction10-11. We have modified this approach to identify unknown DNA regions that are associated with a known DNA region in cultured mouse and human cells (Figure 1). We named this method the associated chromosome trap (ACT) assay, as it provided us a reliable and reproducible method to identify novel unknown DNA partners that associate with a known target DNA region12. A successful 3C assay with appropriate controls is performed before executing the novel aspects of the ACT assay13. In order tofind as many associated DNA regions as possible, it is necessary to use various combinations of first and second restriction enzymes. It is especially important to use restriction enzymes that are insensitive to CpG methylation to perform the first 3C ligation step. Protein binding and DNA methylation can also influence restriction enzyme digestion efficiency and can lead to failure of ligation of the associated DNA regions for certain restriction enzyme digestions. The occurrence of intra- or inter-chromosomal ligation depends on protein-DNA cross-linking and appropriate physical maps of both of the associated DNA regions. Thus, some preliminary experiments are essential to establish a practicable effective formaldehyde concentration and treatment time in the ACT assay. A range of final concentrations of formaldehyde (from1.5% to 2%) have been used in several labs during the 3C portion of the assay7,9. Alternatively, the oligonucleotides used as linkers can be designed to match the cohesive end cut by the second restriction enzyme. Although we found that 18-20 cycles in the first round of PCR and 20-25 cycles in the second round of PCR could provide clear bands, it is necessary to establish the best PCR conditions for each experiment (Figure 2).Intra-molecule annealing between 5'-end and 3'-end complementary adaptor sequence of a DNA strand may occur in PCR, it inhibits adaptor-specific primer annealing with the DNA molecule, and resulted in much lower amplification efficiency in the first several cycles. After the target DNA was amplified for cycles, its amount may be much larger than these nonspecific reactions, and may facilitate the competition of primer annealing to the target DNA molecules. This is also why we may see background amplification, and why the first round PCR product has to be diluted to decrease background amplification.It is important to remove excess primers from the PCR reaction in order to decrease the background in the second round of PCR. As in all PCR-based experiments, it is vital to design primers that are not located in repeat sequence regions, which constitute the majority of human and mouse DNA. Although newly developed Hi-C methodology can be applied for study of genome-wide DNA association, ACT assay is still an effective technique for study of locus-specific DNA interaction.
Disclosures
No conflicts of interest declared.
Acknowledgments
We thanks Adelle Murell and Wolf Reik very much for sharing their 3C protocol. This work was supported by the Department of Defense and the Research Service of the Department of Veterans Affairs.
References
- Dekker J, Rippe K, Dekker M, Kleckner N. Capturing chromosome conformation. Science. 2002;295:1306–1311. doi: 10.1126/science.1067799. [DOI] [PubMed] [Google Scholar]
- Apostolou E, Thanos D. Virus Infection Induces NF-kappaB-dependent interchromosomal associations mediating monoallelic IFN-beta gene expression. Cell. 2008;134:85–96. doi: 10.1016/j.cell.2008.05.052. [DOI] [PubMed] [Google Scholar]
- Duan Z. A three-dimensional model of the yeast genome. Nature. 2010;465:363–367. doi: 10.1038/nature08973. [DOI] [PMC free article] [PubMed] [Google Scholar]
- Lomvardas S. Interchromosomal interactions and olfactory receptor choice. Cell. 2006;126:403–413. doi: 10.1016/j.cell.2006.06.035. [DOI] [PubMed] [Google Scholar]
- Murrell A, Heeson S, Reik W. Interaction between differentially methylated regions partitions the imprinted genes Igf2 and H19 into parent-specific chromatin loops. Nat Genet. 2004;36:889–893. doi: 10.1038/ng1402. [DOI] [PubMed] [Google Scholar]
- Schoenfelder S. Preferential associations between co-regulated genes reveal a transcriptional interactome in erythroid cells. Nat Genet. 2010;42:53–61. doi: 10.1038/ng.496. [DOI] [PMC free article] [PubMed] [Google Scholar]
- Spilianakis CG, Lalioti MD, Town T, Lee GR, Flavell RA. Interchromosomal associations between alternatively expressed loci. Nature. 2005;435:637–645. doi: 10.1038/nature03574. [DOI] [PubMed] [Google Scholar]
- Vakoc CR. Proximity among distant regulatory elements at the beta-globin locus requires GATA-1 and FOG-1. Mol Cell. 2005;17:453–462. doi: 10.1016/j.molcel.2004.12.028. [DOI] [PubMed] [Google Scholar]
- Xu N, Tsai CL, Lee JT. Transient homologous chromosome pairing marks the onset of X inactivation. Science. 2006;311:1149–1152. doi: 10.1126/science.1122984. [DOI] [PubMed] [Google Scholar]
- Lieberman-Aiden E. Comprehensive mapping of long-range interactions reveals folding principles of the human genome. Science. 2009;326:289–293. doi: 10.1126/science.1181369. [DOI] [PMC free article] [PubMed] [Google Scholar]
- Berkum NLvan. Hi-C: a method to study the three-dimensional architecture of genomes. J Vis Exp. 2010. [DOI] [PMC free article] [PubMed]
- Ling JQ. CTCF mediates interchromosomal colocalization between Igf2/H19 and Wsb1/Nf1. Science. 2006;312:269–272. doi: 10.1126/science.1123191. [DOI] [PubMed] [Google Scholar]
- Dekker J. The three 'C's of chromosome conformation capture: controls, controls, controls. Nat Methods. 2006;3:17–21. doi: 10.1038/nmeth823. [DOI] [PubMed] [Google Scholar]