Abstract
Objective
To assess the accuracy and reproducibility of dual-energy absorptiometry (DXA; PIXImus™) and time domain nuclear magnetic resonance (TD-NMR; Bruker Optics) for the measurement of body composition of lean and obese mice.
Subjects and measurements
Thirty lean and obese mice (body weight range 19–67 g) were studied. Coefficients of variation for repeated (x 4) DXA and NMR scans of mice were calculated to assess reproducibility. Accuracy was assessed by comparing DXA and NMR results of ten mice to chemical carcass analyses. Accuracy of the respective techniques was also assessed by comparing DXA and NMR results obtained with ground meat samples to chemical analyses. Repeated scans of 10–25 gram samples were performed to test the sensitivity of the DXA and NMR methods to variation in sample mass.
Results
In mice, DXA and NMR reproducibility measures were similar for fat tissue mass (FTM) (DXA coefficient of variation [CV]=2.3%; and NMR CV=2.8%) (P=0.47), while reproducibility of lean tissue mass (LTM) estimates were better for DXA (1.0%) than NMR (2.2%) (<P 0.05). Regarding accuracy, in mice, DXA overestimated (vs chemical composition) LTM (+1.7 ± 1.3 g [SD], ~ 8%, P <0.001) as well as FTM (+2.0 ± 1.2 g, ~ 46%, P <0.001). NMR estimated LTM and FTM virtually identical to chemical composition analysis (LTM: −0.05 ± 0.5 g, ~0.2%, P =0.79) (FTM: +0.02 ± 0.7 g, ~15%, P =0.93). DXA and NMR-determined LTM and FTM measurements were highly correlated with the corresponding chemical analyses (r2=0.92 and r2=0.99 for DXA LTM and FTM, respectively; r2=0.99 and r2=0.99 for NMR LTM and FTM, respectively.) Sample mass did not affect accuracy in assessing chemical composition of small ground meat samples by either DXA or NMR.
Conclusion
DXA and NMR provide comparable levels of reproducibility in measurements of body composition lean and obese mice. While DXA and NMR measures are highly correlated with chemical analysis measures, DXA consistently overestimates LTM and FTM (by ~8% and ~46%, respectively), while NMR only slightly underestimates LTM (by ~0.2%) and overestimates FTM (~15%.) The NMR method also has practical advantages compared to DXA, such as speed of measurement and the ability to scan unanesthetized animals.
Keywords: DXA, NMR, adiposity, obesity
Introduction
Dual-energy X-ray absorptiometry (DXA) and time domain nuclear magnetic resonance (TD-NMR) instruments enable non-invasive, serial in-vivo body composition analysis in small animals. Such measurements are critical to understanding the physiology of energy homeostasis and control of body weight and composition. The relative performance of these techniques is important in this regard.
DXA was originally designed to measure bone density non-invasively, but is now widely used for body composition measurements in humans for both clinical and research purposes [1–9]. Body composition analysis by DXA is based on the characteristic “signatures” of differential attenuation of low and high energy x-rays by specific tissues [10]. NMR was first used in body composition assessment to image and quantify subcutaneous adipose tissue in humans, and has since become an important method for characterizing whole-body and regional adipose tissue and muscle mass [11]. NMR uses the contrasting hydrogen density and/or hydrogen spin properties of soft tissues when sequences of radio frequency (RF) magnetic fields are applied [12].
In general, DXA systems display high reproducibility, but the accuracy of measurements (compared to chemical analysis) varies, especially estimates of fat tissue mass. For example, the accuracy of body composition measurements decreases with increasing sample thickness due to ‘beam-hardening’ (the preferential loss of low energy photons relative to high energy photons when object thickness increases [13].)
Several validation studies of the DXA body composition analysis in mice and lemmings have been performed using the Norland Sabre [14, 15] and the PIXImus™ instruments [16, 17]. Using three serial scans of lean (19–29 g) C57BL/6J mice, Nagy et al [17] found the reproducibility of the PIXImus™ measurements to range from a minimum coefficient of variation (CV) of 0.84% for bone mineral density (BMD), to a maximum CV of 2.20% for fat tissue mass (FTM) [17]. However, when compared to the values obtained by chemical carcass analysis, DXA greatly overestimated FTM (by 109%), and significantly underestimated lean tissue mass (LTM) (by 3%) [17]. Brommage [18] used a larger range of body weights in mice (23–55 g) and found the PIXImus™ to overestimate fat mass (in comparison to chemical carcass analysis) by ~ 20%.
Small animal NMR has major advantages including the speed of measurements (<2 minutes) and the ability to study unanesthetized animals [11, 19–21]. However, validation studies of NMR instruments are currently limited. Taicher et al [12] examined the precision and accuracy of the NMR (EchoMRI), compared to DXA and chemical carcass analysis. They found higher precision of NMR (vs DXA) for measurements of fat content in lean and obese mice. In diet-induced obese (DIO) mice, the CVs for fat mass by NMR and DXA were 0.34% and 9.59%, respectively. While the NMR and DXA both significantly overestimated fat mass (by 42.2 and 40.0%, respectively) compared to chemical carcass analysis (P<0.02), NMR fat mass estimates (r2=0.74) correlated better than DXA (r2=0.59) with chemical analysis of non-obese animals [12].
The study presented here was undertaken to compare directly the reproducibility and accuracy of determinations made using the PIXImus™ (GE Lunar, Madison, WI) peripheral densitometer and Bruker Minispec Live Mice Analyzer (Bruker Optics Inc, The Woodlands, TX) in lean and obese mice, and to assess the impact of sample mass on both techniques. We assessed reproducibility using lean and obese mice (wt range 19–67 g) and determined accuracy by comparing instrument assessments to chemical carcass analysis. We tested the effects of sample size on the instruments’ respective abilities to determine fractional fat content by comparing measurements for ground meat samples of known composition shaped into targets of different mass.
Methods
Animals
For the DXA and NMR mouse experiments, twenty-six males and four females were used. To insure a wide range of body compositions, we used mice aged 1–9 months of different genetic strains, some segregating for the obesity mutation Lepob: B6.V-LepobLepob/J; Lepob/+; C57BL/6J, B6.Cg-Ay/J; 129/Sve; and C3HeB/FeJ. Animals were housed in a 12:12-hour light:dark cycle. Most animals were being used in other experiments related to energy homeostasis. Animals were sacrificed by carbon dioxide asphyxiation. Study protocols were approved by the Institutional Animal Care and Use Committees (IACUC) St. Luke’s-Roosevelt Hospital and Columbia University.
Meat samples
For experiments assessing the effect of sample mass and fat distribution on DXA and NMR accuracy of measuring fat content, a group of eight types of ground meat samples containing various nominal percentages of fat was purchased from a local supermarket. Fat content was determined by us by chemical analysis: 1) sausage @ 21.9% fat; 2) veal @ 15.1% fat; 3) pork @ 14.6% fat; 4) beef @ 14.2% fat; 5) beef @ 12.2% fat; 6) beef @10.9% fat; 7) turkey @ 6.7% fat; 8) turkey @ 2.1% fat. Each type of ground meat was divided into three sample masses (approximate): 25 g, 15 g, and 1g.
Chemical carcass analysis
Mouse chemical carcass analysis was performed in the Nagy Lab at the University of Alabama, Birmingham as previously described [17]. Frozen carcasses were thawed at room temperature. After removal of the stomach and intestines, the mice were weighed (eviscerated weight) and dried at 60 °C until constant weight (approximately 7 days). Water content was determined as the weight lost during drying. The dried carcasses were then ground using a mortar and pestle and placed in a weighed cellulose thimble. The thimbles were placed in a soxhlet apparatus overnight, for fat extraction using petroleum ether as the solvent. The weight lost during the extraction was the fat content. The fat-free dry mass remaining was placed in porcelain crucibles, weighed, and ashed in a muffle furnace at 600° C overnight. The remaining ash was an estimate of bone mineral content.
Meat sample chemical analysis
Meat sample chemical analysis was performed at the New York Obesity Research Center. Samples were autoclaved at 125°C in 50–60 ml distilled water for 30 min, cooled, and homogenized in a Polytron for 7–10 min. Twenty-five-milliliter aliquots were stored at −10 °C before chemical analysis. Total water was determined by drying duplicate 1 g samples of homogenate overnight at 90 °C to stable weight. Total lipid was determined in triplicate by chloroform:methanol extraction of homogenate samples [22]. Nitrogen was determined by an adaptation of the Kjeldahl method [23, 24]; protein content was calculated, assuming a nitrogen-to-protein mass ratio of 0.16. Fat-free dry mass was combusted at 600°C overnight to determine ash content.
DXA analysis
Mice were scanned using a Lunar PIXImus™ densitometer (GE Medical-Lunar, Madison, WI). The PIXImus™ employs a cone beam X-ray source generating energies at 35 and 80 keV. The detector is flat (100 × 80 mm), comprised of individual pixels of 0.18 × 0.18 mm. To calibrate the instrument, an aluminum/lucite phantom (corresponding to BMD = 0.0592 g/cm2, and 12.5% fat) was analyzed on each day of testing according to the manufacturer’s instructions. Dead mice were placed prone on the imaging positioning tray for the duration of each scan, approximately five minutes.
NMR analysis
Mice were scanned using the Bruker Minispec Live Mice Analyzer (model mq7.5, the “LF50”) (Bruker Optics, Inc). The Minispec is a time domain nuclear magnetic resonance (TD-NMR) system which acquires RF signals generated by the hydrogen spins from soft tissues such as adipose and muscle, and uses the contrast in relaxation times of the hydrogen spins, or the amplitude, duration, and spatial distribution of these NMR signals from the different tissues to estimate composition [12]. The instrument was calibrated for these studies using NMR scans and chemical composition data from 20 mice (body weight range 19–67 g.) On each day of testing, a quality control check of internal voltages, temperature, magnets, and NMR parameters was performed using a standard provided by the manufacturer. Animals were placed in a clear, plastic cylinder (50 mm diameter) and kept immobile by insertion of a tight fitting plunger into the cylinder. The tube was then lowered into the sample chamber of the instrument for approximately 2 minutes, the duration of the scan.
Procedures
Experiment 1: Reproducibility of DXA and NMR body composition measures in lean and obese mice
In the NMR experiments, thirty lean and obese mice weighing 19.2–66.9 g were scanned four times on a single day. One mouse died during the fourth NMR scan, and its data are excluded from the Experiment 1 NMR analysis. In the DXA experiments, the same 30 lean and obese mice were killed by carbon dioxide asphyxiation immediately prior to being scanned by DXA four times without repositioning. Technical problems with the DXA machine arose during the fourth scan of one mouse and its data are excluded from the Experiment 1 DXA analysis.
Experiment 2: Accuracy of DXA and NMR measures of mice and ground meat compared to chemical analysis
In the DXA and NMR experiments, the ten mice from Experiment 1 were frozen at −20 °C until performance of chemical carcass analysis. One scan by DXA and NMR in each mouse was compared to chemical carcass analysis for assessment of accuracy of measurements. Additional analyses of accuracy were performed using eight 30 g ground meat samples that differed in fat and lean tissue composition. Meat samples were scanned one time by DXA and NMR. The samples were frozen at −20 °C in sealed plastic bags until chemical analysis.
Experiment 3: Accuracy of DXA and NMR measures of ground meat samples of varying sample mass
To assess the effects of small changes in sample mass on measurement accuracy of DXA and MRI, ground meat samples of different fat and lean composition were each divided into three approximate sizes: 25 g, 15 g, and 10 g. Each sample was shaped into a sphere and scanned two times by DXA and NMR on the same day, and the respective results were averaged.
Data analysis
The PIXImus™ software version 1.46 (GE Medical-Lunar, Madison, WI) was used to analyze all DXA input to calculate body composition. The Bruker Minispec NMR software OPUS Version 5.5 was used to calculate body composition from NMR data.
Data from Experiment 1 were used to determine intra-individual coefficients of variation (CV) of same-day DXA and NMR measurements. Data from Experiments 2 and 3 were used to determine DXA and NMR accuracy using chemical composition as a standard. Prediction equations were generated by stepwise regression analysis (backward elimination), with DXA- or NMR-determined FTM and LTM as the starting independent variable. Variables were eliminated if P > 0.1. All data were analyzed using SAS (version 9.00, SAS Institute Inc., Cary, NC), or Statistica (version 6.0, Statsoft, Inc., Tulsa, OK) licensed to Columbia University Health Sciences.
Results
Experiment 1: Reproducibility of DXA and NMR body composition measures in lean and obese mice
We calculated the mean intra-individual within-day CV for the four DXA and NMR measures on each of 29 mice (body weight range: 19.2–66.9 g) (Tables 1 and 2). Reproducibility in estimating fat mass was equivalent for NMR (2.8%) v. DXA (2.3%) (P =0.47), but DXA estimates of lean mass were more reproducible than NMR estimates (NMR: 2.2% vs DXA: 1.0%, P <0.05). There was not a significant relationship between body weight and CVs of DXA lean measurements of the animals (r=0.27, P=0.08), yet there was a negative correlation between body weight and CVs of fat measurements (r=−0.34, P=0.04). In the NMR analyses, there were no significant correlations between body weight and CVs. (Lean mass measurements: r=0.11, P=0.28; fat mass measurements: r=−0.26, P=0.09).
Table 1.
Experiment 1: Within-day variation of repeated DXA measures (four scans) of each mouse.
| Variable | Mice weighing 19.2–66.9 g (n=29) | Mice weighing < 50 g (n=25) | ||
|---|---|---|---|---|
| DXA composition* | CV (%) | DXA composition* | CV (%) | |
| FTM (g) | 13.0 ± 11.8 (2.1–42.5) | 2.3 ± 2.1 (0.0–10.6) | 8.8 ± 5.9 (2.1–18.8) | 2.5 ± 2.1 (0.0 −10.6) |
| LTM (g) | 24.0 ± 3.8 (17.4–30.6) | 1.0 ± 0.9 (0.2–4.2) | 23.2 ± 3.4 (17.4–28.6) | 1.0 ± 0.9 (0.2–4.2) |
| TTM (g) | 36.9 ± 15.0 (20.0–71.6) | 0.5 ± 1.1 (0.0–4.3) | 32.1 ± 9.1 (20.0–44.9) | 0.5 ± 1.0 (0.0–4.3) |
| BMD (g/cm2) | 0.0578 ± 0.0084 (0.0433–0.0711) | 1.20 ± 1.33 (0.07–5.54) | 0.0576 ± 0.0088 (0.0433–0.0711) | 1.09 ± 1.10 (0.07–4.63) |
| BMC (g) | 0.492 ± 0.107 (0.293–0.642) | 2.72 ± 2.43 (0.56–11.94) | 0.482 ± 0.110 (0.293–0.642) | 2.39 ± 1.77 (0.56–6.99) |
Values are arithmetic mean ± SD with the range in parenthesis (*means of the four scans were used to estimate the mean body composition). Twenty-nine mice of various strains were used for the experiment. FTM: fat tissue mass; LTM: lean tissue mass; TTM: total tissue mass; BMD: bone mineral density; BMC: bone mineral content.
Table 2.
Experiment 1: Within-day variation of repeated NMR measures (four scans) of each mouse.
| Variable | Mice weighing 19.2–66.9 g (n=29) | Mice weighing < 50 g (n=26) | ||
|---|---|---|---|---|
| NMR composition* | CV (%) | NMR composition* | CV (%) | |
| Fat mass (g) | 9.2 ± 9.3 (1.2–36.8) | 2.8 ± 2.7 (0.0–10.0) | 6.6 ± 5.0 (1.2–14.8) | 3.0 ± 2.8 (0.0 −10.0) |
| Lean mass (g) | 21.9 ± 4.2 (15.2–29.0) | 2.2 ± 1.0 (0.6–5.0) | 21.2 ± 3.9 (15.2–27.9) | 2.1 ± 1.1 (0.6–5.0) |
| Free body fluid (g) | 2.4 ± 0.4 (1.6–3.5) | 5.3 ± 2.7 (2.2–12.8) | 2.3 ± 0.3 (1.6–2.9) | 5.0 ± 2.4 (2.1–9.1) |
Values are arithmetic mean ± SD with the range in parenthesis (*mean data from all four scans were used to calculate the mean body composition). Twenty-nine mice of various strains were used for the experiment.
According to the manufacturer, the PIXImus™ is intended for measurements of animals ranging from 10–50 g in body weight. We therefore performed a separate analysis to determine whether exclusion of animals weighing 50 g or more would impact measures of reproducibility. When animals weighing over 50g were excluded from the analysis, DXA reproducibility measures were not significantly altered; the CVs went from 2.3 to 2.5% for FTM (P=0.78), and were held constant at 1.0% for LTM (P=0.86). The Minispec (NMR) manufacturer specifies that the instrument is intended for animals up to ~80 g. In agreement, exclusion of >50 g animals did not affect reproducibility in the NMR measures (data not shown.)
Experiment 2: Accuracy of DXA and NMR tissue composition measures of mice and ground meat samples compared to chemical analysis
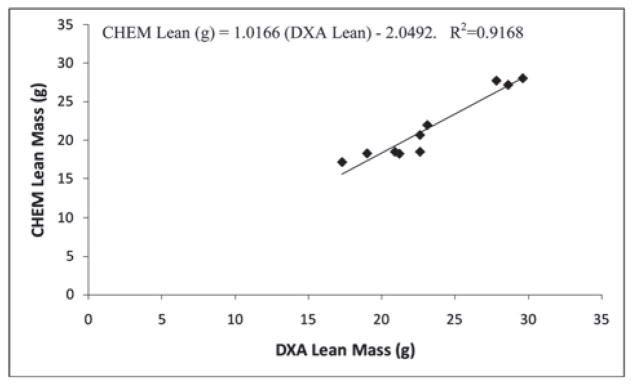
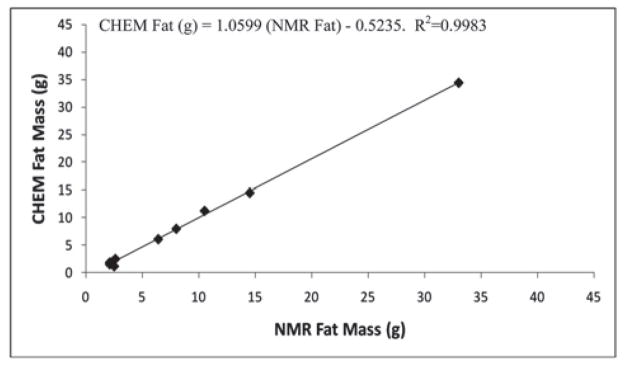
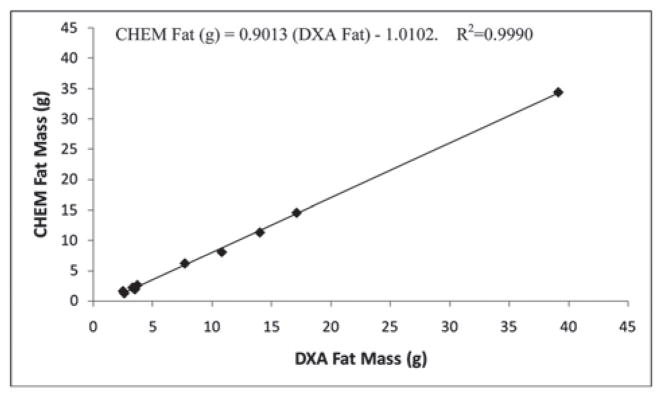
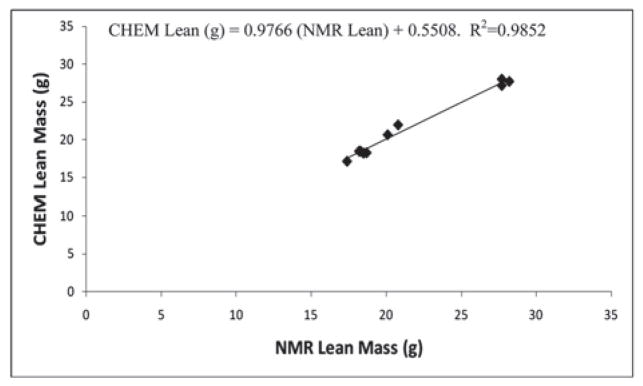
Accuracy of the PIXImus™ instrument was assessed by comparing DXA measures of body composition in ten mice (body weight range 21.6–66.9 g) to chemical carcass analysis (CHEM). CHEM LTM was significantly overestimated by DXA (+1.7 ± 1.3 g, ~ 8%, P<0.001); likewise, CHEM FTM was overestimated by DXA (+2.0 ± 1.2 g, ~ 46%, P<0.001) (Table 3). NMR determinations were not significantly different from CHEM LTM and FTM. (LTM: −0.05 ± 0.5g, ~0.2%, P=0.79; FTM: +0.02 ± 0.7g, ~15%, P=0.93) (Table 3). DXA and NMR-determined LTM and FTM measurements were highly correlated with the corresponding chemical analyses (r2=0.92 and r2=0.99 for DXA LTM and FTM, respectively; r2=0.99 and r2=0.99 for NMR LTM and FTM, respectively) (Tables 4, 5). The DXA and NMR data were used to predict chemically-determined values for LTM and FTM by regression analysis of mouse body composition data (Figures 1–4). For DXA analysis comparisons: CHEM Lean (g) = 1.0166 (DXA Lean) − 2.0492; CHEM Fat (g) = 0.9013 (DXA Fat) − 1.0102. For NMR analysis comparisons: CHEM Lean (g) = 0.9766 (NMR Lean) + 0.5508; CHEM Fat (g) = 1.0599 (NMR Fat) − 0.5235.
Table 3.
Experiment 2: Over/underestimation of DXA and NMR measures compared to chemical analyses of fat and lean mass values.
| DXA | NMR | |
|---|---|---|
| LTM | +8.3 ± 7.1% (0.3–22.4) | −0.2 ± 2.5% (−5.3–2.4) |
| FTM | +46.0 ± 30.7% (13.7–109.4) | +14.7±32.0% (−6.9–101.4) |
Values are arithmetic mean ± SD with the range in parenthesis. Ten mice of various strains were used for the experiment.
Table 4.
Experiment 2: Accuracy of DXA compared to chemically-extracted carcass analysis.
| Variable | DXA | CHEM | Correlation coefficient (r2) |
|---|---|---|---|
| LTM (g) | 23.3 ± 4.1* (17.3–29.6) | 21.6 ± 4.4 (17.1–28.0) | 0.92 (P <.0.001) |
| FTM (g) | 10.4 ± 11.3* (2.5–39.1) | 8.4 ± 10.2 (1.2–34.4) | 0.99 (P <.0.001) |
| BMC vs total carcass ash (g) | 0.5 ± 0.1* (0.3–0.6) | 1.0 ± 0.2 (0.8–1.3) | 0.76 P <0.001) |
| TTM (g) | 33.7 ±14.9 (20.8–68.6) | 33.3±14.5 (21.7–66.9) | 0.99 (P <0.001) |
Values are arithmetic mean ± SD with the range shown in parenthesis.
DXA-derived values were significantly different from chemical carcass analysis (P <0.05). Ten mice were used in the experiment.
Table 5.
Experiment 2: Accuracy of NMR compared to chemically extracted carcass analysis.
| Variable | NMR | CHEM | Correlation coefficient (r2) |
|---|---|---|---|
| LTM (g) | 21.6 ± 4.5 (17.4–28.2) | 21.6 ± 4.4 (17.1–28.0) | 0.99 (P <0.001) |
| FTM (g) | 8.4 ± 9.6 (2.1–33.0) | 8.4 ± 10.2 (1.2–34.4) | 0.99 (P <0.001) |
Values are arithmetic mean ± SD with the range shown in parenthesis.
NMR-derived values were significantly different from chemical carcass analysis (p<0.05). Ten mice were used in the experiment.
Figure 1.
Experiment 2: Relationship of lean mass in mice measured by chemical carcass analysis (CHEM) versus DXA.
Figure 4.
Experiment 2: Relationship of fat mass of mice measured by chemical carcass analysis (CHEM) vs NMR.
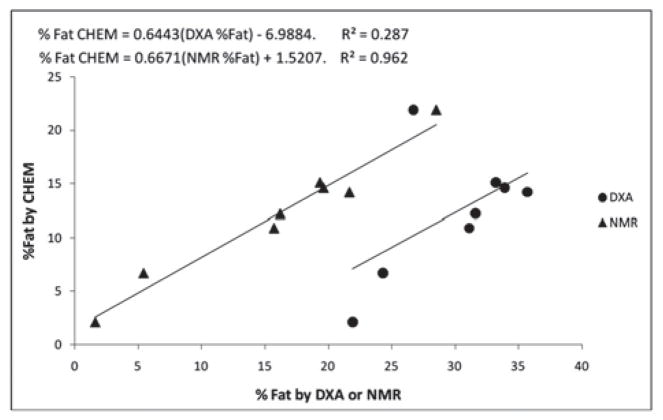
Accuracy of the DXA and NMR instruments in determining fat composition was also assessed by directly comparing DXA and NMR measures to chemical analysis in the same eight ground meat samples of varying composition (weight 30 g) (Table 6). The DXA instrument greatly overestimated percent fat compared to CHEM percent fat (by 17.6 ± 5.3% fat; that is, by ~140%, P<0.001). The NMR instrument also overestimated percent fat compared to CHEM percent fat, but to a lesser extent (3.8 ± 3.1% fat; that is, by ~31%, P=0.01). Regression analysis was used to determine the best predictors of CHEM percent fat of ground meat samples (Figure 5). The DXA estimates were not highly correlated with CHEM measures (R2=0.287; P=0.085), while NMR estimates were highly correlated to CHEM measures (R2=0.962; P<0.001).
Table 6.
Experiment 2: Accuracy of % fat estimate by DXA and NMR compared to chemically extracted ground meat.
| % Fat Sample | CHEM | DXA | NMR |
|---|---|---|---|
| 1 | 21.9 | 26.7 | 28.53 |
| 2 | 15.1 | 33.2 | 19.36 |
| 3 | 14.6 | 33.9 | 19.64 |
| 4 | 14.2 | 35.7 | 21.68 |
| 5 | 12.2 | 31.6 | 16.22 |
| 6 | 10.9 | 31.1 | 15.73 |
| 7 | 6.7 | 24.3 | 5.44 |
| 8 | 2.1 | 21.9 | 1.62 |
Values are percent fat for each of eight ground meat samples of differing fat content weighing 30 g. DXA-derived values were significantly different than CHEM (P <0.001). NMR-derived values were significantly different than CHEM (P =0.01).
Figure 5.
Experiment 2: Accuracy of DXA and NMR compared to chemically extracted ground meat % fat analysis.
Experiment 3: Accuracy of DXA and NMR measures in ground meat samples of varying sample mass
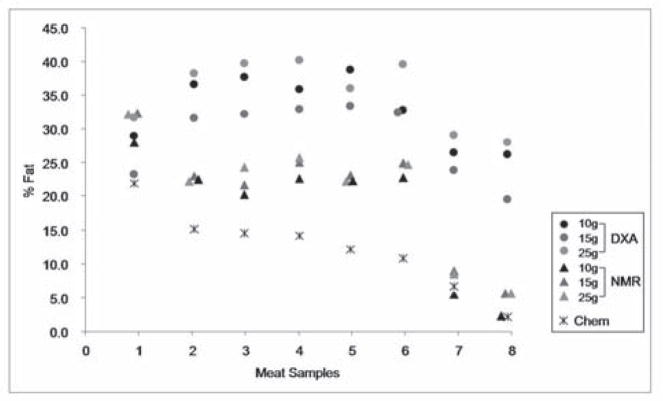
Eight ground meat samples (fat content ranging from 2.1–21.9%) were each divided into 25, 15, 10 gram aliquots to assess the accuracy of the DXA and NMR instruments in estimating fat composition in samples of different masses. We grouped the DXA and NMR results according to sample weight, and used the DXA or NMR-derived composition as the dependent variable, and the CHEM value of the samples as a covariate (Figure 6). By ANCOVA, the covariate CHEM percent fat had a statistically significant effect on DXA-derived percent fat, as predicted (F(1, 102.8) = 4.56, P=0.045), and the group effect (sample mass) was significant as well (F(2, 98.8) = 4.38, P = 0.026). A Tukey HSD post hoc test confirmed a significant increase in the percent fat by DXA when comparing the 25 g sample to the 15 g sample (P=0.02). However, estimates of percent fat with the 15 g and 25 g samples were not statistically different from estimates with the 10 g samples. In the NMR analyses, the covariate CHEM percent fat also had a statistically significant effect on NMR-derived fat composition (F(1,1366.7) = 112.2, P<0.001), while the group effect (sample weight) was not significant.
Figure 6.
Experiment 3: Effect of sample mass on accuracy of DXA and NMR percent fat measurements in ground meat samples. Data points are % Fat determined by DXA, NMR or Chemical Analysis. Each ground meat sample (1–8) was divided into three sizes (25g, 15g, 10g) and scanned by DXA and NMR. Samples included: 1) sausage @ 21.9% fat; 2) veal @ 15.1% fat; 3) pork @ 14.6% fat; 4) beef @ 14.2% fat; 5) beef @ 12.2% fat; 6) beef @10.9% fat; 7) turkey @ 6.7% fat; and 8) turkey @ 2.1% fat. Chemically derived % fat data (Chem) for each sample are provided.
Discussion
Experiment 1: Reproducibility of DXA and NMR body composition measures in lean and obese mice
Reproducibility of estimates of fat mass in mice by NMR (CV=2.8%) and DXA measurements (2.3%), as well as lean mass (NMR: 2.2% and DXA: 1.0%) was excellent for both techniques. Tinsley et al found NMR (EchoMRI) to give more reproducible fat mass estimates in mice than DXA (0.34% vs 9.59%, respectively, using DIO mice) [21]. We found that DXA-based estimates of lean mass had slightly lower CV than those obtained by NMR (1.0% vs 2.2%.)
Experiment 2: Accuracy of DXA and NMR tissue composition measures of mice compared to chemical analysis
We found that DXA significantly overestimated LTM (by ~8% vs CHEM LTM) and FTM (by ~46% vs CHEM FTM) (Table 3). NMR predictions of LTM and FTM were similar to CHEM values (with a non-significant 0.2% LTM underestimate, and 15% FTM overestimate.) (Table 3). As noted, Nagy et al found that DXA (PIXImusTM) overestimated FTM by 109% in mice [17]. Brommage found the same instrument to overestimate FTM by only ~ 20% [18], and we found an intermediate overestimate of ~46%. Tinsley et al found the DXA and NMR to overestimate FTM to the same degree (~40% in lean mice, ~25% in obese mice) [21]. We also assessed accuracy by comparing DXA and NMR measurements of percent fat in ground meat samples of varying fat content. DXA overestimated percent fat content by 140% on average, while NMR overestimated fractional fat content by 31%. DXA was most inaccurate in determining percent fat in samples with low fat content. For example, in the ground meat sample with the lowest fat content, (sample #8: 2.1% fat content by chemical analysis), DXA overestimated percent fat by ~940%, while NMR actually underestimated the percent fat in this sample by 4%. Thus, NMR would be the better method to assess samples with very low fat content.
Experiment 3: Accuracy of DXA and NMR measures in ground meat samples of varying mass
DXA and NMR both overestimated fat content in the ground meat samples of different mass (10 g, 15 g, 25 g) (Figure 6). For DXA, percent fat estimates differed significantly by sample weight, with measures in the largest sample (25 g) overestimating percent fat to a greater extent (by 324%) than in the 15 g sample (227%). There was no significant difference in measurements done on 25 g versus 10 g samples. This result prevents us from concluding that a larger (or smaller) sample mass would affect the degree to which DXA would overestimate fat content. There were no significant differences in the NMR percent fat estimates of samples of different sizes, though the NMR did overestimate fat mass in samples of all sizes. The greatest NMR overestimate occurred with the 25 g sample (by ~85%), and the least with the 10 g sample (by ~45%), though these estimates were not different from each other (P =0.44).
Conclusions
DXA and NMR are useful methods for assessing body composition in vivo. Our data suggest DXA (PIXImus™) and NMR (Minispec) provide excellent reproducibility in lean and obese mice. While DXA and NMR mouse body composition measures correlated equally well to chemical analysis measures, DXA consistently greatly overestimated FTM in the mice. Both techniques do offer additional independent advantages. The DXA machine measures bone content and density, while the NMR does not. However, the NMR possesses additional practical advantages, such as the speed of measurements and the ability to scan unanesthetized animals, which may favor its use in certain experimental contexts.
Figure 2.
Experiment 2: Relationship of fat mass in mice measured by chemical carcass analysis (CHEM) vs DXA.
Figure 3.
Experiment 2: Relationship of lean mass of mice measured by chemical carcass analysis (CHEM) vs NMR.
Acknowledgments
We wish to thank Lina Basilio for outstanding technical contributions.
This work was supported by RO1 DK64773; P30 DK26687 (NYORC); P30 DK56336 (UAB CNRU); and P60 DK079626 (UAB DRTC).
No funds or other assistance were received from the GE-Lunar Corp. or Bruker Optics, Inc. for the work presented in this study.
Appendix i
Table 7.
Experiment 3: Absolute fat grams measured by DXA and NMR in the 10, 15, 25 g ground meat samples.
| Fat (g) Sample | DXA | NMR | ||||
|---|---|---|---|---|---|---|
| 10 g | 15 g | 25 g | 10 g | 15 g | 25 g | |
| 1 | 4.4 | 4.6 | 9.3 | 3.2 | 5.2 | 6.9 |
| 2 | 5.4 | 6.4 | 12.3 | 2.6 | 3.9 | 5.6 |
| 3 | 5.4 | 6.7 | 11.9 | 2.2 | 3.8 | 6.0 |
| 4 | 5.2 | 6.5 | 16.1 | 2.7 | 4.2 | 8.8 |
| 5 | 5.4 | 6.8 | 13.3 | 2.6 | 3.8 | 6.2 |
| 6 | 4.8 | 6.6 | 10.5 | 2.7 | 4.3 | 5.1 |
| 7 | 4.0 | 4.7 | 12.5 | 0.8 | 1.7 | 3.5 |
| 8 | 3.9 | 3.7 | 12.7 | 0.3 | 1.1 | 2.3 |
References
- 1.Fuller NJ, Laskey MA, Elia M. Assessment of the composition of major body regions by dual-energy X-ray absorptiometry (DEXA), with special reference to limb muscle mass. Clin Physiol. 199;12(3):253–66. doi: 10.1111/j.1475-097x.1992.tb00831.x. [DOI] [PubMed] [Google Scholar]
- 2.Going SB, et al. Detection of small changes in body composition by dual-energy x-ray absorptiometry. Am J Clin Nutr. 1993;57(6):845–850. doi: 10.1093/ajcn/57.6.845. [DOI] [PubMed] [Google Scholar]
- 3.Jebb SA, Elia M. Techniques for the measurement of body composition: a practical guide. Int J Obes Relat Metab Disord. 1993;17(11):611–21. [PubMed] [Google Scholar]
- 4.Jensen MD, et al. Assessment of body composition with use of dual-energy x-ray absorptiometry: evaluation and comparison with other methods. Mayo Clin Proc. 1993;68(9):867–73. doi: 10.1016/s0025-6196(12)60695-8. [DOI] [PubMed] [Google Scholar]
- 5.Lands LC, et al. Accuracy of measurements of small changes in soft-tissue mass by dual-energy x-ray absorptiometry. Clin Invest Med. 1996;19(4):279–85. [PubMed] [Google Scholar]
- 6.Laskey MA, et al. The influence of tissue depth and composition on the performance of the Lunar dual-energy X-ray absorptiometer whole-body scanning mode. Eur J Clin Nutr. 1992;46(1):39–45. [PubMed] [Google Scholar]
- 7.Mazess RB, et al. Dual-energy x-ray absorptiometry for total-body and regional bone- mineral and soft-tissue composition. Am J Clin Nutr. 1990;51(6):1106–1112. doi: 10.1093/ajcn/51.6.1106. [DOI] [PubMed] [Google Scholar]
- 8.Pritchard JE, et al. Evaluation of dual energy X-ray absorptiometry as a method of measurement of body fat. Eur J Clin Nutr. 1993;47(3):216–28. [PubMed] [Google Scholar]
- 9.Svendsen OL, et al. Accuracy of measurements of body composition by dual-energy x-ray absorptiometry in vivo. Am J Clin Nutr. 1993;57(5):605–608. doi: 10.1093/ajcn/57.5.605. [DOI] [PubMed] [Google Scholar]
- 10.Pietrobelli A, et al. Dual-energy X-ray absorptiometry body composition model: review of physical concepts. Am J Physiol Endocrinol Metab. 1996;271(6):E941–951. doi: 10.1152/ajpendo.1996.271.6.E941. [DOI] [PubMed] [Google Scholar]
- 11.Mattsson S, Thomas BJ. Development of methods for body composition studies. Phy Med Biol. 2006;51(13):R203–R228. doi: 10.1088/0031-9155/51/13/R13. [DOI] [PubMed] [Google Scholar]
- 12.Taicher G, et al. Quantitative magnetic resonance (QMR) method for bone and whole-body-composition analysis. Anal Bioanal Chem. 2003;377(6):990–1002. doi: 10.1007/s00216-003-2224-3. [DOI] [PubMed] [Google Scholar]
- 13.Goodsitt MM. Evaluation of a new set of calibration standards for the measurement of fat content via DPA and DXA. Med Phys. 1992;19(1):35–44. doi: 10.1118/1.596890. [DOI] [PubMed] [Google Scholar]
- 14.Hunter HL, Nagy TR. Body composition in a seasonal model of obesity: longitudinal measures and validation of DXA. Obesity Res. 2002;10(11):1180–1187. doi: 10.1038/oby.2002.160. [DOI] [PubMed] [Google Scholar]
- 15.Sjogren K, et al. Body fat content can be predicted in vivo in mice using a modified dual-energy x-ray absorptiometry technique. J Nutr. 2001;131(11):2963–2966. doi: 10.1093/jn/131.11.2963. [DOI] [PubMed] [Google Scholar]
- 16.Iida K, et al. Precision, accuracy, and reproducibility of dual x-ray Absorptiometry measurements in mice in vivo. J Densitometry. 2003;6(1):25–33. doi: 10.1385/jcd:6:1:25. [DOI] [PubMed] [Google Scholar]
- 17.Nagy TR, Clair A-L. Precision and accuracy of dual-energy x-ray absorptiometry for determining in vivo body composition of mice. Obesity Res. 2000;8(5):392–398. doi: 10.1038/oby.2000.47. [DOI] [PubMed] [Google Scholar]
- 18.Brommage R. Validation and calibration of DEXA body composition in mice. Am J Physiol Endocrinol Metab. 2003;285(3):E454–459. doi: 10.1152/ajpendo.00470.2002. [DOI] [PubMed] [Google Scholar]
- 19.Echo Medical Systems 2006. Retrieved May 2007, from Echo Medical Systems website: http://www.echomri.com/index.html.
- 20.Bruker Optics. The Minispec 2007. Retrieved May 2007, from Bruker Optics, the minispec website: http://www.theminispec.com/LF/index.html.
- 21.Tinsley FC, Taicher GZ, Heiman ML. Evaluation of a quantitative magnetic resonance method for mouse whole body composition analysis. Obesity Res. 2004;12(1):150–160. doi: 10.1038/oby.2004.20. [DOI] [PubMed] [Google Scholar]
- 22.Folch J, Lees M, Stanley GHS. A simple method for the isolation and purification of total lipides from animal tissues. J Biol Chem. 1957;226(1):497–509. [PubMed] [Google Scholar]
- 23.Ferrari A. Nitrogen determination by a continuous digestion and analysis system. Ann N Y Acad Sci. 1960;87:792–800. doi: 10.1111/j.1749-6632.1960.tb23236.x. [DOI] [PubMed] [Google Scholar]
- 24.Peters J, Slyke DV. Quantitative clinical chemistry methods. Williams & Wilkins; Baltimore MD: 1942. p. 78. [Google Scholar]


