Abstract
A low-cost single-cell isolation system incorporating a digital versatile disc burner (DVD RW) optical pickup has been developed. We show that these readily available modules have the required laser power and focusing optics to provide a steady Gaussian beam capable of optically trapping micron-sized colloids and red blood cells. Utility of the pickup is demonstrated through the non-destructive isolation of such particles in a laminar-flow based microfluidic device that captures and translates single microscale objects across streamlines into designated channel exits. In this, the integrated objective lens focusing coils are used to steer the optical trap across the channel, resulting in the isolation of colloids and red blood cells using a very inexpensive off-the-shelf optical component.
OCIS codes: (140.2020) Diode lasers, (140.7010) Trapping, (140.5960) Semiconductor lasers, (170.4520) Optical confinement and manipulation, (170.1530) Cell analysis, (170.0180) Microscopy, (170.0170) Medical optics and biotechnology
1. Introduction
Single-cell isolation has become an important tool for biomedical researchers and clinicians interested in purifying and analyzing rare cells such as stem cells [1,2], circulating tumor cells [3], cells for genetic testing [4], infected cells [5], and rare bacteria that cannot be cultured in the laboratory [6]. Addressing this need and building on the contributions of single-cell flow cytometry in recent years [7], large commercial instruments including the Beckman/Coulter CyCLONE and the BD CloneCyt are now available for single-cell deposition into 96 well plates. Here, much of the instrumentation is designed to overcome the difficulties associated with the limiting dilution technique [8] for creating monoclonal systems from individual cells for subsequent study. Various smaller-scale alternative technologies used to isolate single cells have been developed and include dielectrophoretic traps [9–11], laminar flow based separations [12,13], assays with antigens that selectively adsorb to cells of interest [14] and optical trapping using lasers [12,15–18]. Most of these techniques can be difficult to implement practically and can require a relatively large volume of sample and/or reagent for analysis, further increasing the total complexity and cost. We contend that the use and application of single-cell isolation methods could be significantly expanded with an economically viable and compact single-cell sorter based on microfluidic platforms and available outside of central facilities and large laboratories.
To move toward this goal, we employ a low cost, 30 gram, 2 x 3.5 x 5 cm optical pickup assembly of a DVD RW drive to replace the table top setup for optical trapping and sorting of cells [12]. This widespread consumer electronics component has a high degree of technological content well suited to our scheme of identifying, trapping and sorting cells. As typically employed, the optical pickup is an electronically steered and stabilized microscope extracting information from tracks 0.74 μm wide at a linear velocity of ~4 m/s [19]. Because of these capabilities, the DVD optical pickup has been used to develop systems for interferometry [20], DNA chip detection [21], profile measurement [22], motion detection [23–25], biosensing and chemical analysis [26–28] and for confocal compact scanning optical microscopes [29]. Significant research and development has gone into the design of the components and the optics in the DVD pickup to improve performance and longevity. Because DVD discs contain high data density, this pickup requires high laser spot quality in the form of small spot size, circular Gaussian distribution, good parallelism, high alignment robustness, and stable power. While we will show here that the DVD burner laser diode can be used to optically trap individual cells, the integrated photodetector can also be used to characterize/identify cell structure and shape [30]. Furthermore, optical pickups are programmed to autofocus, making them ideal for managing vibrations in more difficult working environments. Despite the significant complexity of these devices, large scale commercial production has made them extremely inexpensive, with the entire optical pickup assembly here costing ~$10.
2. Experimental methods
2.1 DVD pickup and modifications
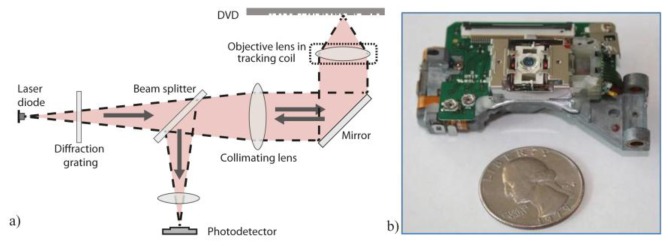
Figure 1a illustrates the core optics found in many DVD drive optical pickups. A laser beam, emitted from a diode, first passes through a diffraction grating, a polarizing beam splitter, a quarter wave plate integrated into the optics, and is then collimated and focused onto a DVD surface [23]. The reflected beam is subsequently directed back through the lens to reflect off the beam splitter and onto an integrated photodetector.
Fig. 1.
a) Schematic of an optical pickup displaying the laser diode, the tracking coil, the diffraction grating (subsequently removed for optical trapping experiments) and the photodetector along with other associated optics. b) Top view of the LPC-815 optical pickup employed in these studies.
In this work, an LPC-815 red long canned laser diode sled (20x DVD burner optical pickup) was used (Fig. 1b). The DVD burner laser diode is of 660 nm wavelength with typical output of ~200 mW at a maximum current of 360 mA. The numerical aperature (NA) of the optical pickup is ~0.6 with an objective focal distance of ~4 mm [19]. The DVD optical pickup has two laser diodes, one at infrared wavelengths for reading compact discs (CD) and one at red wavelengths for reading denser DVD’s. The optical pickup employs a three-beam approach to continuously monitor focus and tracking accuracy as it reads the DVD. To create multiple beams from one, a diffraction grating is used to separate the light into two first-order beams along with the central disc-reading beam. In our study the diffraction grating is removed from the optical path, increasing the power output of the primary beam to ~40 mW on the central focal point, enough to obtain stable optical trapping. Though only a fraction of the laser diode output is captured and utilized by the primary optics of the laser assembly, it can be focused down to an ~1 μm spot. Because the optics are designed to focus after passing through a 0.6 mm thick transparent polycarbonate coating (refractive index = 1.58) on the DVD, an equivalent 1 mm thick glass slide was added between the laser assembly and the trapping plane for better focusing in our investigations.
2.2 Microfludic sorter design and fabrication
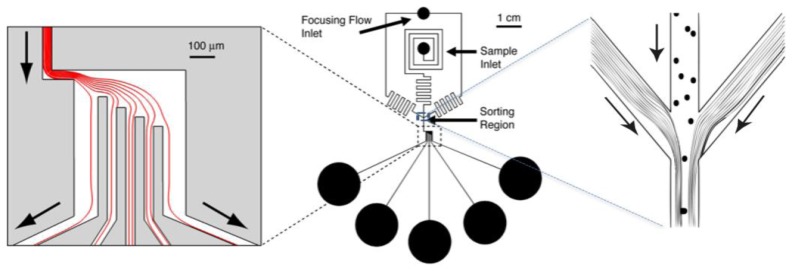
For isolation studies, a laminar flow based sorter was designed and simulated using COMSOL (see Fig. 2 ). In our studies and typical of microfluidic investigations, the flow is laminar with Re << 1; in addition however, because the associated Peclet numbers (Pe = aV/D, where V is velocity, a is the radius, and D is the diffusion coefficient) relating convection to diffusion are > 1000, red blood cells and colloids remain within streamlines unless external forces are applied. Our simulations demonstrate that a change of streamline can be used to precisely direct red blood cells and colloids to a particular exit channel for sorting and we use optical trapping to move cells to an exit of choice. Figure 2 demonstrates the microfluidic device fabricated based on the simulations where it is designed to first hydrodynamically focus a sample colloidal suspension to the center of the 100 μm wide channel. Down stream of focusing, the colloids are optically examined and trapped by the DVD laser and moved across streamlines by activating the tracking coil directing them to the intended reservoir.
Fig. 2.
Schematic of the microfluidic device with the arrow indentifying the optical tweezer translation region right after the hydrodynamic focusing zone (center) along with a magnified image of the laminar sorting section downstream (left) and the hydrodynamic focusing region upstream (right) that directs particles to the center of the channel and the laser focus. Due to the focusing, colloids that are not optically sorted drain into the middle reservoir. The fluidic channels are 100 μm wide and 10 μm tall.
To test our approach, microfluidic devices were fabricated in polydimethylsiloxane (PDMS) (Sylgard 184, Dow Corning) on glass slides using standard soft-lithography techniques [31]. In this, chrome plated glass masks were printed and used to selectively polymerize 10 μm thick KMPR 1010 photoresist (Kayaku Microchem) via UV exposure in a mask aligner (Karl Suss MJB3) on a silicon wafer to form the masters. These templates were then used to mold PDMS that was subsequently irreversibly bonded to glass slides using an oxygen plasma.
2.3 Experimental setup
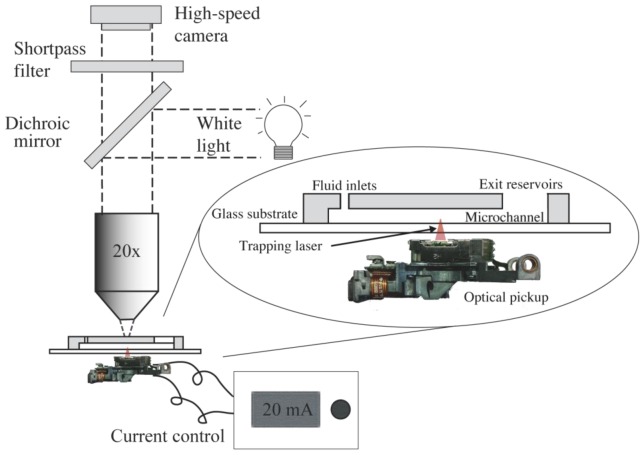
Imaging of our experiments was performed using a Nikon Labophot microscope with a 20x/.50 pol Zeiss objective using a Silicon Video high-speed SV9M001 camera. A 600 nm short-pass filter was used to prevent the laser from overexposing the camera during imaging. Figure 3 demonstrates the location of the components in the optical path of the experimental setup and the placement of the optical pickup right under the microfluidic device. The objective lens of the optical pickup rests on an electromagnetically suspended frame that can be steered to control focus and one-dimensional tracking over ~200 μm perpendicular to the tracks on a DVD. Taking advantage of the tracking coil to translate the laser, a current adjust (−20 mA to + 20 mA) power source was used to steer the objective and hence the trap to translate trapped red blood cells in one dimension across streamlines. Once a red blood cell was optically trapped using the laser, the tracking coil was activated by applying current to accurately move the trapped cell. Monodisperse polystyrene colloids (refractive index, RI ~1.59) of diameters 4 μm (Interfacial Dynamics, Inc.), 10 μm (Phosphorex Inc.), 15.6 μm (Bang Labs) and 21.4 μm (Duke Scientific) were used and sodium lauryl sulfate (0.05 g/ml, Fischer) was added to prevent agglomeration. Human red blood cells (RI ~1.37) were collected from volunteers and dispersed at low concentration in a 270 mOsm buffer (1.25% sodium citrate, Sigma Aldrich) with 0.167% bovine serum albumin (Sigma Aldrich) to prevent red blood cell adhesion to the channel walls.
Fig. 3.
Schematic of the experimental setup displaying the location of the optical pickup within the optical train.
2.4 Measurement and calibration of trap strength
The optical pickup was used to trap both polystyrene colloids and red blood cells, where the trap strength was determined by measuring the viscous drag required to break the particle out of the trap [17]. In this, the trap was translated within a microfluidic channel and the limiting velocity at which the trapped colloid was dragged out of the trap was measured. From this velocity, the trapping force was estimated using Stokes’ drag; however, Faxen’s law [32,33] was taken into consideration to account for proximity to the wall. In these measurements, the objective as driven by the tracking coil can be moved with the precision of a fraction of a μm, the minimum step size limited only by the resolution of the power source. The power source (LCS 350/R, Laser Diode Inc.) has a resolution of 1 mA corresponding to an observed step size of ~1 μm. Video of this motion was captured at 50 frames/s and motion tracking software (coded in C using OpenCV libraries) was developed to measure the velocities at which the colloid and red blood cells escaped from the trap (Fig. 4 , Media 1 (1.3MB, MOV) and Media 2 (1.7MB, MOV) ). The drag force on the particles at these escape velocities was approximated by the equation derived by Oseen [33] for a sphere moving in a fluid bounded by two parallel plates. According to Oseen’s approximation, the drag force F can be expressed as:
| (1) |
where μ is the viscosity and L1 and L2 are the distances of the colloid center from each wall. L1 and L2 were approximated by measuring the vertical movement of the platform as the microscope focus was translated from the top to the bottom surface. Due to the NA of the optics within the pickup, neither colloids nor red blood cells are trapped in 3D and are instead slightly pushed towards the top surface. As a result, typical values of L1 closely approximated the size of the colloid or red blood cell (~10 μm). L2 varied with the channel height and particle size and was observed to be ~35 μm in a typical experiment.
Fig. 4.
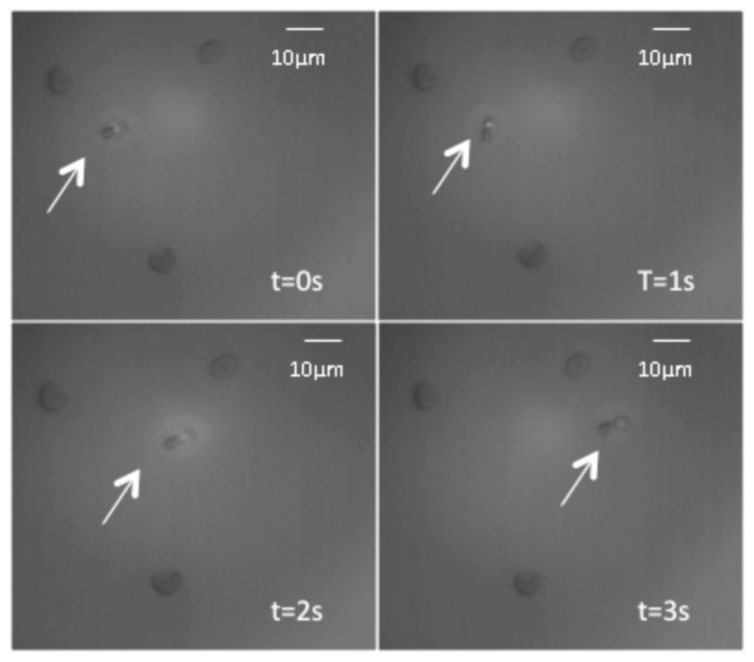
Time lapse images of the translation of a trapped red blood cell identified by the arrow. The other 3 cells are stationary and act as reference points ( Media 1 (1.3MB, MOV) ). Media 2 (1.7MB, MOV) shows similar experiments on colloids.
3. Results and discussion
From our optical trapping experiments within microfluidic geometries, it is clear that sufficient power and high enough NA exists within these DVD optical pickups to trap both high RI colloids and significantly lower RI red blood cells. However, because the NA is not high enough to overcome the optical scattering forces in this single-beam trapping experiment, it was observed that both the colloids and red blood cells are gently pushed onto the top wall of the device by the laser. Despite this, the measured maximum translational velocities observed when trapping at the highest applied currents are significant and shown in Fig. 5 for various colloid sizes along with red blood cells. As can be seen here, measured trap forces are on the order of tens of pN, comparable to those observed in stable traps achieved via other approaches. An almost linear dependence of trap strength on laser current (proportional to output power over our experimental range) was observed from a high and stable trapping at 360 mA to weak trapping at 100 mA. For red blood cells, the observed trap strength was lower than for polystyrene colloids as expected because of the significantly smaller RI mismatch with the surrounding medium (RI = 1.33). In addition, as the red blood cells were only partially swollen at these osmotic strengths (270 mOsm), the non-homogenity of the red blood cells and their conformation within the optical trap varied measured velocities and trap strengths.
Fig. 5.
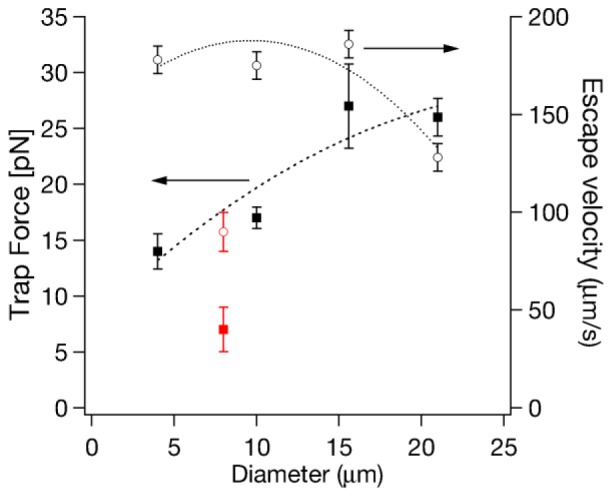
(left) Drag force (□) experimentally determined via measured escape velocities (◯, right). Black markers are polystyrene colloids, red markers correspond to red blood cells. Lines are guides to the eye.
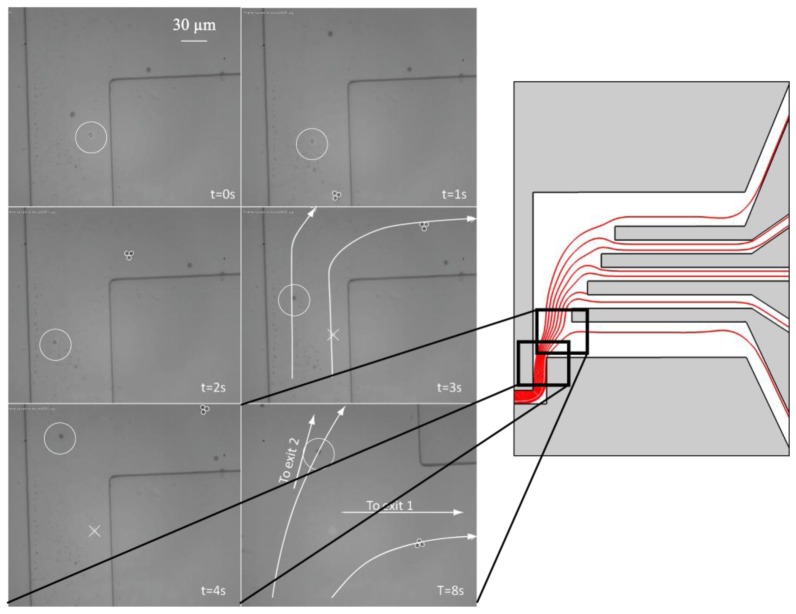
With trapping and translating capabilities demonstrated, we employ the geometry and design of Fig. 2 in the sorting of both colloids and red blood cells. We observed that the objective as controlled by the tracking coil is capable of laterally translating colloids 100 μm before beginning to lose focus. It was also observed that the autofocus coil could be controlled manually to continuously maintain the trap focus while translating the trap using the tracking coil. Figure 6 ( Media 3 (647.1KB, MOV) ) demonstrates the sorting of colloids in action. A 4 μm colloid is seen strongly trapped near the right wall of the channel, translated across the channel into a different streamline, ending up in the intended exit and released there as the trap snaps back to its original position ready for the next colloid of interest. Sorting was done at a conservative velocity of 50 μm/s to stably trap and translate colloids.
Fig. 6.
Time-lapse images of sorting in action. Circles track the trapped colloid, shifted across streamlines and sorted into exit 2. A reference 3-colloid aggregate is outlined that traverses the same streamline as the trapped colloid and takes exit 1. The vacant laser trap after colloid release is marked with an × . The attached schematic of the microfluidic device locates the field of view of the camera ( Media 3 (647.1KB, MOV) ).
With simple manual control as a proof of concept, the maximum rate red blood cell sorting achieved was ~20 min−1. Though high speed is not a major goal of a low-powered device such as this, it is instructive to calculate a theoretical limit on the device throughput based on our measured escape velocities. To provide an estimate for the maximum rate at which the DVD optical pickup can be used to trap colloids and translate them across streamlines, we use a 10 μm colloid with an escape velocity of 190 μm/s in a 100 μm channel. For consistent trapping a conservative colloid velocity should be 160 μm/s. For a Gaussian trap the maximum rate of translation across the streamlines perpendicular to the flow is also 160 μm/s. For the 100 μm wide channel with colloids focused at the center line, the time required for translation across streamlines was 0.31 s with 0.02 s for the trap to return, limiting the maximum number of sorts to 180 min−1 with an automated sorter. Similar results for red blood cell sorting lead to a limit of ~80 min−1. In addition, as the trap tends to push the red blood cells and colloids out of focus, the trap strength decreased with time spent by the object in the trap, decreasing the speed of translation over time. This can be overcome by programming the autofocus coil of the optical pickup to focus the trap continuosly in the object plane. It can be seen in Fig. 5 that the maximum trap velocities and trap strengths occur at moderate colloid diameters and the stability of the trap will fall rapidly, rendering this setup ineffective for sorting particles larger than 20 μm.
4. Conclusion
We have demonstrated that a DVD optical pickup assembly can be used to optically trap and sort colloids and red blood cells. Experimental results show trap strengths of 5-30 pN can be used for single-cell isolation in a laminar flow based microfluidic sorter using only the integrated tracking coil to direct cells across streamlines and to specific outlets. This is clearly a very low-cost alternative to significantly more expensive full-scale instrumentation, appropriate for applications where relatively low trapping power and trap strength are not significant issues.
Acknowledgments
We acknowledge support from the National Institutes of Health under grant 1R01 AI079347-01 and thank Kevin Roth and Tobias Sawetzki for useful discussions.
Supplemental information
S1. Setting up the DVD scanning optical trap
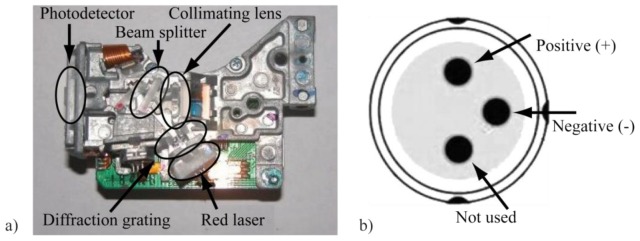
LPC-815 LG optical pickups were purchased from an online store (www.higtechdealz.com) for ~ $10 apiece; here, adequate care was taken to avoid damage due to static charge while handling the devices once removed from their packaging. Figure 7a
Fig. 7.
a) Back view of the LPC-815 optical pickup with the major components identified. b) Pin configuration of the red laser for the wiring.
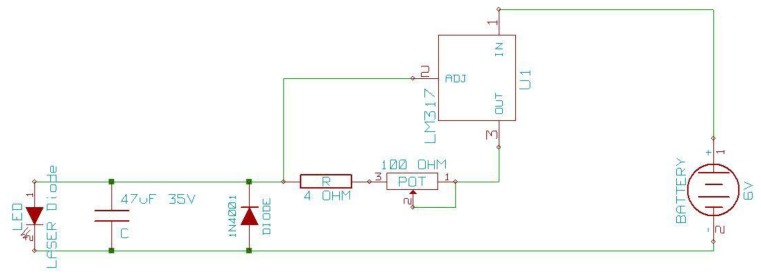
shows the location of the red laser diode in the optical pickup and Fig. 7b shows the pin-out configuration and the positive and negative leads for wiring the red laser diode. To power the diode in our demonstrations, one of two power sources was used, either a current control source (LCS 350/R, Laser Diode Inc.) or a simple battery-powered circuit (Fig 8
Fig. 8.
Circuit diagram of the 420 mA laser driver used to operate the optical trap using a battery power source. A trapping power of ~60 mW was measured.
) fabricated in the laboratory. In this, the recommended operating voltage for the diode is from 1.8 to 3.2 V with a maximum current rating of 0.5 A. The laser power at 660 nm was observed to peak at ~250 mW before the diode burned out. In using the battery and associated circuit to power the laser at 420 mA, we achieved a stable trapping power of ~60 mW for 45 min.
The tracking coil consists of a simple electromagnet suspended between two permanent magnets where the electromagnet polarity and strength control the direction and extent of its translation. Figure 9
Fig. 9.
Side view with pin-outs identified for wiring the tracking coil.
shows the location of the tracking coil electrical contacts in the optical pickup configuration of the LPC-815. Here the focus coil control leads (F + and F-), tracking coil control leads (T + and T-), and the rotation coil control leads (R + and R-) are identified. All of these are easily connected to an external current control source; in our studies −20 to + 20 mA was used to precisely control the tracking coil. The rotation coil and the focus coil can be similarly wired and controlled to rotate the objective or change the focus plane of the objective.
References and links
- 1.Uchida N., Buck D. W., He D., Reitsma M. J., Masek M., Phan T. V., Tsukamoto A. S., Gage F. H., Weissman I. L., “Direct isolation of human central nervous system stem cells,” Proc. Natl. Acad. Sci. U.S.A. 97, 14720–14725 (2000). 10.1073/pnas.97.26.14720 [DOI] [PMC free article] [PubMed] [Google Scholar]
- 2.Kekarainen T., Mannelin S., Laine J., Jaatinen T., “Optimization of immunomagnetic separation for cord blood-derived hematopoietic stem cells,” BMC Cell Biol. 7(1), 1–10 (2006). 10.1186/1471-2121-7-30 [DOI] [PMC free article] [PubMed] [Google Scholar]
- 3.Sieben S., Bergemann C., Lubbe A., Brockmann B., Rescheleit D., “Comparison of different particles and methods for magnetic isolation of circulating tumor cells,” J. Magn. Magn. Mater. 225(1-2), 175–179 (2001). 10.1016/S0304-8853(00)01248-8 [DOI] [Google Scholar]
- 4.Dotan K., Feldman B., Goldman B., Peri Y., Peleg L., “The single cell as a tool for genetic testing: credibility, precision, implication,” J. Assist. Reprod. Genet. 27(6), 335–341 (2010). 10.1007/s10815-010-9396-5 [DOI] [PMC free article] [PubMed] [Google Scholar]
- 5.Bhakdi S. C., Ottinger A., Somsri S., Sratongno P., Pannadaporn P., Chimma P., Malasit P., Pattanapanyasat K., Neumann H. P. H., “Optimized high gradient magnetic separation for isolation of Plasmodium-infected red blood cells,” Malar. J. 9(1), 30–38 (2010). 10.1186/1475-2875-9-38 [DOI] [PMC free article] [PubMed] [Google Scholar]
- 6.Beyor N., Seo T. S., Liu P., Mathies R. A., “Immunomagnetic bead-based cell concentration microdevice for dilute pathogen detection,” Biomed. Microdevices 10(6), 909–917 (2008). 10.1007/s10544-008-9206-3 [DOI] [PubMed] [Google Scholar]
- 7.Battye F. L., Light A., Tarlinton D. M., “Single cell sorting and cloning,” J. Immunol. Methods 243(1-2), 25–32 (2000). 10.1016/S0022-1759(00)00225-8 [DOI] [PubMed] [Google Scholar]
- 8.Sharrock C. E. M., Kaminski E., Man S., “Limiting dilution analysis of human T cells: a useful clinical tool,” Immunol. Today 11(8), 281–286 (1990). 10.1016/0167-5699(90)90113-N [DOI] [PubMed] [Google Scholar]
- 9.Thomas R. S. W., Mitchell P. D., Oreffo R. O. C., Morgan H., “Trapping single human osteoblast-like cells from a heterogeneous population using a dielectrophoretic microfluidic device,” Biomicrofluidics 4(2), 022806 (2010). 10.1063/1.3406951 [DOI] [PMC free article] [PubMed] [Google Scholar]
- 10.Yang F., Yang X. M., Jiang H., Bulkhaults P., Wood P., Hrushesky W., Wang G. R., “Dielectrophoretic separation of colorectal cancer cells,” Biomicrofluidics 4(1), 013204 (2010). 10.1063/1.3279786 [DOI] [PMC free article] [PubMed] [Google Scholar]
- 11.Rosenthal A., Voldman J., “Dielectrophoretic traps for single-particle patterning,” Biophys. J. 88(3), 2193–2205 (2005). 10.1529/biophysj.104.049684 [DOI] [PMC free article] [PubMed] [Google Scholar]
- 12.Oakey J., Allely J., Marr D. W. M., “Laminar-flow-based separations at the microscale,” Biotechnol. Prog. 18(6), 1439–1442 (2002). 10.1021/bp0256216 [DOI] [PubMed] [Google Scholar]
- 13.Cho S. H., Chen C. H., Tsai F. S., Godin J. M., Lo Y. H., “Human mammalian cell sorting using a highly integrated micro-fabricated fluorescence-activated cell sorter (microFACS),” Lab Chip 10(12), 1567–1573 (2010). 10.1039/c000136h [DOI] [PMC free article] [PubMed] [Google Scholar]
- 14.Windler-Hart S. L., Chen K. Y., Chenn A., “A cell behavior screen: identification, sorting, and enrichment of cells based on motility,” BMC Cell Biol. 6(1), 14–23 (2005). 10.1186/1471-2121-6-14 [DOI] [PMC free article] [PubMed] [Google Scholar]
- 15.Applegate R. W., Jr, Schafer D., Amir W., Squier J., Vestad T., Oakey J., Marr D. W. M., “Optically-integrated microfluidic systems for cellular characterization and manipulation,” J. Opt. A, Pure Appl. Opt. 9(8), S122–S128 (2007). 10.1088/1464-4258/9/8/S03 [DOI] [Google Scholar]
- 16.Applegate R. W., Jr, Squier J., Vestad T., Oakey J., Marr D. W. M., “Optical trapping, manipulation, and sorting of cells and colloids in microfluidic systems with diode laser bars,” Opt. Express 12(19), 4390–4398 (2004). 10.1364/OPEX.12.004390 [DOI] [PubMed] [Google Scholar]
- 17.Applegate R. W., Jr, Squier J., Vestad T., Oakey J., Marr D. W. M., “Fiber-focused diode-bar optical trapping for microfluidic flow manipulation,” Appl. Phys. Lett. 92(1), 013904 (2008). 10.1063/1.2829589 [DOI] [Google Scholar]
- 18.Applegate R. W., Jr, Squier J., Vestad T., Oakey J., Marr D. W. M., Bado P., Dugan M. A., Said A. A., “Microfluidic sorting system based on optical waveguide integration and diode laser bar trapping,” Lab Chip 6(3), 422–426 (2006). 10.1039/b512576f [DOI] [PubMed] [Google Scholar]
- 19.Immink K., “The compact disk story,” J. Audio Eng. Soc. 46, 458–465 (1998). [Google Scholar]
- 20.Quercioli F., Tiribilli B., Bartoli A., “Interferometry with optical pickups,” Opt. Lett. 24(10), 670–672 (1999). 10.1364/OL.24.000670 [DOI] [PubMed] [Google Scholar]
- 21.Kim K. H., Lee S. Y., Kim S., Lee S. H., Jeong S. G., “A new DNA chip detection mechanism using optical pick-up actuators,” Microsyst. Technol. 13(8-10), 1359–1369 (2007). 10.1007/s00542-006-0367-9 [DOI] [Google Scholar]
- 22.Fan K. C., Chu C. L., Liao J. L., Mou J. I., “Development of a high-precision straightness measuring system with DVD pick-up head,” Meas. Sci. Technol. 14(1), 47–54 (2003). 10.1088/0957-0233/14/1/307 [DOI] [Google Scholar]
- 23.Chu C. L., Lin C. H., “Development of an optical accelerometer with a DVD pick-up head,” Meas. Sci. Technol. 16(12), 2498–2502 (2005). 10.1088/0957-0233/16/12/014 [DOI] [Google Scholar]
- 24.Chu C. L., Lin C. H., Fan K. C., “Two-dimensional optical accelerometer based on commercial DVD pick-up head,” Meas. Sci. Technol. 18(1), 265–274 (2007). 10.1088/0957-0233/18/1/033 [DOI] [Google Scholar]
- 25.Hwu E. T., Hung S. K., Yang C. W., Huang K. Y., Hwang I. S., “Real-time detection of linear and angular displacements with a modified DVD optical head,” Nanotechnology 19(11), 115501 (2008). 10.1088/0957-4484/19/11/115501 [DOI] [PubMed] [Google Scholar]
- 26.Potyrailo R. A., Morris W. G., Leach A. M., Hassib L., Krishnan K., Surman C., Wroczynski R., Boyette S., Xiao C., Shrikhande P., Agree A., Cecconie T., “Theory and practice of ubiquitous quantitative chemical analysis using conventional computer optical disk drives,” Appl. Opt. 46(28), 7007–7017 (2007). 10.1364/AO.46.007007 [DOI] [PubMed] [Google Scholar]
- 27.Lange S. A., Roth G., Wittemann S., Lacoste T., Vetter A., Grässle J., Kopta S., Kolleck M., Breitinger B., Wick M., Hörber J. K. H., Dübel S., Bernard A., “Measuring biomolecular binding events with a compact disc player device,” Angew. Chem. Int. Ed. Engl. 45(2), 270–273 (2006). 10.1002/anie.200501243 [DOI] [PubMed] [Google Scholar]
- 28.Kim K. H., Lee S. Y., Kim S., Jeong S. G., “DNA microarray scanner with a DVD pick-up head,” Curr. Appl. Phys. 8(6), 687–691 (2008). 10.1016/j.cap.2007.04.047 [DOI] [Google Scholar]
- 29.Benschop J., van Rosmalen G., “Confocal compact scanning optical microscope based on compact disc technology,” Appl. Opt. 30(10), 1179–1184 (1991). 10.1364/AO.30.001179 [DOI] [PubMed] [Google Scholar]
- 30.Kostner S., Vellekoop M., “Cell analysis in a microfluidic cytorneter applying a DVD pickup head,” Sens. Actuators B Chem. 132(2), 512–517 (2008). 10.1016/j.snb.2007.11.038 [DOI] [Google Scholar]
- 31.Duffy D. C., McDonald J. C., Schueller O. J. A., Whitesides G. M., “Rapid prototyping of microfluidic systems in poly(dimethylsiloxane),” Anal. Chem. 70(23), 4974–4984 (1998). 10.1021/ac980656z [DOI] [PubMed] [Google Scholar]
- 32.J. Happel and H. Brenner, Low Reynolds Number Hydrodynamics (Prentice-Hall, Inc., 1965). [Google Scholar]
- 33.Miwa M., Juodkazis S., Misawa H., “Drag of a laser trapped fine particle in a microregion,” Jpn. J. Appl. Phys. 39(Part 1, No. 4A), 1930–1933 (2000). 10.1143/JJAP.39.1930 [DOI] [Google Scholar]


