Analysis of atomic resolution crystal structures of wild-type streptavidin (1.03 Å) and its biotin complex (0.95 Å) indicate the range of conformational states taken on by this protein in the solid state. Most of the structural variation is found in the polypeptide loops between the strands in this β-sandwich protein.
Keywords: streptavidin, biotin
Abstract
Atomic resolution crystallographic studies of streptavidin and its biotin complex have been carried out at 1.03 and 0.95 Å, respectively. The wild-type protein crystallized with a tetramer in the asymmetric unit, while the crystals of the biotin complex contained two subunits in the asymmetric unit. Comparison of the six subunits shows the various ways in which the protein accommodates ligand binding and different crystal-packing environments. Conformational variation is found in each of the polypeptide loops connecting the eight strands in the β-sandwich subunit, but the largest differences are found in the flexible binding loop (residues 45–52). In three of the unliganded subunits the loop is in an ‘open’ conformation, while in the two subunits binding biotin, as well as in one of the unliganded subunits, this loop ‘closes’ over the biotin–binding site. The ‘closed’ loop contributes to the protein’s high affinity for biotin. Analysis of the anisotropic displacement parameters included in the crystallographic models is consistent with the variation found in the loop structures and the view that the dynamic nature of the protein structure contributes to the ability of the protein to bind biotin so tightly.
1. Introduction
The high affinity of streptavidin for biotin forms the basis for many labeling and binding experiments in biological and biotechnical applications (Diamandis & Christopoulos, 1991 ▶; Voss & Skerra, 1997 ▶; Korndörfer & Skerra, 2002 ▶; Schmidt & Skerra, 2007 ▶). Structural and biophysical studies of streptavidin and avidin have led to an understanding of the protein–ligand interactions that contribute to their tight binding, but several mutated streptavidins with reduced binding constants have equilibrium structures that are very similar to that of the wild-type streptavidin–biotin complex (Stayton et al., 1999 ▶; Hyre et al., 2006 ▶; Baugh et al., 2010 ▶). The lack of large structural changes to account for large binding differences has been perplexing.
Molecular-dynamics calculations for streptavidin–biotin in solution and the crystalline state and simulations of the ligand-dissociation process indicate that the dynamical nature of the complexes is an important contributor to the binding energetics (Hyre et al., 2002 ▶; Cerutti et al., 2008 ▶, 2009 ▶). In particular, the mutation of residues not in contact with biotin can result in reduced binding by affecting the dynamics of the residues close to and interacting with the ligand (Baugh et al., 2010 ▶; Chivers et al., 2010 ▶).
We report here atomic resolution crystallographic analyses of wild-type streptavidin (SWT) and its biotin complex (SWTB) that can serve as precise starting models for further structural and computational studies. Anisotropic atomic displacement parameters have been refined for these structures and comparison of them provides experimental evidence for the dynamic nature of these protein structures.
2. Materials and methods
2.1. Purification and crystallization
The expression, purification and crystallization of wild-type core streptavidin has been described in detail in previous publications (Chilkoti & Stayton, 1995 ▶; Freitag et al., 1997 ▶; Hyre et al., 2006 ▶; Chilkoti et al., 1995 ▶).
Crystals of ligand-free wild-type core streptavidin (SWT) were obtained using hanging-drop vapor-diffusion methods. Drops of protein in 26% MPD and distilled water were equilibrated against 52% MPD solution to produce monoclinic crystals (unit-cell parameters a = 58.02, b = 84.43, c = 45.99 Å, β = 98.81°, space group P21) with a tetramer in the asymmetric unit. The crystallization solution served as the cryosolution for data collection.
Crystals of the wild-type biotin complex (SWTB) were obtained using hanging-drop vapor-diffusion techniques starting with protein solution (26 mg ml−1) containing a twofold excess of biotin. Crystals grew from 30% saturated ammonium sulfate, 0.1 M sodium acetate pH 4.5 and 0.2 M NaCl. The cryosolution contained 35% glycerol. The biotin complex crystallized in space group I222, with unit-cell parameters a = 46.42, b = 94.06, c = 104.61 Å and two monomers in the asymmetric unit.
2.2. Diffraction data collection
Diffraction data for both molecules were collected at SSRL at 100 K. 180 frames (1° steps) were collected on beamline 9-1 for SWT using a MAR 345 detector at a crystal-to-detector distance of 115 mm. The X-ray wavelength was 0.9700 Å. The mosaicity was 0.204°. A large aluminium beamstop was used to limit overflows for the lower resolution data.
Diffraction data for SWTB were collected on beamline 11-1 using an ADSC 315 detector. Two passes were collected, using shorter exposure times to reduce the overflows for the low-resolution data for one of the runs. The low-resolution run consisted of 360 frames of 1° each to 1.6 Å resolution with a crystal-to-detector distance of 300 mm. Higher resolution data were obtained from 250 frames of 1° each to 0.88 Å resolution with a crystal-to-detector distance of 150 mm. The mosaicity of this crystal was 0.195°. The wavelength for this data set was 0.8265 Å.
No sign of radiation damage was detected for either crystal. The data sets for each crystal structure were processed using DENZO and SCALEPACK (Otwinowski & Minor, 1997 ▶).
The high signal-to-noise ratio at 1.03 Å resolution for the SWT data set indicated that additional high-resolution reflections could have been collected for this structure. Conversely, the statistics for the SWTB data set suggest that the 0.88 Å limit used for data processing is an optimistic estimate of the extent of this data set. Accordingly, reflections to 0.95 Å resolution were used for refinement of the SWTB structure. Summary statistics for the data sets used in refinement are presented in Table 1 ▶.
Table 1. Statistics for the data sets used in refinement.
| SWT (unliganded) | SWTB (biotin complex) | |
|---|---|---|
| Beamline | SSRL 9-1 | SSRL 11-1 |
| No. of reflections measured | 960889 | 2310644† |
| No. of unique reflections | 209071 | 137736 |
| Resolution range (Å) | 50.0–1.03 (1.05–1.03) | 50.0–0.95 (0.97–0.95) |
| Completeness (%) | 97.1 (99.8) | 95.5 (70.2) |
| 〈I/σ(I)〉 | 27.2 (5.7) | 49.8 (1.5) |
| Rmerge | 0.037 (0.223) | 0.049† (>1.00) |
The data set was originally processed to a maximum resolution of 0.88 Å. We were not able to reprocess the data with a 0.95 Å resolution limit. These overall values are for the larger data set and are approximations for the data to 0.95 Å resolution.
2.3. Structure refinement and analysis
Both SWT and SWTB are isomorphous with previous streptavidin structures. For SWT, the initial model for refinement was that of the Y43F mutant (PDB entry 1swu; Freitag et al., 1999 ▶). A 1.4 Å resolution structure of the biotin complex of wild-type streptavidin (PDB entry 1mk5; Hyre et al., 2006 ▶) served as the initial model for the atomic resolution refinement of SWTB.
REFMAC5 (Murshudov et al., 2011 ▶) within the CCP4 suite (Winn et al., 2011 ▶) was used for refinement of the structural models. 5% of the reflections were reserved for calculation of R free (Brünger, 1992 ▶). All atoms were refined with anisotropic displacement parameters (ADPs; Trueblood et al., 1996 ▶) and alternative conformations were added to the model for many residues. Stereochemical restraints were applied but were downweighted to allow the model to better fit the atomic resolution diffraction data. Sphericity and rigid-bond restraints were weakly applied to the ADPs. No noncrystallographic symmetry restraints were applied. A summary of the refinement statistics is presented in Table 2 ▶.
Table 2. Refinement statistics.
| SWT | SWTB | |
|---|---|---|
| Resolution (Å) | 47.5–1.03 | 70.0–0.95 |
| No. of reflections, working set | 198537 | 130454 |
| No. of reflections, test set | 10472 | 6914 |
| Rcryst, all data | 0.118 | 0.116 |
| Rcryst, working set | 0.117 | 0.115 |
| Rfree, all data | 0.135 | 0.131 |
| Bond r.m.s.d. (restrained) (Å) | 0.016 | 0.014 |
| No. of protein atoms | 4147 | 2010 |
| No. of heteroatoms | 104 | 62 |
| No. of solvent atoms | 636 | 279 |
Manipulation and visualization of the model and electron-density maps were carried out with XtalView (McRee, 1999 ▶). Water molecules were added at sites making hydrogen bonds to the protein or other waters. In some instances, overlapping water sites were assigned partial occupancies chosen on the basis of peak heights in the difference electron-density maps. In the final difference electron-density map a moderate-sized piece of residual density was found near residue 48 of the A chain of SWTB. The unresolved density was about the size of an amino acid and its height was about half that of a fully occupied atom. No chemical species in the crystallization or protein solutions fitted the density well, so the weak density was left unmodeled.
Molecular superpositions were performed with an in-laboratory program using the method of Ferro & Hermans (1977 ▶). Accessible-surface calculations were carried out with AREAIMOL from the CCP4 package (Winn et al., 2011 ▶). The structures were evaluated during and after refinement using PROCHECK (Laskowski et al., 1993 ▶), MolProbity (Chen et al., 2010 ▶), PARVATI (Merritt, 1999a ▶,b ▶) and TLSMD (Painter & Merritt, 2006a ▶,b ▶; Zucker et al., 2010 ▶). The coordinates and structure factors for the refined structures have been deposited in the Protein Data Bank (identification codes 3ry1 for SWT and 3ry2 for SWTB).
3. Results
3.1. Structural overview
The structures of streptavidin in the crystal forms used for this study have been previously described at lower resolution (Weber et al., 1992 ▶; Pähler et al., 1987 ▶; Freitag et al., 1997 ▶; Hyre et al., 2000 ▶, 2006 ▶). This brief overview of the structures provides a foundation for the atomic resolution results presented here.
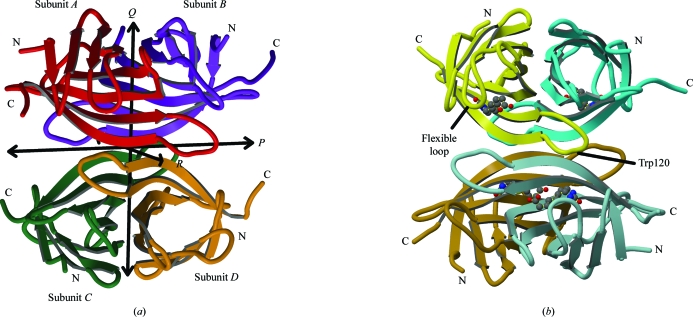
The unliganded wild-type protein crystallizes with P21 space-group symmetry with a tetramer in the asymmetric unit. The subunits within the tetramer are related by 222 (D 2) symmetry (Fig. 1 ▶ a).
Figure 1.
The SWT and SWTB tetramers. (a) The four crystallographically unique subunits in the SWT tetramer (subunits A, B, C and D) are related by noncrystallographic twofold axes P, Q and R (Hendrickson et al., 1989 ▶). Subunit A is shown in red, subunit B in purple, subunit C in green and subunit D in orange. (b) The SWTB tetramer. The A and B subunits (yellow and blue, respectively) are crystallographically unique. Subunits C and D (brown and gray–blue) are related to subunits A and B by a crystallographic dyad coincident with the P axis. This figure was drawn with MolScript (Kraulis, 1991 ▶) and RASTER3D (Merritt & Bacon, 1997 ▶).
Each subunit is an eight-stranded β-barrel with a biotin-binding site at one end of the barrel (Fig. 1 ▶ b). [The strands are labeled S1–S8 and the loops joining strands X and Y are labeled LX,Y as they were by Hytönen et al. (2005 ▶).] The largest subunit–subunit interfaces are between subunits that are related by the Q twofold axes (Hendrickson et al., 1989 ▶). Chains A and B form one such pair, while chains C and D form another. The tetramer can be thought of as a dimer of dimers (Weber et al., 1989 ▶).
An extended loop consisting of residues 113–122 (L7,8) reaches across to contribute Trp120 to the biotin-binding site of the subunit related by the R twofold axis. The loop from subunit A forms part of the binding site of subunit D and vice versa. Subunits B and C interact in the same way. The subunits that donate residues to each other’s biotin sites are not the subunits that form the tight dimer. These interactions make streptavidin tetramers the stable functional form, although protein-engineering studies have stabilized other oligomeric forms for biotechnical applications (Nordlund et al., 2005 ▶; Aslan et al., 2005 ▶, 2007 ▶).
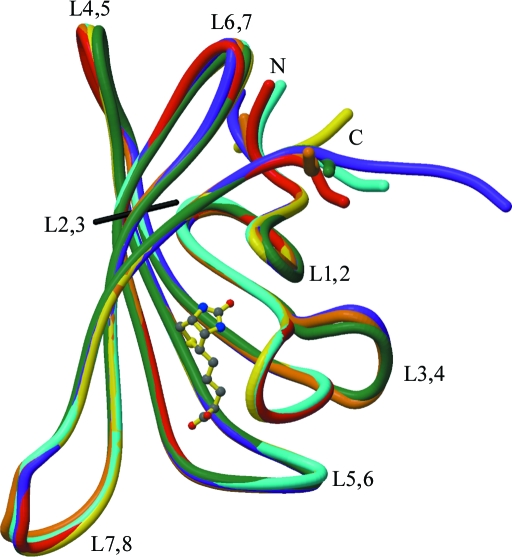
The loop connecting β-strands 3 and 4, L3,4 (residues 45–52), can adopt at least two conformations: one folded over the biotin-binding site (‘closed’) and one with the flexible binding loop folded away from the binding site (‘open’) (Figs. 1 ▶ b and 2 ▶). When biotin is bound to the protein the loop closes, but it can also adopt this conformation in the unliganded form (see below).
Figure 2.
Polypeptide tracing for the SWT and SWTB subunits after superposition on subunit A of SWT. Subunits colored as in Fig. 1 ▶. The loops are labeled, as are the N- and C-termini. Biotin bound to the A subunit of SWTB is shown in ball-and-stick representation. This figure was drawn with MolScript (Kraulis, 1991 ▶) and RASTER3D (Merritt & Bacon, 1997 ▶).
The biotin complex crystallizes in space group I222 with two subunits in the asymmetric unit. The oligomeric form in these crystals is a tetramer with its P molecular twofold axis coincident with the crystallographic twofold axis along the y axis. The unique subunits in this crystal form (subunits A and B) are those forming a tight dimer.
3.2. Superposition of the subunits
The Cα positions of 62 core residues were used for pairwise superpositions of the six subunits in the two crystal forms of wild-type and biotin-bound streptavidin. These residues (19–22, 30–33, 38–43, 54–60, 71–80, 85–97, 103–112 and 123–130) were chosen to limit the effects of loop variability on the superpositions. The r.m.s. differences (r.m.s.d.s) for these 62 residues in all possible pairwise superpositions of the subunits are given in Table 3 ▶. Fig. 2 ▶ shows the superposition of the SWT and SWTB subunits on the A chain of SWT.
Table 3. R.m.s.d. values (Å) for superposed streptavidin subunits.
Cα atoms of residues 19–22, 30–33, 38–43, 54–60, 71–80, 85–97, 103–112 and 123–130 were used in the superpositions.
| SWT | SWTB | ||||||
|---|---|---|---|---|---|---|---|
| A | B | C | D | A | B | ||
| SWT | A | 0.000 | 0.165 | 0.244 | 0.138 | 0.151 | 0.157 |
| B | 0.000 | 0.190 | 0.161 | 0.186 | 0.197 | ||
| C | 0.000 | 0.268 | 0.264 | 0.289 | |||
| D | 0.000 | 0.149 | 0.163 | ||||
| SWTB | A | 0.000 | 0.093 | ||||
To determine whether a change in the quaternary structure of the tetramer is associated with binding of biotin, the SWT and SWTB tetramers, the latter generated using a crystallographic dyad, were also superposed using the 248 core residues in the four subunits. The resulting r.m.s.d. values for the two possible orientations for aligning the SWTB tetramer with the SWT tetramer were 0.259 and 0.282 Å. (If there were four subunits in the SWTB asymmetric unit there would be four possible ways to align the tetramers, but because there are only two independent subunits in SWTB there are only two orientations possible.) These values can be compared with those for the three alignments of the SWT tetramer on itself (0.196, 0.268 and 0.286 Å) and the one value for the alternate superposition of SWTB on itself (0.216 Å).
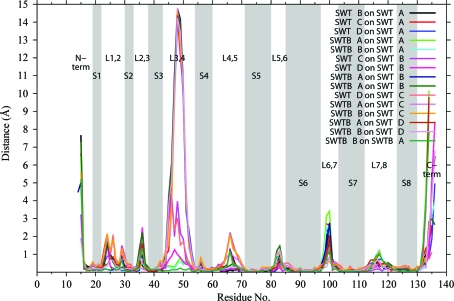
There are 15 possible superpositions for the six crystallographically independent subunits. Fig. 3 ▶ shows the Cα—Cα distances as a function of residue number for all pairs of superposed subunits. In the loops between β-strands the distances become significant for some of the paired subunits. These regions are also denoted in Fig. 2 ▶, in which chain tracings of the subunits are superposed. The largest differences are seen at the termini and in L3,4. As in many crystal structures, the termini are located in weak electron density and this results in variation in the structural models for the termini associated with motion and/or difficulties in fitting the weak density.
Figure 3.
Root-mean-squared (r.m.s.) distances between Cα atoms for 15 pairwise superpositions of six streptavidin subunits. Gray bars denote the eight β-strands in each subunit. The N-terminus, loops and C-terminus are also labeled. This figure was drawn with gnuplot v.4.4 (Williams & Kelley, 2007 ▶).
3.3. Molecular surfaces involved in oligomer and crystal-packing interactions
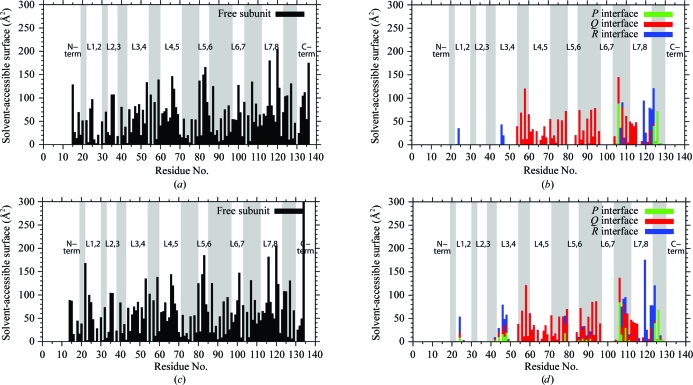
Accessible surface calculations (Lee & Richards, 1971 ▶) provide a means of determining which parts of a structure are involved in crystal-packing and intersubunit interactions. Fig. 4 ▶(a) shows the accessible surface for the isolated A subunit of SWT. Consistent with the size of the subunit, no significant stretch of the polypeptide chain is buried. As expected for β-sandwich structures, the residues in the β-strands alternate between being accessible and being buried. Fig. 4 ▶(b) shows the accessible surface buried in the P, Q and R interfaces for subunit A in the SWT tetramer. The accessible and buried surfaces for SWTB subunit A are shown in Figs. 4 ▶(c) and 4 ▶(d), respectively.
Figure 4.
Solvent-accessible surfaces. (a) Solvent-accessible surface for an isolated A subunit of SWT. As in Fig. 3 ▶, the gray bars denote the β-strands. (b) Solvent-accessible surface buried by formation of the SWT tetramer. Buried surfaces for residues in each of the P, Q and R interfaces (see Fig. 1 ▶ a) are shown in green, red and blue, respectively. (c) Solvent-accessible surface for an isolated A subunit of SWTB. Small changes are associated with biotin binding. (d) Buried solvent-accessible surface upon formation of the SWTB tetramer. This figure was drawn with gnuplot v.4.4 (Williams & Kelley, 2007 ▶).
As pointed out above, the Q interface is the major contributor to tetramer stability. Many of the residues involved in this interaction are located in β-strands 4–7. This is true for all six subunits, but the Q interface of the SWTB subunits also includes residues in L1,2 and L3,4 towards the N-terminus of the subunit. These regions are also close to the P and R interfaces and the buried surface areas in these interfaces also increase when biotin is bound in SWTB. Overall, the structure of SWTB seems to contract ever so slightly when biotin is bound. It should be noted that the change in crystal form on going from SWT to SWTB might also account for this change in the buried surfaces.
The six subunits in the two structures are located in crystallographically inequivalent positions and the crystal-packing interactions vary from subunit to subunit. Most of the inter-tetramer interactions in these two crystal forms involve residues located in the loops between the β-strands. The strong interactions between the β-sandwiches in the Q interface bury most of the residues in strands S4–S7. This leaves the loop residues as the only residues capable of making the intermolecular interactions necessary for crystal formation. It seems likely that for any given loop the variation in crystal-packing interactions across the six subunits is accompanied by variations in the conformations seen for that loop.
3.4. Comparison of atomic displacement parameters
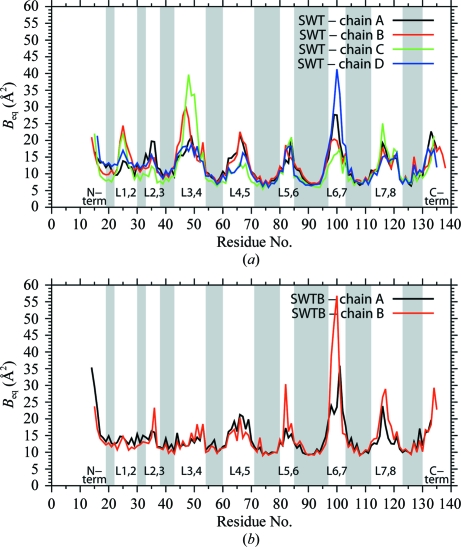
The average isotropic equivalent B values (B eq) per residue are shown in Fig. 5 ▶. The B eq values show the same pattern as seen for the r.m.s.d.s in Fig. 3 ▶, i.e. larger values for the loops between the β-strands. This is especially so for the flexible loop (L3,4) and the loop containing residues 98–102 (L6,7). Subunits B and D in SWT have similar conformations for L3,4, while subunit C differs from them. This pattern is also seen in Fig. 5 ▶(a), where the C subunit has considerably higher B eq values for its loop. The loops in subunits B and D have B eq values closer to those found in the closed loop in subunit A. Even so, the B eq values in the loops in subunits A, B and D are higher than those in the adjacent β-strands. This behavior is different from that seen in SWTB, where interactions of the closed loop with the bound biotin reduce the B eq values to those seen in neighboring parts of the protein.
Figure 5.
Average B eq [= 8π2(U 11 + U 22 + U 33)/3] for the main-chain and side-chain atoms. (a) SWT subunits. (b) SWTB subunits. This figure was drawn with gnuplot v.4.4 (Williams & Kelley, 2007 ▶).
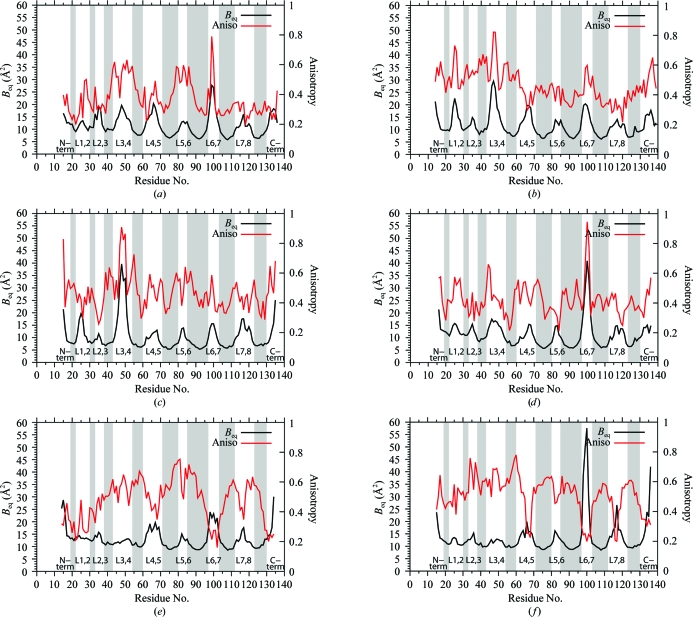
The average B eq and anisotropies for the main-chain atoms in each residue are plotted in Fig. 6 ▶. Anisotropy is the ratio of the minimum and maximum eigenvalues of the ADP tensor and is the square of the axial ratio of the thermal ellipsoid. An isotropic atom has an anisotropy of 1.0 (Merritt, 1999a ▶; Trueblood et al., 1996 ▶).
Figure 6.
B eq and anisotropy for residues in the six SWT and SWTB subunits. (a) SWT, subunit A. (b) SWT, subunit B. (c) SWT, subunit C. (d) SWT, subunit D. (e) SWTB, subunit A. (f) SWTB, subunit B. B eq = 8π2(U 11 + U 22 + U 33)/3. The anisotropy values are defined and described in the text. This figure was drawn with gnuplot v.4.4 (Williams & Kelley, 2007 ▶).
For all six streptavidin subunits, the distributions of anisotropy values are in line with other atomic resolution structures, i.e. the distributions are broad, with average values ranging from 0.401 to 0.491. For the subunits in SWT, high anisotropies are found for L3,4. The residues in these loops have nearly isotropic ADPs. For SWTB, a different pattern is seen in which the loops with high B eq values generally have low anisotropies. In this structure, the loops have ADPs that are more distorted than those in the core of the structure.
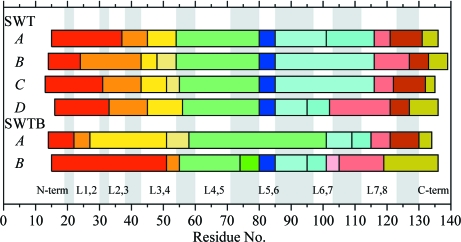
One means of analyzing models for concerted motion is to evaluate the ADPs in terms of a TLS model (Schomaker & Trueblood, 1968 ▶, 1998 ▶; Painter & Merritt, 2006a ▶,b ▶; Zucker et al., 2010 ▶). The TLSMD website (http://skuld.bmsc.washington.edu/~tlsmd/) systematically breaks the polypeptide into groups and determines to what extent TLS parameters derived from the ADPs for these groups fit the ADPs refined for individual atoms. It is left to the user to determine how many TLS groups might be appropriate to incorporate into the refinement of the crystallographic model; the choice is often based on the number of groups that optimally fit the observed ADPs. For the six independent subunits reported here, we obtained TLS groups using the TLSMD server and then compared them to observe whether common dynamic segments were found for the different subunits. No particular number of groups stood out in this analysis, so we have chosen to show the results for ten TLS groups in Fig. 7 ▶. A remarkable result from this analysis is the identification of similar group boundaries in many of the streptavidin subunits. For instance, in all of the SWT subunits the TLSMD analyzer identified L3,4 as a structural entity with ADPs consistent with one or two correlated groups of atoms. Group boundaries occur at either end of L3,4, consistent with this interpretation of the ADPs.
Figure 7.
TLS group boundaries identified for the six streptavidin subunits. Different colored blocks denote different TLS groups identified by the TLSMD server (http://skuld.bmsc.washington.edu/~tlsmd/). Results are shown for ten groups. This figure was drawn with gnuplot v.4.4 (Williams & Kelley, 2007 ▶).
Another TLS group of interest consists of residues 80–85 (L5,6), which is found in all SWT subunits as well as the B subunit of SWTB. This loop is not identified as a group in SWTB subunit A, but no obvious structural feature accounts for this difference. Another region identified as a group, although not as clearly as L5,6, is near residues 115–120 (L7,8), but the boundaries for this group vary from subunit to subunit.
4. Discussion
4.1. Biotin-binding site
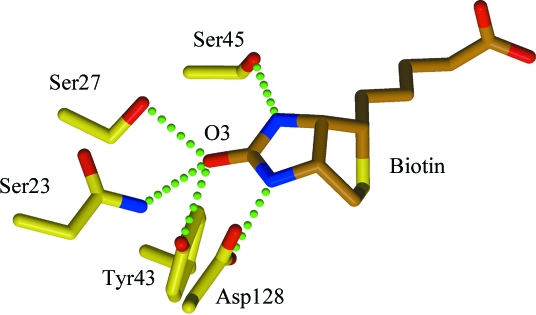
As known from lower resolution studies, several residues interact with biotin through hydrogen bonds and van der Waals interactions. The hydrogen bonds made to the ureido group are shown in Fig. 8 ▶. These strong interactions were identified in early structure determinations of the complex (Weber et al., 1989 ▶) and it was proposed that they were consistent with polarization of the C=O bond. If it were polarized, the C—O bond should be longer than that expected for C=O, 1.23 Å. The C3—O3 bond lengths obtained for this refined structure were 1.30 Å for both SWTB chains A and B. The refinement included the restraints for the biotin ligand defined in the standard library for REFMAC5, although the restraints were not strongly enforced in the final refinement steps. Nevertheless, the library value of 1.41 Å for the C3—O3 bond length is appropriate for a C—O single bond. Even after being downweighted, this restraint might still cause a lengthening of the C3—O3 distance. To test this, a subsequent refinement with a C—O restraint of 1.23 Å was carried out. The resulting C3—O3 bond lengths were 1.29 and 1.29 Å for the two SWTB chains. This indicates that the overall weighting procedure used in REFMAC5 to reduce the contributions of the restraints was sufficient to remove their contributions to this part of the model. The bond length is longer than that found in the structure determination of d-(+)-biotin, 1.249 (6) Å (DeTitta et al., 1976 ▶), and is slightly polarized in the biotin complex. A quantum-mechanics study of the streptavidin–biotin complex (Li et al., 2009 ▶) suggests that small bond-length changes of the order of 0.03 Å are associated with polarization of the C3—O3 bond and its hydrogen-bonded interactions with the protein. This is consistent with the bond-length values obtained from this study.
Figure 8.
Residues making hydrogen bonds to the ureido moiety of biotin. Hydrogen bonds are denoted by green dotted lines. This figure was drawn with MolScript (Kraulis, 1991 ▶) and RASTER3D (Merritt & Bacon, 1997 ▶).
In SWT, water and MPD molecules occupy the site filled by biotin in SWTB. Multiple MPD conformations are found in the four independent subunits in SWT, with the MPDs located towards one side of the ligand-binding site, towards Asp128 and Trp108. Hydrogen bonds are formed between the Asp128 carboxyl and some of the MPD conformers. Water molecules fill in the site on the other side of where biotin is located in SWTB. One cluster of water molecules is close to the position occupied by O3, the ureido oxygen of biotin, and makes hydrogen bonds with Tyr43.
The binding of biotin to streptavidin is accompanied by a lowering of the isotropic B eq values for the amino acids in contact with the ligand. The average isotropic B eq for nine residues contacting biotin in SWTB is 10.6 Å2, while for SWT it is 10.8 Å2. However, the overall B eq for SWT is about 2.3 Å2 lower than that of SWTB, consistent with the higher resolution diffraction data measured for SWT. (The overall B eq values were determined using the Cα atoms for the core residues listed in Table 3 ▶.) Thus, relative to the overall B value for each structure, binding of biotin lowers the B values of the complex by about 2.3 Å2. This is associated with a general tightening of the structure upon binding of ligand and is likely to reflect a change in the dynamics of the molecule when biotin provides interactions linking L3,4 to the rest of the protein. It should be noted that no discernible quaternary change can be detected on comparing the superposed SWT and SWTB tetramers.
4.2. Flexible binding loop conformations
In three of the four subunits in the SWT asymmetric unit (subunits B, C and D), L3,4, the ‘flexible binding loop’ (Weber et al., 1989 ▶; Freitag et al., 1997 ▶), is in an ‘open’ conformation. In the A subunit in SWT and in the two subunits in SWTB the loop closes to cap the ligand-binding site. Some residues move as much as 15 Å on changing from the ‘open’ to the ‘closed’ conformation. The three subunits with ‘closed’ conformations have very similar structures for L3,4. The closest approach of the loop to the bound biotin is between the backbone amide of Asn49 and the carboxylate of the biotin. In SWT chain A this amide is hydrogen bonded to a glycerol molecule
As opposed to the ‘closed’ conformation, there is more variation in the three ‘open’ loops. Two of them (SWT subunit B and SWT subunit D) have similar conformations, with nearly identical torsion angles defining the path of the main-chain atoms. L3,4 in SWT subunit C traces through the same region as those of the other subunits when the three are superposed, but different main-chain torsion angles between residues 44 and 52 lead to detailed differences in the orientations of the residues in this subunit. No obvious intermolecular or intramolecular interactions are associated with these different conformations.
Observing ‘open’ and ‘closed’ conformations for L3,4 is not surprising, especially when the conformations can be associated with ligand binding. However, ligand binding is not involved with the ‘closed’ loop found in SWT chain A. In earlier lower resolution studies (Freitag et al., 1997 ▶) this closed structure was attributed to crystal-packing interactions either favoring the closed conformation or disfavoring the open conformation. At this point, with more precise structural models available, it is not possible to point to particular interactions that account for the stabilization of the closed loop for this molecule in this unique crystal-packing environment. A more detailed analysis of the interaction energies will be necessary to understand this structural feature.
5. Conclusions
Atomic resolution X-ray crystallographic studies of streptavidin provide precise models for the unbound and biotin-bound forms of the protein, but they also reinforce the idea that macromolecules have dynamic disordered structures. This shows in this comparison of the streptavidin subunits in the structural variation in the polypeptide loops, in the alternate conformations found for portions of the proteins and in the variation in the ADPs.
Some of this variation is associated with ligand binding, i.e. the conformation of L3,4, and while this was observed in lower resolution studies, refinement of the models at atomic resolution provides a more detailed look at the conformational differences in this region. The structure of the unbound protein (SWT) provides an interesting situation where one of the subunits has a ‘closed’ loop in the absence of bound ligand. This points out the role of crystal-packing interactions in ‘freezing’ out various conformational states of proteins.
As seen in other comparisons of atomic resolution crystallographically determined structures (Behnke et al., 2010 ▶), the core structures of the streptavidin subunits superpose well, while the loops and surface residues show more conformational variation. This variability is consistent with the growing realization that macromolecules in the crystalline state occupy a number of conformational states and reinforces the well understood idea that crystallographic structural models are time and space averages (DePristo et al., 2004 ▶). In the case of streptavidin, the major structural variants are explainable in terms of biotin binding, crystal-packing interactions and trapping of conformational states.
One advantage of atomic resolution crystallographic studies is that they provide high-precision views of macromolecular structures that can show specific deviations from ideality and specific examples of interatomic interactions that can stabilize particular structural motifs. The structures reported here provide snapshots of how the polypeptide structures and their dynamics vary in response to ligand binding and crystal-packing interactions
Supplementary Material
PDB reference: streptavidin, 3ry1
PDB reference: streptavidin–biotin complex, 3ry2
Acknowledgments
Portions of this research were carried out at the Stanford Synchrotron Radiation Lightsource, a national user facility operated by Stanford University on behalf of the US Department of Energy, Office of Basic Energy Sciences. The SSRL Structural Molecular Biology Program is supported by the Department of Energy, Office of Biological and Environmental Research and by the National Institutes of Health, National Center for Research Resources, Biomedical Technology Program and the National Institute of General Medical Sciences. This work was supported by National Institutes of Health Grant GM080214 (TPL, PI).
References
- Aslan, F. M., Yu, Y., Mohr, S. C. & Cantor, C. R. (2005). Proc. Natl Acad. Sci. USA, 102, 8507–8512. [DOI] [PMC free article] [PubMed]
- Aslan, F. M., Yu, Y., Vajda, S., Mohr, S. C. & Cantor, C. R. (2007). J. Biotechnol. 128, 213–225. [DOI] [PubMed]
- Baugh, L., Le Trong, I., Cerutti, D. S., Gülich, S., Stayton, P. S., Stenkamp, R. E. & Lybrand, T. P. (2010). Biochemistry, 49, 4568–4570. [DOI] [PMC free article] [PubMed]
- Behnke, C. A., Le Trong, I., Godden, J. W., Merritt, E. A., Teller, D. C., Bajorath, J. & Stenkamp, R. E. (2010). Acta Cryst. D66, 616–627. [DOI] [PMC free article] [PubMed]
- Brünger, A. T. (1992). Nature (London), 355, 472–475. [DOI] [PubMed]
- Cerutti, D. S., Le Trong, I., Stenkamp, R. E. & Lybrand, T. P. (2008). Biochemistry, 47, 12065–12077. [DOI] [PMC free article] [PubMed]
- Cerutti, D. S., Le Trong, I., Stenkamp, R. E. & Lybrand, T. P. (2009). J. Phys. Chem. B, 113, 6971–6985. [DOI] [PMC free article] [PubMed]
- Chen, V. B., Arendall, W. B., Headd, J. J., Keedy, D. A., Immormino, R. M., Kapral, G. J., Murray, L. W., Richardson, J. S. & Richardson, D. C. (2010). Acta Cryst. D66, 12–21. [DOI] [PMC free article] [PubMed]
- Chilkoti, A. & Stayton, P. S. (1995). J. Am. Chem. Soc. 117, 10622–10628.
- Chilkoti, A., Tan, P. H. & Stayton, P. S. (1995). Proc. Natl Acad. Sci. USA, 92, 1754–1758. [DOI] [PMC free article] [PubMed]
- Chivers, C. E., Crozat, E., Chu, C., Moy, V. T., Sherratt, D. J. & Howarth, M. (2010). Nature Methods, 7, 391–393. [DOI] [PMC free article] [PubMed]
- DePristo, M. A., de Bakker, P. I. & Blundell, T. L. (2004). Structure, 12, 831–838. [DOI] [PubMed]
- DeTitta, G. T., Edmonds, J. W., Stallings, W. & Donohue, J. (1976). J. Am. Chem. Soc. 98, 1920–1926. [DOI] [PubMed]
- Diamandis, E. P. & Christopoulos, T. K. (1991). Clin. Chem. 37, 625–636. [PubMed]
- Ferro, D. R. & Hermans, J. (1977). Acta Cryst. A33, 345–347.
- Freitag, S., Le Trong, I., Klumb, L., Stayton, P. S. & Stenkamp, R. E. (1997). Protein Sci. 6, 1157–1166. [DOI] [PMC free article] [PubMed]
- Freitag, S., Le Trong, I., Klumb, L. A., Stayton, P. S. & Stenkamp, R. E. (1999). Acta Cryst. D55, 1118–1126. [DOI] [PubMed]
- Hendrickson, W. A., Pähler, A., Smith, J. L., Satow, Y., Merritt, E. A. & Phizackerley, R. P. (1989). Proc. Natl Acad. Sci. USA, 86, 2190–2194. [DOI] [PMC free article] [PubMed]
- Hyre, D. E., Amon, L. M., Penzotti, J. E., Le Trong, I., Stenkamp, R. E., Lybrand, T. P. & Stayton, P. S. (2002). Nature Struct. Biol. 9, 582–585. [DOI] [PubMed]
- Hyre, D. E., Le Trong, I., Freitag, S., Stenkamp, R. E. & Stayton, P. S. (2000). Protein Sci. 9, 878–885. [DOI] [PMC free article] [PubMed]
- Hyre, D. E., Le Trong, I., Merritt, E. A., Eccleston, J. F., Green, N. M., Stenkamp, R. E. & Stayton, P. S. (2006). Protein Sci. 15, 459–467. [DOI] [PMC free article] [PubMed]
- Hytönen, V. P., Määttä, J. A., Nyholm, T. K., Livnah, O., Eisenberg-Domovich, Y., Hyre, D., Nordlund, H. R., Hörhä, J., Niskanen, E. A., Paldanius, T., Kulomaa, T., Porkka, E. J., Stayton, P. S., Laitinen, O. H. & Kulomaa, M. S. (2005). J. Biol. Chem. 280, 10228–10233. [DOI] [PubMed]
- Korndörfer, I. P. & Skerra, A. (2002). Protein Sci. 11, 883–893. [DOI] [PMC free article] [PubMed]
- Kraulis, P. J. (1991). J. Appl. Cryst. 24, 946–950.
- Laskowski, R. A., MacArthur, M. W., Moss, D. S. & Thornton, J. M. (1993). J. Appl. Cryst. 26, 283–291.
- Lee, B. & Richards, F. M. (1971). J. Mol. Biol. 55, 379–400. [DOI] [PubMed]
- Li, Q., Gusarov, S., Evoy, S. & Kovalenko, A. (2009). J. Phys. Chem. B, 113, 9958–9967. [DOI] [PubMed]
- McRee, D. E. (1999). J. Struct. Biol. 125, 156–165. [DOI] [PubMed]
- Merritt, E. A. (1999a). Acta Cryst. D55, 1109–1117. [DOI] [PubMed]
- Merritt, E. A. (1999b). Acta Cryst. D55, 1997–2004. [DOI] [PubMed]
- Merritt, E. A. & Bacon, D. J. (1997). Methods Enzymol. 277, 505–524. [DOI] [PubMed]
- Murshudov, G. N., Skubák, P., Lebedev, A. A., Pannu, N. S., Steiner, R. A., Nicholls, R. A., Winn, M. D., Long, F. & Vagin, A. A. (2011). Acta Cryst. D67, 355–367. [DOI] [PMC free article] [PubMed]
- Nordlund, H. R., Hytönen, V. P., Hörhä, J., Määttä, J. A., White, D. J., Halling, K., Porkka, E. J., Slotte, J. P., Laitinen, O. H. & Kulomaa, M. S. (2005). Biochem. J. 392, 485–491. [DOI] [PMC free article] [PubMed]
- Otwinowski, Z. & Minor, W. (1997). Methods Enzymol. 276, 307–326. [DOI] [PubMed]
- Pähler, A., Hendrickson, W. A., Kolks, M. A., Argaraña, C. E. & Cantor, C. R. (1987). J. Biol. Chem. 262, 13933–13937. [PubMed]
- Painter, J. & Merritt, E. A. (2006a). Acta Cryst. D62, 439–450. [DOI] [PubMed]
- Painter, J. & Merritt, E. A. (2006b). J. Appl. Cryst. 39, 109–111.
- Schmidt, T. G. & Skerra, A. (2007). Nature Protoc. 2, 1528–1535. [DOI] [PubMed]
- Schomaker, V. & Trueblood, K. N. (1968). Acta Cryst. B24, 63–76.
- Schomaker, V. & Trueblood, K. N. (1998). Acta Cryst. B54, 507–514.
- Stayton, P. S., Freitag, S., Klumb, L. A., Chilkoti, A., Chu, V., Penzotti, J. E., To, R., Hyre, D., Le Trong, I., Lybrand, T. P. & Stenkamp, R. E. (1999). Biomol. Eng. 16, 39–44. [DOI] [PubMed]
- Trueblood, K. N., Bürgi, H.-B., Burzlaff, H., Dunitz, J. D., Gramaccioli, C. M., Schulz, H. H., Shmueli, U. & Abrahams, S. C. (1996). Acta Cryst. A52, 770–781.
- Voss, S. & Skerra, A. (1997). Protein Eng. 10, 975–982. [DOI] [PubMed]
- Weber, P. C., Ohlendorf, D. H., Wendoloski, J. J. & Salemme, F. R. (1989). Science, 243, 85–88. [DOI] [PubMed]
- Weber, P. C., Wendoloski, J. J., Pantoliano, M. W. & Salemme, F. R. (1992). J. Am. Chem. Soc. 114, 3197–3200.
- Williams, T. & Kelley, C. (2007). Gnuplot http://www.gnuplot.info.
- Winn, M. D. et al. (2011). Acta Cryst. D67, 235–242.
- Zucker, F., Champ, P. C. & Merritt, E. A. (2010). Acta Cryst. D66, 889–900. [DOI] [PMC free article] [PubMed]
Associated Data
This section collects any data citations, data availability statements, or supplementary materials included in this article.
Supplementary Materials
PDB reference: streptavidin, 3ry1
PDB reference: streptavidin–biotin complex, 3ry2


