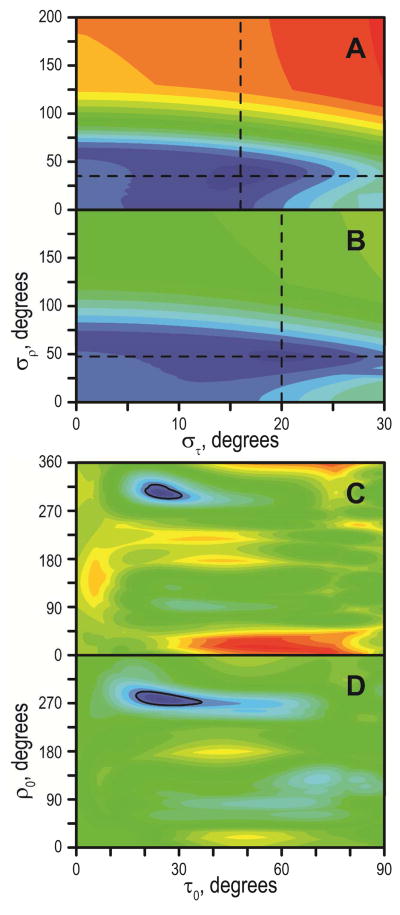
Figure 10.
Explicit dynamics analysis of GW5,19ALP23 (A, C) and GW3,21ALP23 in DLPC (B, D), showing the standard deviations of Gaussian distributions (A, B) and their centers (C, D). Six alanine residues were used for the analysis (see text). Dashed lines in A and B indicate the best fit στ and σρ, which were used for generating the plots in C and D, respectively. The color scale is identical between A and B (0 to 17 kHz, blue to red) and between C and D (0 to 22 kHz, blue to red). Color increments are 1 kHz; solid line in C, D is drawn at 3 kHz level. Best fits (τ0, στ, ρ0, σρ) are (25, 16, 303, 36) for GW5,19ALP23 and (25, 20, 278, 48) for GW3,21ALP23.

