Abstract
Background
In maintenance dialysis patients, low blood pressure (BP) values are associated with higher death rates when compared to normal to moderately high values. This “hypertension paradox” may be related to comorbid conditions. Dialysis patients with polycystic kidney disease (PKD) usually have a lower comorbidity burden and greater survival. We hypothesized that in PKD dialysis patients, a representative of a healthier dialysis patient population, high BP is associated with higher mortality.
Methods
Time-dependent survival models including after multivariate adjustment were examined to assess the association between pre- and post-hemodialysis BP and all-cause mortality in a 5-year cohort of 67,085 non-PKD and 1,579 PKD hemodialysis patients.
Results
In PKD patients low pre- and post-hemodialysis systolic BPs were associated with increased mortality, whereas high pre-hemodialysis diastolic BP was associated with greater survival. Fully adjusted death hazard ratios (and 95% confidence levels) for pre- and post-hemodialysis BP of <120 (reference: 140-<160 mmHg) were 1.30 (1.06-1.92) and 1.45 (1.04-2.02), respectively, and for pre-hemodialysis diastolic BP of >=80 (reference: 70-<80 mmHg) was 0.68 (0.49-0.93, all p-values <0.05). Similar associations were observed in non-PKD patients. In pooled analyses, within each commensurate BP stratum, PKD patients exhibited superior survival to non-PKD patients.
Conclusions
Among hemodialysis patients, those with PKD display a similar BP paradox as without PKD, even though within each BP category PKD patients maintain superior survival. Randomized clinical trials are needed to define optimal blood pressure targets in the haemodialysis population.
Keywords: hypertension, mortality, polycystic kidney disease, hemodialysis, reverse epidemiology
Introduction
More than eighty percent of the 400,000 patients on maintenance hemodialysis (MHD) in the United States have systolic hypertension.[1] Approximately two thirds of American MHD patients die within 5 years from the initiation of chronic dialysis treatment, most of them of cardiovascular (CV) disease.[1] The recommended blood pressure (BP) targets to be achieved by means of anti-hypertensive therapy or other interventions in MHD patients are recommended by the Kidney Disease Outcomes Quality Initiative (K/DOQI) to be <140 / 90 mmHg pre-hemodialysis and <130 / 80 post-hemodialysis.[2] Whereas a few studies have indicated that, similar to the general population,[3] high systolic or diastolic BP is associated with increased death risk in dialysis patients,[4-6] a number of large epidemiologic studies have paradoxically indicated inverse[5, 7-16] or U-shaped[9-12, 17-20] associations between BP and mortality in dialysis patients. It has been argued that discrepancies in these studies including the so-called “reverse epidemiology” of BP (or hypertension paradox) are related to differences in various clinical characteristics including comorbid conditions of the studied patient populations.[21]
Approximately 5% of MHD patients in the US suffer from polycystic kidney disease (PKD).[1] Hypertension is a common early finding in PKD patients, usually with an onset around the age 30, occurring in 50 to 70% of the cases before any significant reduction in the glomerular filtration rate could be noticed.[22-24] Affected young adults have a higher ambulatory BP and left ventricular mass index than age-matched controls.[25, 26] PKD patients who require MHD seem to be different from other MHD patients: they report better quality of life[27] and greater survival than non-PKD patients including non-diabetic MHD patients.[28-32] The relative risk (RR) of death is lower among MHD patients with PKD compared to non-diabetic dialysis patients (RR of 0.57, p<0.001),[31, 32] a survival advantage that is also observed among peritoneal dialysis patients.[33] These survival differences raise questions as to whether the recently described “reverse epidemiology” observation that characterizes the relationship of BP and survival in the general MHD population is also present in PKD patients, and about which BP range is associated with the greatest survival in this subset of MHD patients. Given the greater survival and lower comorbidity burden in PKD patients compared to other MHD patients, we hypothesized that a more conventional BP-mortality association can be observed in PKD patients.
Methods
Database Creation
The data warehouse of DaVita, Inc., the second largest dialysis care provider in the United States with ~500 dialysis center and ~40 000 patients across the country, (prior to acquisition of the former Gambro dialysis clinics and patients) includes comprehensive information on virtually all of its patients. A 60-month prevalent cohort (July 2001 through June 2006) of DaVita MHD patients was studied. Patients’ pre- and post-dialysis BP values during each thrice-weekly hemodialysis session were captured electronically. All repeated measures of every relevant variable for each patient within each calendar quarter or 13 weeks were averaged to obtain one quarterly mean value for that given variable. The study was approved by institutional review committees of Harbor-University of California, Los Angeles (UCLA) and DaVita. The study was conforming to ICP Good Clinical Practices Guidelines and the Declaration of Helsinki.
BP Measures
Seated pre- and post-hemodialysis BP values were measured during every single hemodialysis treatment session by means of automatically inflated cuffs using a digital monitor attached to each hemodialysis machine according to standard dialysis unit protocols. All available BP values of the same sort were averaged within each of the 20 calendar quarters of the 5 year cohort. For instance, if an MHD patient attended all 39 thrice-weekly hemodialysis treatment sessions over 13 weeks, all 39 pre-hemodialysis systolic BP (SBP) values were added and divided by 39 to obtain the averaged pre-hemodialysis SBP value for that calendar quarter of the given patient. BP values of <5 mmHg or >300 mmHg were deemed implausible and excluded from analyses. For sporadically missing values, we used the last-value-carried-forward approach. Patients were classified in BP groups according to their averaged BP values at the last quarter in the cohort. We divided the quarterly averaged pre- and post-hemodialysis BP values into 4 a priori selected categories of SBP (<120 mmHg, 120 to 139 mmHg 140 to 159 mmHg and ≥160 mmHg) and diatolic BP (DBP) (<60 mmHg, 60 to 69 mmHg, 70 to 79 mmHg and ≥80 mmHg). The exact number of patients, which was used in different analyzis, was presented in the Figures.
Cohort Time, Dialysis Vintage, and Death
Cohort time included the number of days patients participated in the cohort and ranged between 1 and 1,830 days. Dialysis vintage was defined as the duration of time between the first day of dialysis treatment and the first day that patients entered the cohort. Any patient with cohort time <90 days was excluded from analyses.
Laboratory Data
Most of the blood samples were drawn pre-dialysis with the exception of post-dialysis serum urea nitrogen to calculate urea kinetics. Blood samples were drawn using uniform techniques in all dialysis clinics across the country and were transported to the Central DaVita Laboratory in Deland, FL, usually within 24 hours. All laboratory values were measured via automated and standardized methods in DaVita Laboratory. Most laboratory values, including complete blood cell counts and serum levels of urea nitrogen, albumin, creatinine, iron and total iron-binding capacity (TIBC), were measured monthly. Serum ferritin was measured quarterly. Hemoglobin was measured weekly to bi-weekly in most patients. Another laboratory sample were taken monthly or weekly according to dialysis unit protocol. The values were averaged for each patient to calculate the value at each quarter including the baseline quarter. In Table 1 we have the mean values for each of the measurement for the each of BP category. Kt/V to reflect dialysis dose and normalized protein nitrogen appearance (nPNA), an estimation of daily protein intake, were measured monthly according to Daugirdas et al.[34] Eight laboratory variables (serum albumin associated with inflammation; nPCR, a marker of daily protein intake; serum TIBC (total Iron binding capacity), associated with global assessment of nutrition; serum ferritin, a possible marker of inflammation; serum creatinine, a marker of muscle mass; peripheral WBC (White Blood Cell) count that correlates with serum C-reactive protein, which predict infection and inflammation; percent of lymphocytes in WBC, a nutritional marker; blood hemoglobin level) were selected to indicate nutritional status and presence of inflammation, together also known as malnutrition-inflammation complex syndrome (MICS).[35]
Table 1.
Baseline characteristics of patients across baseline pre-hemodialysis systolic BP categories in 68,664 MHD patients who had at least one 3-month–averaged measure of BP, including 1,579 patients with PKD and 67,085 patients without PKD
| Variables | PKD (n=1,579) | p | Non-PKD (n=67,085) | p* | ||||||
|---|---|---|---|---|---|---|---|---|---|---|
| BP (mmHg) | <120 | 120-<140 | 140-<160 | >=160 | <120 | 120-<140 | 140-<160 | >=160 | ||
| N | 204 | 466 | 519 | 390 | 8,539 | 15,696 | 19,821 | 23,029 | ||
| Age (years) | 58±12 | 57±14 | 57±13 | 59±13 | 0.49 | 66±15 | 63±16 | 61±16 | 60±15 | <0.0001 |
|
Gender (%
women) |
43 | 39 | 44 | 49 | 0.32 | 41 | 41 | 44 | 49 | <0.0001 |
|
Diabetes mellitus
(%) |
11 | 8 | 10 | 7 | 0.33 | 44 | 33 | 45 | 51 | 0.01 |
| Race (%) | ||||||||||
| White | 71 | 70 | 66 | 72 | 0.19 | 58 | 51 | 46 | 41 | <0.0001 |
| Black | 11 | 11 | 17 | 16 | 0.02 | 24 | 28 | 30 | 36 | <0.0001 |
| Hispanic | 10 | 9 | 8 | 7 | 0.83 | 10 | 12 | 14 | 15 | <0.0001 |
| Asian | 2 | 3 | 3 | 2 | 0.72 | 2 | 3 | 3 | 3 | <0.0001 |
| Other | 6 | 7 | 6 | 3 | 0.99 | 6 | 6 | 7 | 5 | 0.002 |
| Vintage categories | ||||||||||
| <6 months | 15 | 12 | 11 | 13 | 0.34 | 29 | 19 | 14 | 13 | <0.0001 |
| 6-24 months | 41 | 47 | 42 | 39 | 0.17 | 43 | 45 | 44 | 44 | 0.019 |
| 2-5 years | 33 | 31 | 32 | 31 | 0.84 | 19 | 27 | 33 | 33 | <0.0001 |
| >5 years | 10 | 9 | 14 | 17 | 0.03 | 8 | 8 | 9 | 10 | 0.01 |
| Primary insurance | ||||||||||
| Medicare | 55 | 55 | 54 | 59 | 0.90 | 70 | 67 | 65 | 65 | <0.0001 |
| Medicaid | 4 | 3 | 3 | 3 | 0.55 | 5 | 5 | 5 | 6 | 0.08 |
| Private Insurance | 5 | 7 | 9 | 5 | 0.27 | 3 | 5 | 6 | 5 | <0.0001 |
| Other | 34 | 34 | 32 | 32 | 0.83 | 21 | 22 | 22 | 22 | 0.03 |
| Kt/V | 1.51±.0.29 | 1.54±.0.34 | 1.57±.0.4 | 1.54±.0.37 | 0.31 | 1.51±.0.39 | 1.53±.0.38 | 1.52±.0.37 | 1.51±.0.37 | 0.01 |
| KRU(%) | 0.43±.1.30 | 0.99±.2.11 | 0.70±1.60 | 0.68±.1.73 | 0.005 | 0.5±1.7 | 0.6±1.9 | 0.6±.1.8 | 0.58±1.7 | <0.0001 |
|
Dialysis Catheter
(%) |
58 | 54 | 60 | 61 | 0.82 | 82 | 78 | 78 | 79 | 0.0005 |
|
Comorbid
Conditions (%) |
||||||||||
| AIDS | 0 | 0.6 | 0.8 | 0.8 | 0.47 | 0.6 | 0.8 | 0.7 | 0.7 | 0.11 |
| Cancer | 4 | 4 | 4 | 5 | 0.72 | 7 | 6 | 5 | 4 | <0.0001 |
| CARARR c | 1 | 0 | 0.4 | 0.3 | 0.03 | 1 | 0.7 | 0.5 | 0.5 | <0.0001 |
| Heart Failure | 18 | 10 | 9 | 11 | 0.002 | 33 | 28 | 26 | 26 | <0.0001 |
| PVD | 5 | 3 | 3 | 5 | 0.20 | 14 | 12 | 11 | 11 | <0.0001 |
| DYSRHYT | 5 | 4 | 3 | 5 | 0.47 | 8 | 6 | 4 | 3 | <0.0001 |
| HIV + | 0.5 | 0.4 | 2 | 1 | 0.05 | 1 | 1 | 1 | 1 | 0.40 |
|
Ischemic Heart
Disease |
18 | 11 | 11 | 9 | 0.03 | 26 | 23 | 20 | 18 | <0.0001 |
| Myocardial Infarct | 8 | 4 | 3 | 4 | 0.02 | 10 | 8 | 6 | 6 | <0.0001 |
| Non-ambulatory | 1 | 0.9 | 1 | 0.8 | 0.98 | 4 | 3 | 2 | 2 | <0.0001 |
| Pulmonary Disease | 3 | 5 | 3 | 3 | 0.45 | 8 | 7 | 6 | 5 | <0.0001 |
| Smoker + | 9 | 7 | 5 | 7 | 0.15 | 4 | 5 | 5 | 5 | 0.15 |
| Albumin (g/dL) | 3.76±0.45 | 3.90±0.40 | 3.94±0.37 | 3.87±0.38 | <0.0001 | 3.43±0.59 | 3.40±0.51 | 3.65±0.49 | 3.63±0.47 | <0.0001 |
|
Creatinine
(mg/dL) |
7.9±2.6 | 7.9±2.6 | 8.6±2.7 | 8.2±2.7 | 0.001 | 6.2±2.8 | 6.8±3.0 | 7.2±3.0 | 7.5±3.0 | <0.0001 |
| TIBC (mg/dL) | 219±43 | 226±48 | 221±44 | 223±44 | 0.17 | 203±54 | 213±48 | 215±46 | 215±45 | <0.0001 |
|
Bicarbonate
(mmol/l) |
22.5±2.9 | 21.9±3.0 | 21.9±3.1 | 22.0±3.0 | 0.11 | 23.1±3.4 | 22.6±3.3 | 22.3±3.2 | 22.4±3.1 | <0.0001 |
|
Phosphorus
(mg/dL) |
5.7±1.6 | 5.7±1.3 | 5.7±1.4 | 5.9±1.6 | 0.34 | 5.1±1.5 | 5.3±1.4 | 5.5±1.5 | 5.7±1.5 | <0.0001 |
| Calcium (mg/dL) | 9.2±0.7 | 9.3±0.7 | 9.4±0.7 | 9.4±0.7 | 0.17 | 9.1±0.7 | 9.2±0.7 | 9.2±0.7 | 9.2±0.7 | <0.0001 |
| Ferritin (ng/mL) | 356±273 | 323±293 | 333±300 | 375±377 | 0.56 | 490±474 | 437±469 | 413±446 | 740±552 | <0.0001 |
|
Protein Catabolic
Rate (g/kg/day) |
0.94±0.25 | 0.95±0.24 | 0.96±0.24 | 0.96±0.24 | 0.54 | 0.88±0.27 | 0.92±0.26 | 0.93±0.26 | 0.93±0.25 | <0.0001 |
|
Blood hemoglobin
(g/dL) |
12.5±1.3 | 12.5±1.4 | 12.4±1.3 | 12.4±1.5 | 0.89 | 11.9±1.6 | 12.1±1.5 | 12.1±1.4 | 12.1±1.4 | <0.0001 |
| WBC (x103/l) | 7.1±2.5 | 6.9±2.2 | 6.6±1.9 | 6.8±2.1 | 0.84 | 7.9±3.3 | 7.6±2.8 | 7.6±2.5 | 7.5±2.3 | <0.0001 |
| BMI (kg/m2) | 26.3±7 | 26.7±6 | 26.6±6 | 26.5±6 | 0.78 | 26.3±7 | 26.9±7 | 27.1±7 | 27.6±7 | <0.0001 |
the p-values refer to comparisons of values in different BP categories within the PKD and non-PKD columns separately
Abbreviations: KRU: residual urine; AIDS: Acquired Immune Deficiency Syndrome; CARARR: cardiac arrhythmia; PVD: Peripheral Vascular Disease; DYSRHYT: other dysrhytmias; TIBC: Total Iron Binding Capacity; WBC: White Blood Cell; BMI: Body Mass index
Statistical Methods
Since the dialysis population is a dynamic cohort with a high turnover rate, a nonconcurrent cohort was formed to include all existing MHD patients of the first quarter (q1) and all new MHD patients of the subsequent quarters (q2 through q20). A baseline value was created for each measure by left-truncating the first available 13-week averaged value of the entry calendar quarter for each patient.
In addition to standard descriptive baseline statistics, time-dependent Cox regression for truncated and censored data was used to determine whether the 5-year survival was associated with time-varying BP. The reference category for all analyses was 140 to 159 mmHg for systolic BP and 70 to 79 mmHg for diastolic BP. These ranges were chosen as references because they were the modal categories (or adjacent to them with similar sample size). Five race/ethnic groups were generated: (1) whites (including non-Hispanic whites and Middle Easterners), (2) African Americans (including blacks and other Africans), (3) Asians (including Pacific Islanders), (4) Hispanics, and (5) others. For each analysis, 3 models were built based on the level of multivariate adjustment. (1) Unadjusted model included time-dependent BP categories and mortality data as well as the entry quarter indicators because of the nonconcurrent nature of the constructed cohort, (2) Case-mix–and dialysis dose–adjusted models also included age, gender, race-ethnicity, diabetes mellitus, vintage categories, primary insurance (Medicare, Medicaid, private, and others), marital status (married, single, divorced, widowed, and others), residual renal function during the last quarter (Kru), and the Kt/V (single pool) during the last quarter and (3) Case-mix– and MICS-adjusted models included all the above-mentioned covariates as well as 9 indicators of nutritional status and inflammation.[36] All descriptive and multivariate statistics were performed using SAS, version 9.2 (SAS Institute, Cary, NC).
Results
The original 60-month national database of all MHD patients included 161,144 subjects. After implementing the above-mentioned selection and merging criteria, the resulting cohort included 143,215 MHD patients, of whom 35,081 originated from the q1 data set and the rest from q2 through q20. Out of these, 68,664 MHD patients had at least one 3-month–averaged measure of BP and included 1,579 patients with PKD and 67,085 without PKD. The mean (± standard deviation [SD]) of age in non-PKD hemodialysis patients was 62±16 years; 44% of the patients were women, and 47% had diabetes. PKD patients were younger (58±13 years vs. 62±16 years; p<0.0001) and the proportion of diabetes (9% vs. 47%; p<0.0001) was lower among them. Serum albumin (3.89±0.40 g/dl vs. 3.60±0.51 g/dl; p<0.0001) and blood hemoglobin levels (12.4±1.40 g/dl vs. 12.1±1.5 g/dl; p<0.0001) were higher in PKD than non-PKD patients. Table 1 shows baseline demographic, clinical, and laboratory characteristics of the studied subjects. In the non-PKD population increasing SBP associated with younger age, higher proportion of women, longer time on dialysis and higher BMI (Table 1). In our dataset of the patients with measured blood pressure we have 12%/death rate in the total population; 6.4%/year in PKD and 12.3%/year in non-PKD patients, which was similar that reported in USRDS[1].
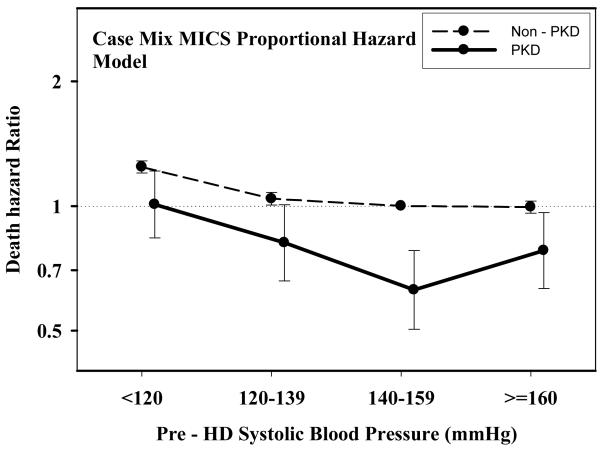
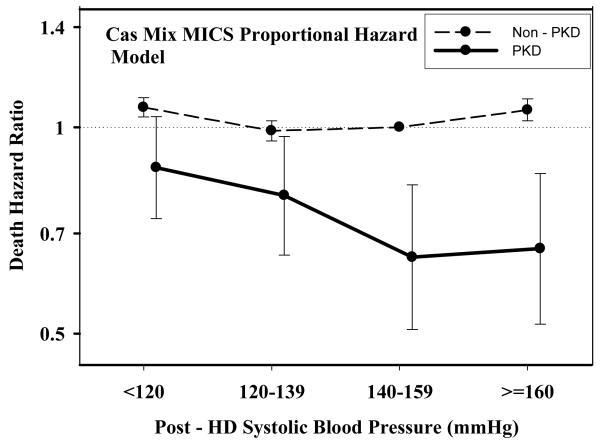
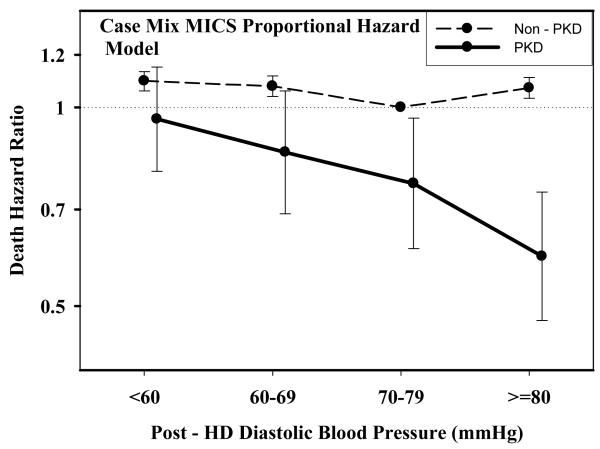
Table 2 and Figures 1 A through D show pooled analyses comparing mortality predictability of each BP category in PKD vs. non-PKD patients. In each analysis, the reference group consists of non-PKD hemodialysis patients (reference: 140-<160 mmHg and 70-<80 mmHg). The fully adjusted death hazard ratios (95% of confidence interval (CI)) for pre- and post-hemodialysis SBP of 140-<160 mmHg in PKD patients were 0.63 (0.50-0.78) and 0.65 (0.51-0.82), respectively. Similarly, the fully adjusted death hazard ratios (95%CI) for pre- and post-hemodialysis DBP of 70-<80 mmHg in PKD patients were 0.77 (0.62-0.97) and 0.77 (0.61-0.96), respectively.
Table 2.
Comparing the hazard ratios of all-cause death associated with pre- and post-dialysis systolic and diastolic BP categories in 1,579 MHD patients with PKD and 67085 MHD patients without PKD.
| Unadjusted | Case Mix adjusted | Case mix + MICS adjusted | ||||||||||
|---|---|---|---|---|---|---|---|---|---|---|---|---|
| Category | HR | 95% LCL |
95% UCL |
p-value | HR | 95% LCL |
95% UCL |
p-value | HR | 95% LCL |
95% UCL |
p-value |
| Pre-Dialysis Systolic Blood Pressure | ||||||||||||
| <120 PKD | 0.86 | 0.72 | 1.03 | 0.11 | 1.06 | 0.88 | 1.27 | 0.55 | 1.00 | 0.84 | 1.21 | 0.92 |
| <120 non-PKD | 1.65 | 1.59 | 1.70 | <0.0001 | 1.46 | 1.41 | 1.51 | <0.0001 | 1.24 | 1.20 | 1.29 | <0.0001 |
| 120-139 PKD | 0.56 | 0.45 | 0.69 | <0.0001 | 0.75 | 0.61 | 0.93 | <0.0001 | 0.82 | 0.66 | 1.01 | 0.06 |
| 120-139 non-PKD | 1.24 | 1.19 | 1.28 | <0.0001 | 1.12 | 1.09 | 1.16 | <0.0001 | 1.04 | 1.01 | 1.08 | 0.0205 |
| 140-159 PKD | 0.42 | 0.34 | 0.53 | <0.0001 | 0.57 | 0.46 | 0.71 | <0.0001 | 0.63 | 0.50 | 0.78 | <0.0001 |
| 140-159 non-PKD | 1 | 1 | 1 | 1 | 1 | 1 | 1 | 1 | 1 | 1 | ||
| >=160 PKD | 0.51 | 0.41 | 0.63 | <0.0001 | 0.69 | 0.56 | 0.85 | 0.0006 | 0.78 | 0.63 | 0.96 | 0.0216 |
| >=160 non-PKD | 0.89 | 0.86 | 0.92 | <0.0001 | 0.96 | 0.93 | 0.99 | 0.0189 | 0.99 | 0.96 | 1.03 | 0.7438 |
| Post-Dialysis Systolic Blood Pressure | ||||||||||||
| <120 PKD | 0.62 | 0.53 | 0.73 | <0.0001 | 0.86 | 0.72 | 1.02 | 0.082 | 0.87 | 0.74 | 1.04 | 0.12 |
| <120 non-PKD | 1.26 | 1.22 | 1.30 | <0.0001 | 1.18 | 1.14 | 1.22 | <0.0001 | 1.07 | 1.04 | 1.11 | <0.0001 |
| 120-139 PKD | 0.54 | 0.44 | 0.65 | <0.0001 | 0.70 | 0.57 | 0.85 | 0.0004 | 0.80 | 0.65 | 0.97 | 0.0241 |
| 120-139 non-PKD | 1.09 | 1.05 | 1.13 | <0.0001 | 1.01 | 0.98 | 1.05 | 0.44 | 0.99 | 0.96 | 1.02 | 0.49 |
| 140-159 PKD | 0.43 | 0.34 | 0.55 | <0.0001 | 0.59 | 0.47 | 0.76 | <0.0001 | 0.65 | 0.51 | 0.82 | 0.0004 |
| 140-159 non-PKD | 1 | 1 | 1 | 1.00 | 1.00 | 1.00 | 1 | 1 | 1 | |||
| >=160 PKD | 0.53 | 0.41 | 0.68 | <0.0001 | 0.59 | 0.46 | 0.75 | <0.0001 | 0.67 | 0.52 | 0.86 | 0.0016 |
| >=160 non-PKD | 1.01 | 0.97 | 1.04 | 0.73 | 1.04 | 1.00 | 1.08 | 0.0468 | 1.06 | 1.02 | 1.10 | 0.0019 |
| Pre-Dialysis Diastolic Blood Pressure | ||||||||||||
| <60 PKD | 0.88 | 0.72 | 1.07 | 0.19 | 1.13 | 0.93 | 1.38 | 0.22 | 1.07 | 0.88 | 1.31 | 0.49 |
| <60 non-PKD | 1.55 | 1.50 | 1.61 | <0.0001 | 1.38 | 1.33 | 1.43 | <0.0001 | 1.20 | 1.16 | 1.24 | <0.0001 |
| 60-69 PKD | 0.57 | 0.45 | 0.71 | <0.0001 | 0.81 | 0.64 | 1.01 | 0.065 | 0.86 | 0.69 | 1.08 | 0.20 |
| 60-69 non-PKD | 1.27 | 1.23 | 1.32 | <0.0001 | 1.20 | 1.16 | 1.24 | <0.0001 | 1.15 | 1.11 | 1.20 | <0.0001 |
| 70-79 PKD | 0.58 | 0.46 | 0.72 | <0.0001 | 0.68 | 0.54 | 0.85 | 0.0007 | 0.77 | 0.62 | 0.97 | 0.0233 |
| 70-79 non-PKD | 1 | 1 | 1 | 1 | 1 | 1 | 1 | 1 | 1 | |||
| >=80 PKD | 0.38 | 0.32 | 0.46 | <0.0001 | 0.56 | 0.47 | 0.68 | <0.0001 | 0.65 | 0.54 | 0.78 | <0.0001 |
| >=80 non-PKD | 0.82 | 0.80 | 0.85 | <0.0001 | 0.98 | 0.94 | 1.01 | 0.15 | 1.01 | 0.98 | 1.05 | 0.41 |
| Post-Dialysis Diastolic Blood Pressure | ||||||||||||
| <60 PKD | 0.77 | 0.64 | 0.92 | 0.0042 | 0.98 | 0.82 | 1.17 | 0.82 | 0.96 | 0.80 | 1.15 | 0.66 |
| <60 non-PKD | 1.35 | 1.31 | 1.40 | <0.0001 | 1.20 | 1.16 | 1.24 | <0.0001 | 1.10 | 1.06 | 1.13 | <0.0001 |
| 60-69 PKD | 0.55 | 0.44 | 0.68 | <0.0001 | 0.76 | 0.61 | 0.94 | 0.0102 | 0.86 | 0.69 | 1.06 | 0.15 |
| 60-69 non-PKD | 1.12 | 1.08 | 1.16 | <0.0001 | 1.09 | 1.06 | 1.13 | <0.0001 | 1.08 | 1.04 | 1.12 | <0.0001 |
| 70-79 PKD | 0.52 | 0.41 | 0.65 | <0.0001 | 0.68 | 0.54 | 0.86 | 0.0009 | 0.77 | 0.61 | 0.96 | 0.0221 |
| 70-79 non-PKD | 1 | 1 | 1 | 1 | 1 | 1 | 1 | 1 | 1 | |||
| >=80 PKD | 0.39 | 0.31 | 0.49 | <0.0001 | 0.52 | 0.42 | 0.65 | <0.0001 | 0.60 | 0.48 | 0.74 | <0.0001 |
| >=80 non-PKD | 0.93 | 0.89 | 0.96 | <0.0001 | 1.06 | 1.02 | 1.10 | 0.0015 | 1.07 | 1.03 | 1.11 | 0.0003 |
Figure 1.
A.: Comparing mortality-predictability of time-dependent Pre-Dialysis Systolic Blood Pressure in PKD vs. non-PKD hemodialysis patient in fully (case-mix and MICS) adjusted models
B.: Comparing mortality-predictability of time-dependent Pre-Dialysis Diastolic Blood Pressure in PKD vs. non-PKD hemodialysis patient in fully (case-mix and MICS) adjusted models
C.: Comparing mortality-predictability of time-dependent Post-Dialysis Systolic Blood Pressure in PKD vs. non-PKD hemodialysis patient in fully (case-mix and MICS) adjusted models
D.: Comparing mortality-predictability of time-dependent Post-Dialysis Diastolic Blood Pressure in PKD vs. non-PKD hemodialysis patient in fully (case-mix and MICS) adjusted models
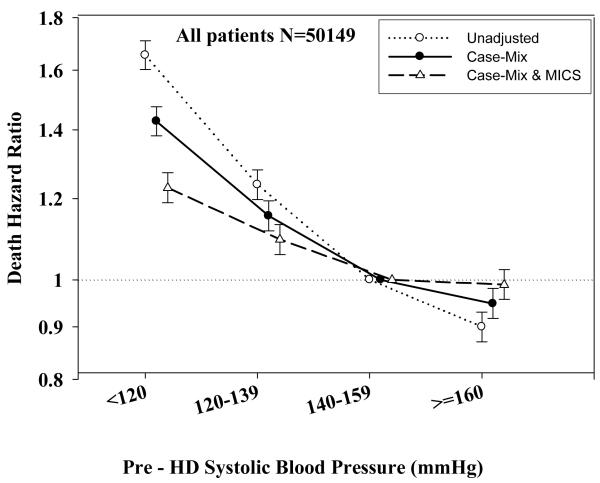
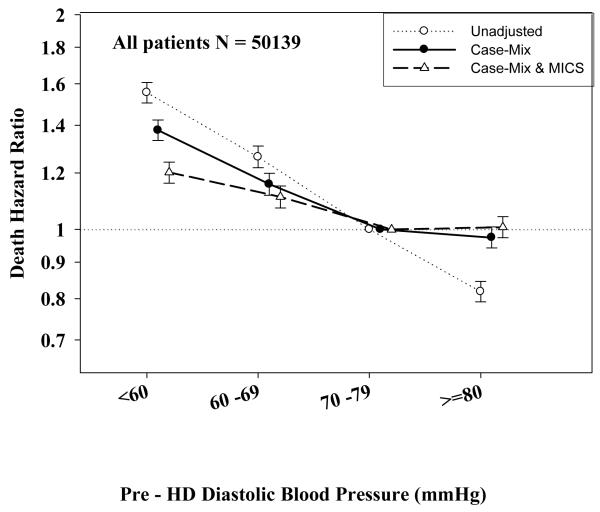
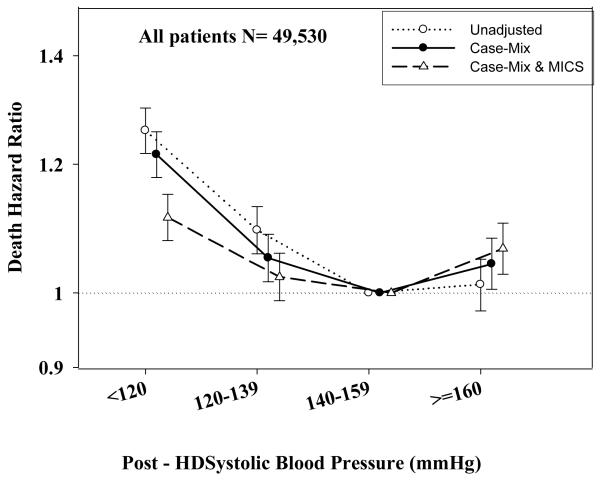
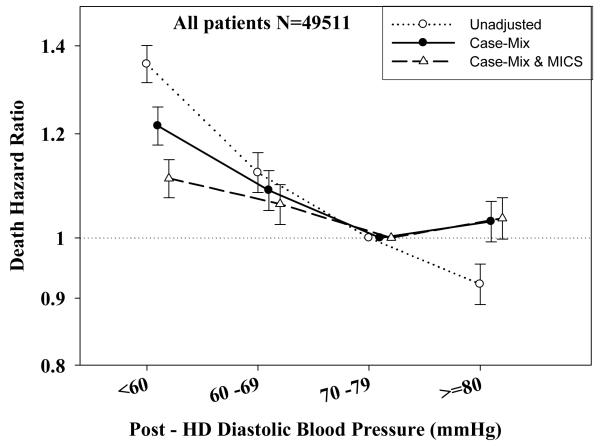
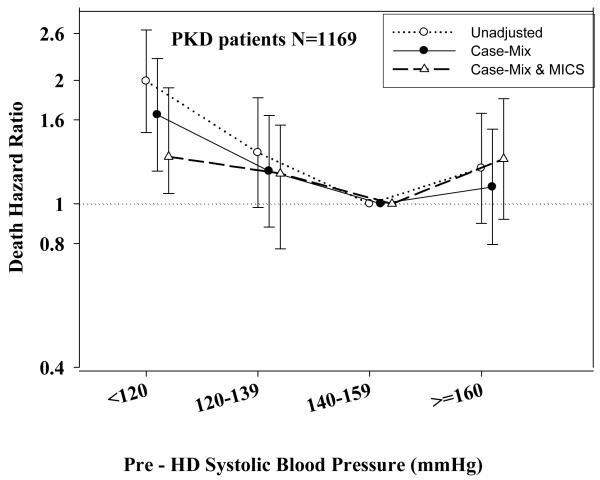
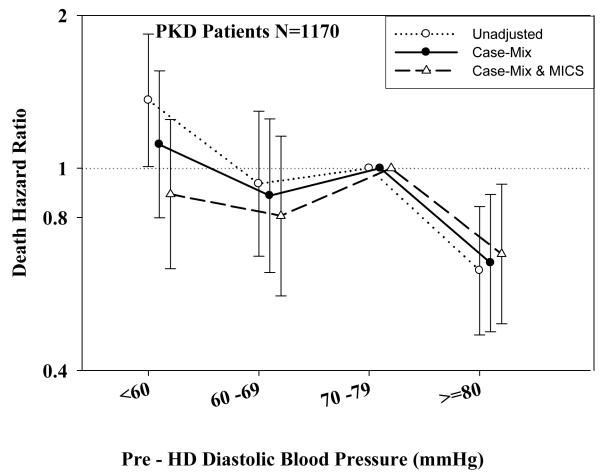
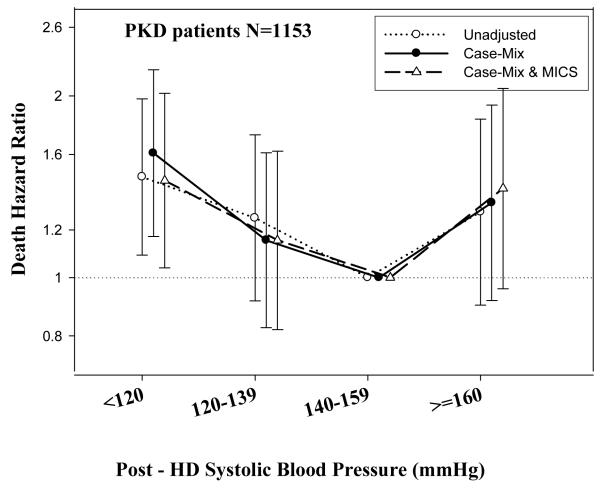
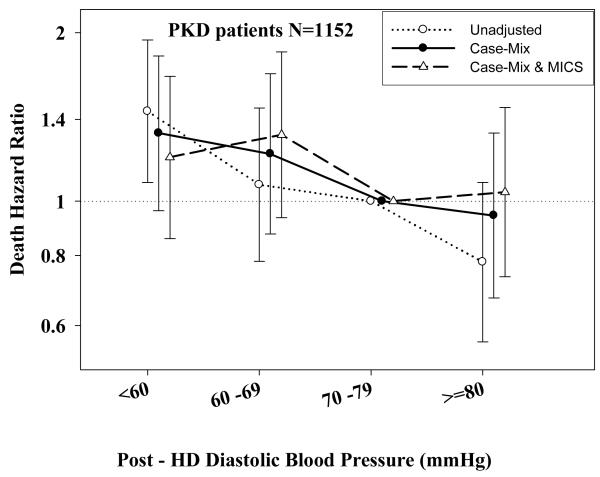
Tables 3 and 4 and Figures 2 and 3 show the hazard ratios of all-cause death for pre- and post-hemodialysis systolic and diastolic BP categories based on time-dependent Cox regression models in non-PKD and PKD patients, respectively. In both non-PKD and PKD populations, pre- and post-hemodialysis SBP displayed a reverse J-shaped association with mortality, especially for post-hemodialysis SBP values, in that normal to low (<120 mmHg) and high SBP (>160 mmHg) tended to be associated with higher mortality risk. The pre- & post-hemodialysis DBP values tended to exhibit a slightly more linear and inverse association with mortality, in that the highest DBP values (>80 mmHg) showed the greatest survival, whereas the lowest DBP values (<60 mmHg) tended to be associated with the highest death risk. The fully adjusted death hazard ratios (95% of CI) for pre- and post-hemodialysis SBP of <120 (reference: 140-<160 mmHg) in PKD patients were 1.30 (1.06-1.92) and 1.45 (1.04-2.02), respectively, and for pre-hemodialysis DBP of >=80 (reference: 70-<80 mmHg) was 0.68 (0.49-0.93).
Table 3.
Hazard ratios of all-cause death associated with pre- and post-dialysis systolic and diastolic BP categories, estimated from time-dependent Cox models in 67,085 MHD patients without PKD
| Unadjusted | Case Mix adjusted | Case mix + MICS adjusted | ||||||||||
|---|---|---|---|---|---|---|---|---|---|---|---|---|
| Category | HR | 95% LCL |
95% UCL |
p-value | HR | 95% LCL |
95% UCL |
p-value | HR | 95% LCL |
95% UCL |
p-value |
| Pre-Dialysis Systolic Blood Pressure | ||||||||||||
| <120 | 1.71 | 1.60 | 1.82 | <0.0001 | 1.43 | 1.38 | 1.48 | <0.0001 | 1.23 | 1.19 | 1.27 | <0.0001 |
| 120-139 | 1.28 | 1.20 | 1.37 | <0.0001 | 1.15 | 1.12 | 1.19 | <0.0001 | 1.10 | 1.06 | 1.13 | <0.0001 |
| 140-159 | 1 | 1 | 1 | 1 | 1 | 1 | 1 | 1 | 1 | |||
| >=160 | 0.93 | 0.87 | 0.98 | <0.0001 | 0.95 | 0.92 | 0.98 | 0.002 | 0.98 | 0.96 | 1.02 | 0.53 |
| Post-Dialysis Systolic Blood Pressure | ||||||||||||
| <120 | 1.26 | 1.22 | 1.30 | <0.0001 | 1.22 | 1.18 | 1.26 | <0.0001 | 1.11 | 1.08 | 1.15 | <0.0001 |
| 120-139 | 1.09 | 1.06 | 1.13 | <0.0001 | 1.05 | 1.02 | 1.09 | 0.004 | 1.02 | 0.98 | 1.06 | 0.18 |
| 140-159 | 1 | 1 | 1 | 1 | 1 | 1 | 1 | 1 | 1 | |||
| >=160 | 1.01 | 0.98 | 1.05 | 0.54 | 1.04 | 1.01 | 1.08 | 0.03 | 1.07 | 1.03 | 1.10 | 0.0007 |
| Pre-Dialysis Diastolic Blood Pressure | ||||||||||||
| <60 | 1.56 | 1.50 | 1.61 | <0.0001 | 1.38 | 1.33 | 1.42 | <0.0001 | 1.20 | 1.16 | 1.24 | <0.0001 |
| 60 -69 | 1.26 | 1.22 | 1.31 | <0.0001 | 1.16 | 1.12 | 1.20 | <0.0001 | 1.11 | 1.07 | 1.15 | <0.0001 |
| 70 -79 | 1 | 1 | 1 | 1 | 1 | 1 | 1 | 1 | 1 | |||
| >=80 | 0.82 | 0.79 | 0.85 | <0.0001 | 0.97 | 0.94 | 1.01 | 0.13 | 1.01 | 0.97 | 1.04 | 0.67 |
| Post-Dialysis Diastolic Blood Pressure | ||||||||||||
| <60 | 1.36 | 1.31 | 1.40 | <0.0001 | 1.22 | 1.18 | 1.26 | <0.0001 | 1.11 | 1.07 | 1.15 | <0.0001 |
| 60 -69 | 1.12 | 1.08 | 1.16 | <0.0001 | 1.09 | 1.05 | 1.13 | <0.0001 | 1.06 | 1.02 | 1.10 | 0.0009 |
| 70 -79 | 1 | 1 | 1 | 1 | 1 | 1 | 1 | 1 | 1 | |||
| >=80 | 0.92 | 0.89 | 0.96 | <0.0001 | 1.03 | 0.99 | 1.07 | 0.12 | 1.04 | 0.99 | 1.07 | 0.06 |
Table 4.
Hazard ratios of all-cause death associated with pre- and post-dialysis systolic and diastolic BP categories estimated from time-dependent Cox models in 1,579 MHD patients with PKD as the cause of ESRD.
| Unadjusted | Case Mix adjusted | Case mix + MICS adjusted | ||||||||||
|---|---|---|---|---|---|---|---|---|---|---|---|---|
| Category | HR | 95% LCL |
95% UCL |
p-value | HR | 95% LCL |
95% UCL |
p-value | HR | 95% LCL |
95% UCL |
p-value |
| Pre-Dialysis Systolic Blood Pressure | ||||||||||||
| <120 | 1.99 | 1.49 | 2.65 | <0.0001 | 1.65 | 1.20 | 2.26 | 0.002 | 1.30 | 1.06 | 1.92 | 0.02 |
| 120-139 | 1.33 | 0.98 | 1.81 | 0.07 | 1.20 | 0.88 | 1.64 | 0.25 | 1.18 | 0.78 | 1.55 | 0.59 |
| 140-159 | 1 | 1 | 1 | 1 | 1 | 1 | 1 | 1 | 1 | |||
| >=160 | 1.22 | 0.90 | 1.66 | 0.21 | 1.10 | 0.80 | 1.52 | 0.56 | 1.29 | 0.92 | 1.80 | 0.23 |
| Post-Dialysis Systolic Blood Pressure | ||||||||||||
| <120 | 1.47 | 1.09 | 1.98 | 0.01 | 1.61 | 1.17 | 2.21 | 0.004 | 1.45 | 1.04 | 2.02 | 0.03 |
| 120-139 | 1.26 | 0.92 | 1.72 | 0.15 | 1.15 | 0.83 | 1.61 | 0.40 | 1.15 | 0.82 | 1.62 | 0.41 |
| 140-159 | 1 | 1 | 1 | 1 | 1 | 1 | 1 | 1 | 1 | |||
| >=160 | 1.28 | 0.90 | 1.83 | 0.16 | 1.33 | 0.92 | 1.93 | 0.13 | 1.41 | 0.96 | 2.06 | 0.08 |
| Pre-Dialysis Diastolic Blood Pressure | ||||||||||||
| <60 | 1.36 | 1.00 | 1.84 | 0.0443 | 1.11 | 0.80 | 1.55 | 0.52 | 0.89 | 0.63 | 1.25 | 0.49 |
| 60 -69 | 0.93 | 0.67 | 1.30 | 0.68 | 0.88 | 0.62 | 1.25 | 0.48 | 0.81 | 0.56 | 1.16 | 0.24 |
| 70 -79 | 1 | 1 | 1 | 1 | 1 | 1 | 1 | 1 | 1 | |||
| >=80 | 0.629 | 0.47 | 0.84 | 0.0017 | 0.65 | 0.48 | 0.89 | 0.007 | 0.68 | 0.49 | 0.93 | 0.02 |
| Post-Dialysis Diastolic Blood Pressure | ||||||||||||
| <60 | 1.45 | 1.08 | 1.94 | 0.01 | 1.32 | 0.96 | 1.82 | 0.08 | 1.20 | 0.95 | 1.67 | 0.06 |
| 60 -69 | 1.07 | 0.78 | 1.47 | 0.67 | 1.22 | 0.87 | 1.69 | 0.24 | 1.31 | 0.94 | 1.85 | 0.8 |
| 70 -79 | 1 | 1 | 1 | 1 | 1 | 1 | 1 | 1 | 1 | |||
| >=80 | 0.78 | 0.56 | 1.08 | 0.13 | 0.94 | 0.67 | 1.32 | 0.73 | 1.04 | 0.73 | 1.47 | 0.96 |
Figure 2.
A.: Association between time-dependent Pre-Dialysis Systolic Blood Pressure and five-year all-cause mortality in MHD patients without PKD
B: Association between time-dependent Pre-Dialysis Diastolic Blood Pressure and five-year all-cause mortality in MHD patients without PKD.
C.: Association between time-dependent Post-Dialysis Systolic Blood Pressure and five-year all-cause mortality in MHD patients without PKD.
D: Association between time-dependent Post-Dialysis Diastolic Blood Pressure and five-year all-cause mortality in MHD patients without PKD
Figure 3.
A.: Association between time-dependent Pre-Dialysis Systolic Blood Pressure and five-year all-cause mortality in MHD patients with PKD.
B.: Association between time-dependent Pre-Dialysis Diastolic Blood Pressure and five-year all-cause mortality in MHD patients with PKD.
C.: Association between time-dependent Post-Dialysis Systolic Blood Pressure and five-year all-cause mortality in MHD patients with PKD.
D.: Association between time-dependent Post-Dialysis Diastolic Blood Pressure and five-year all-cause mortality in MHD patients with PKD.
Discussion
In our present prospective cohort study we found that lower pre- and post-hemodialysis SBP was associated with increased mortality in PKD and non-PKD patients contrary to our original hypothesis. The altered risk factor patterns for BP are thus present in both PKD and non-PKD patients. Extrapolation of the general population BP targets to dialysis patients may not be appropriate, irrespective of their PKD status.
Contrary to the general population where high BP is associated with a linear increase in cardiovascular mortality risk,[3] multiple studies in MHD reported either U or J shaped risk curves associated with BP.[9-12, 17-20] Our present study confirms these altered risk factor patterns in the overall MHD population, which remained present in spite of extensive adjustment for various comorbid conditions and laboratory parameters. Since the altered risk relationship between BP and mortality may be due to underlying patient characteristics we expected that a group of MHD patients with a relatively low comorbidity burden and better overall mortality rate may display an association between BP and mortality that resembles the one seen in the general population. While the association between BP and mortality in our PKD population showed subtle differences compared to the overall MHD population, the relationship nevertheless remained a “reverse” one, with patients in the lowest SBP category displaying the highest mortality rates. We found no associations between higher SBP and mortality in the PKD group, but patients in the highest DBP category experienced significantly lower mortality rates. Chang et al. also failed to show association between higher SBP and higher mortality after improved accounting for comorbid conditions in prevalent hemodialysis patients.[37]
Another finding in our study was the different risks associated with similar pre- and post-dialysis blood pressures: while both lower pre- and post-dialysis BP levels were associated with higher mortality, higher BP levels only showed an association with increased mortality for post-dialysis (but not pre-dialysis) measurements. To our knowledge no study has been published reporting different associations for mortality between pre- and post-dialysis BP. Some recent papers have found similar risk-relationships to ours,[9-12, 17-20] but others showed that high SBP increased the risk of all-cause mortality,[4-6] similarly to what was found in the general population.[3] A potential explanation for the different results can be that our sample is larger and has a different case mix compared to previous ones.[4, 6] Due to the marked differences in the observed risk factor pattern for BP, the various discrepancies between observational studies and the lack of properly powered clinical trials the optimal blood pressure level in MHD patients remains unclear. A recent Cochrane Systemic Review did not confirm that lower blood pressure (<135/85 mmHg) has a more positive effect on mortality than standard BP targets (</= 140-160/ 90-100 mmHg),[38] and our data suggest that in the overall MHD population the ideal BP may be 140-159/70-79 mmHg after dialysis and higher than 140/70 mmHg before dialysis.
There are some potential explanations as to why low BP is associated with elevated mortality risk in MHD patients. Hypotension may signal the presence of subclinically significant risk factors or comorbidities such as heart failure or ischemic cardiomyopathy.[13] However, even if we assume that the inverse association between BP and mortality in MHD patients is attributable to the concomitant presence of CHF in these patients, the similar inverse associations between BP and outcomes described in CHF populations suggest the presence of alternative mechanisms of action.[39] Normal-to-low predialysis BP may increase the risk of ischemic injury during ultrafiltration leading to increased mortality in MHD patients,[40] but this would also not explain why lower BP levels are associated with higher mortality in other patient populations such as those with CHF or with non-dialysis dependent CKD.[39, 41, 42] A unifying explanation could be overall end-organ hypoperfusion caused by low BP irrespective of ultrafiltration, which is also supported by the association of low post-dialysis BP with mortality.
Since most of the MHD patients die within 5 years of commencing dialysis treatment, the long-term effects of conventional CV risk factors on mortality may be replaced by the short-term effects of these or other risk factors, such as undernutrition and inflammation, together known as malnutrition-inflammation complex syndrome (MICS) or Protein-Energy Wasting (PEW).[43] Since the mechanism of action whereby hypertension exerts its deleterious cardiovascular effects may require a long time to induce their consequences it is possible that patients with higher degrees of comorbidity such as those on MHD expire before such long term effects become apparent, thus leading to an overall lack of, or a more subdued association between higher BP and mortality.
There are some potential explanations as to why low BP was also associated with mortality in PKD patients in spite of the overall lower mortality and the lower degree of comorbidity seen in these patients. In PKD patients with low BP the proportion of patients with CHF was significantly higher compared to those with higher BP (Table 1). The inverse association between BP and mortality in PKD patients could thus be attributable to the coexistence of CHF in these patients. Additionally, in PKD patients a low or normal BP may also be associated with impaired exercise-induced vasodilatation,[44] which could contribute to an unsatisfactory perfusion of coronary arteries resulting in cardiovascular events.
Strengths of our study are its prospective design, the high number of patients and the extensive adjustment for covariates.Our study, however, needs to be qualified for several potential limitations. The study design does not allow for causal inferences. Our study lacked data on potentially pertinent variables such as detailed cardiovascular comorbidities, heart rate and medication use, hence residual confounding is possible. The relatively low number of PKD patients may have limited our ability to detect differences of lesser magnitude, but was large enough to allow the detection of meaningful associations. We did not have information about antihypertensive agents and, hence, could not account for their effects on survival independent of blood pressure lowering. Another limitation is our study is the high rate of missing laboratory values, which might have had a significant impact on our results.
Perspectives
Among hemodialysis patients, those with PKD display a similar BP paradox as their counterparts without PKD. Extrapolation of general population BP targets may not be appropriate for dialysis patients, whether or not they suffer from PKD or not. There are subtle differences in the association between BP and mortality in PKD and non-PKD patients, suggesting that therapeutic regimens should be individualized, but clinical trials are needed to clarify what optimal BP targets should be in different MHD patient subgroups. The results of epidemiologic studies such as ours could be utilized when developing such trials in order to target patient populations who could best benefit from new treatment paradigms.
Acknowledgement
The abstracts of this paper were presented orally during the American Society of Nephrology (ASN) annual conferences, October 27-30, 2009, in San Diego. We thank Mr. Robert Lehn at DaVita Laboratories in Deland, FL, Mr. Joe Weldon, from DaVita Informatics, for proving the national database, and Mr. Chris Rucker, Dr. Mahesh Krishnan and Ms. Beth Bennett from DaVita Clinical Research for their continued support.
Source of Funding: The study was supported by KKZ’s research grants from the National Kidney Foundation of Southern California. Additional sources of funds include grants from the National Institute of Diabetes, Digestive and Kidney Disease of the National Institute of Health (R01 DK078106) and a philanthropic grant from Mr. Harold Simmons. Dr. Miklos Zsolt Molnar received grants from the National Research Fund (NKTH-OTKA-EU 7KP-HUMAN-MB08-A-81231), was also supported by the János Bolyai Research Scholarship of the Hungarian Academy of Sciences (2008-2011), and is recipient of the Hungarian Eötvös Scholarship (MÖB/66-2/2010).
Footnotes
Relevant Potential Conflict of Interest: Drs. Nissenson is an employee of DaVita. Dr. Kalantar-Zadeh is the medical director of DaVita Harbor-UCLA/MFI in Long Beach, CA. Other authors have not declared any conflict of interest.
This is a PDF file of an unedited manuscript that has been accepted for publication. As a service to our customers we are providing this early version of the manuscript. The manuscript will undergo copyediting, typesetting, and review of the resulting proof before it is published in its final citable form. Please note that during the production process errors may be discovered which could affect the content, and all legal disclaimers that apply to the journal pertain.
References
- 1.US Renal Data System . USRDS 2009 Annual Data Report: Atlas of Chronic Kidney Disease and End-Stage Renal Disease in the Untied States. National Institute of Health. Volume3. National Institute of Health, National Institute of Diabetes and Digestive and Kidney Disease; Betheda, MD: 2009. [Google Scholar]
- 2.National Kidney Foundation K/ DOQI clinical practice guidelines for cardiovascular disease in dialysis patients. Am J Kidney Dis. 2005;45:S1–S153. [PubMed] [Google Scholar]
- 3.Vasan RS, Larson MG, Leip EP, Evans JC, O’Donnell CJ, Kannel WB, Levy D. Impact of high-normal blood pressure on the risk of cardiovascular disease. N Engl J Med. 2001;345:1291–1297. doi: 10.1056/NEJMoa003417. [DOI] [PubMed] [Google Scholar]
- 4.Tomita J, Kimura G, Inoue T, Inenaga T, Sanai T, Kawano Y, et al. Role of systolic blood pressure in determining prognosis of hemodialyzed patients. Am J Kidney Dis. 1995;25:405–412. doi: 10.1016/0272-6386(95)90101-9. [DOI] [PubMed] [Google Scholar]
- 5.Foley RN, Herzog CA, Collins AJ. Blood pressure and long-term mortality in United States hemodialysis patients: USRDS Waves 3 and 4 Study. Kidney Int. 2002;62:1784–1790. doi: 10.1046/j.1523-1755.2002.00636.x. [DOI] [PubMed] [Google Scholar]
- 6.Fernandez JM, Carbonell ME, Mazzuchi N, Petruccelli D. Simultaneous analysis of morbidity and mortality factors in chronic hemodialysis patients. Kidney Int. 1992;41:1029–1034. doi: 10.1038/ki.1992.156. [DOI] [PubMed] [Google Scholar]
- 7.Foley RN, Parfrey PS, Harnett JD, Kent GM, Murray DC, Barre PE. Impact of hypertension on cardiomyopathy, morbidity and mortality in end-stage renal disease. Kidney Int. 1996;49:1379–1385. doi: 10.1038/ki.1996.194. [DOI] [PubMed] [Google Scholar]
- 8.Klassen PS, Lowrie EG, Reddan DN, DeLong ER, Coladonato JA, Szczech LA, et al. Association between pulse pressure and mortality in patients undergoing maintenance hemodialysis. Jama. 2002;287:1548–1555. doi: 10.1001/jama.287.12.1548. [DOI] [PubMed] [Google Scholar]
- 9.Li Z, Lacson E, Jr., Lowrie EG, Ofsthun NJ, Kuhlmann MK, Lazarus JM, Levin NW. The epidemiology of systolic blood pressure and death risk in hemodialysis patients. Am J Kidney Dis. 2006;48:606–615. doi: 10.1053/j.ajkd.2006.07.005. [DOI] [PubMed] [Google Scholar]
- 10.Stidley CA, Hunt WC, Tentori F, Schmidt D, Rohrscheib M, Paine S, et al. Changing relationship of blood pressure with mortality over time among hemodialysis patients. J Am Soc Nephrol. 2006;17:513–520. doi: 10.1681/ASN.2004110921. [DOI] [PubMed] [Google Scholar]
- 11.Port FK, Hulbert-Shearon TE, Wolfe RA, Bloembergen WE, Golper TA, Agodoa LY, Young EW. Predialysis blood pressure and mortality risk in a national sample of maintenance hemodialysis patients. Am J Kidney Dis. 1999;33:507–517. doi: 10.1016/s0272-6386(99)70188-5. [DOI] [PubMed] [Google Scholar]
- 12.Kalantar-Zadeh K, Kilpatrick RD, McAllister CJ, Greenland S, Kopple JD. Reverse epidemiology of hypertension and cardiovascular death in the hemodialysis population: the 58th annual fall conference and scientific sessions. Hypertension. 2005;45:811–817. doi: 10.1161/01.HYP.0000154895.18269.67. [DOI] [PubMed] [Google Scholar]
- 13.Iseki K, Miyasato F, Tokuyama K, Nishime K, Uehara H, Shiohira Y, et al. Low diastolic blood pressure, hypoalbuminemia, and risk of death in a cohort of chronic hemodialysis patients. Kidney Int. 1997;51:1212–1217. doi: 10.1038/ki.1997.165. [DOI] [PubMed] [Google Scholar]
- 14.Blacher J, Guerin AP, Pannier B, Marchais SJ, Safar ME, London GM. Impact of aortic stiffness on survival in end-stage renal disease. Circulation. 1999;99:2434–2439. doi: 10.1161/01.cir.99.18.2434. [DOI] [PubMed] [Google Scholar]
- 15.Salem MM. Hypertension in the haemodialysis population: any relationship to 2-years survival? Nephrol Dial Transplant. 1999;14:125–128. doi: 10.1093/ndt/14.1.125. [DOI] [PubMed] [Google Scholar]
- 16.Goldfarb-Rumyantzev AS, Baird BC, Leypoldt JK, Cheung AK. The association between BP and mortality in patients on chronic peritoneal dialysis. Nephrol Dial Transplant. 2005;20:1693–1701. doi: 10.1093/ndt/gfh856. [DOI] [PubMed] [Google Scholar]
- 17.Zager PG, Nikolic J, Brown RH, Campbell MA, Hunt WC, Peterson D, et al. “U” curve association of blood pressure and mortality in hemodialysis patients. Medical Directors of Dialysis Clinic, Inc. Kidney Int. 1998;54:561–569. doi: 10.1046/j.1523-1755.1998.00005.x. [DOI] [PubMed] [Google Scholar]
- 18.Lynn KL, McGregor DO, Moesbergen T, Buttimore AL, Inkster JA, Wells JE. Hypertension as a determinant of survival for patients treated with home dialysis. Kidney Int. 2002;62:2281–2287. doi: 10.1046/j.1523-1755.2002.00685.x. [DOI] [PubMed] [Google Scholar]
- 19.Mazzuchi N, Carbonell E, Fernandez-Cean J. Importance of blood pressure control in hemodialysis patient survival. Kidney Int. 2000;58:2147–2154. doi: 10.1111/j.1523-1755.2000.00388.x. [DOI] [PubMed] [Google Scholar]
- 20.Degoulet P, Legrain M, Reach I, Aime F, Devries C, Rojas P, Jacobs C. Mortality risk factors in patients treated by chronic hemodialysis. Report of the Diaphane collaborative study. Nephron. 1982;31:103–110. doi: 10.1159/000182627. [DOI] [PubMed] [Google Scholar]
- 21.Messerli FH, Mancia G, Conti CR, Hewkin AC, Kupfer S, Champion A, et al. Dogma disputed: can aggressively lowering blood pressure in hypertensive patients with coronary artery disease be dangerous? Ann Intern Med. 2006;144:884–893. doi: 10.7326/0003-4819-144-12-200606200-00005. [DOI] [PubMed] [Google Scholar]
- 22.Ecder T, Schrier RW. Hypertension in autosomal-dominant polycystic kidney disease: early occurrence and unique aspects. J Am Soc Nephrol. 2001;12:194–200. doi: 10.1681/ASN.V121194. [DOI] [PubMed] [Google Scholar]
- 23.Chapman AB, Johnson A, Gabow PA, Schrier RW. The renin-angiotensin-aldosterone system and autosomal dominant polycystic kidney disease. N Engl J Med. 1990;323:1091–1096. doi: 10.1056/NEJM199010183231602. [DOI] [PubMed] [Google Scholar]
- 24.Bell PE, Hossack KF, Gabow PA, Durr JA, Johnson AM, Schrier RW. Hypertension in autosomal dominant polycystic kidney disease. Kidney Int. 1988;34:683–690. doi: 10.1038/ki.1988.233. [DOI] [PubMed] [Google Scholar]
- 25.Zeier M, Geberth S, Schmidt KG, Mandelbaum A, Ritz E. Elevated blood pressure profile and left ventricular mass in children and young adults with autosomal dominant polycystic kidney disease. J Am Soc Nephrol. 1993;3:1451–1457. doi: 10.1681/ASN.V381451. [DOI] [PubMed] [Google Scholar]
- 26.Almeida EA, Oliveira EI, Lopes JA, Almeida AG, Prata MM. Tissue Doppler imaging in the evaluation of left ventricular function in young adults with autosomal dominant polycystic kidney disease. Am J Kidney Dis. 2006;47:587–592. doi: 10.1053/j.ajkd.2005.12.023. [DOI] [PubMed] [Google Scholar]
- 27.Rizk D, Jurkovitz C, Veledar E, Bagby S, Baumgarten DA, Rahbari-Oskoui F, et al. Quality of life in autosomal dominant polycystic kidney disease patients not yet on dialysis. Clin J Am Soc Nephrol. 2009;4:560–566. doi: 10.2215/CJN.02410508. [DOI] [PMC free article] [PubMed] [Google Scholar]
- 28.Fourtounas C, Panteris V, Valis D. Survival after end-stage renal disease in autosomal dominant polycystic kidney disease. Am J Kidney Dis. 2002;39:660. doi: 10.1053/ajkd.2002.32161. [DOI] [PubMed] [Google Scholar]
- 29.Zeier M, Jones E, Ritz E. Autosomal dominant polycystic kidney disease--the patient on renal replacement therapy. Nephrol Dial Transplant. 1996;11(Suppl 6):18–20. doi: 10.1093/ndt/11.supp6.18. [DOI] [PubMed] [Google Scholar]
- 30.Pirson Y, Christophe JL, Goffin E. Outcome of renal replacement therapy in autosomal dominant polycystic kidney disease. Nephrol Dial Transplant. 1996;11(Suppl 6):24–28. doi: 10.1093/ndt/11.supp6.24. [DOI] [PubMed] [Google Scholar]
- 31.Perrone RD, Ruthazer R, Terrin NC. Survival after end-stage renal disease in autosomal dominant polycystic kidney disease: contribution of extrarenal complications to mortality. Am J Kidney Dis. 2001;38:777–784. doi: 10.1053/ajkd.2001.27720. [DOI] [PubMed] [Google Scholar]
- 32.Alam A, Perrone RD. Management of ESRD in Patients With Autosomal Dominant Polycystic Kidney Disease. Adv Chronic Kidney Dis. 2010;17:164–172. doi: 10.1053/j.ackd.2009.12.006. [DOI] [PubMed] [Google Scholar]
- 33.Abbott KC, Agodoa LY. Polycystic kidney disease at end-stage renal disease in the United States: patient characteristics and survival. Clin Nephrol. 2002;57:208–214. doi: 10.5414/cnp57208. [DOI] [PubMed] [Google Scholar]
- 34.Daugirdas JT. The post: pre dialysis plasma urea nitrogen ratio to estimate K.t/V and NPCR: validation. Int J Artif Organs. 1989;12:420–427. [PubMed] [Google Scholar]
- 35.Kalantar-Zadeh K, Ikizler TA, Block G, Avram MM, Kopple JD. Malnutrition-inflammation complex syndrome in dialysis patients: causes and consequences. Am J Kidney Dis. 2003;42:864–881. doi: 10.1016/j.ajkd.2003.07.016. [DOI] [PubMed] [Google Scholar]
- 36.Salahudeen AK. Obesity and survival on dialysis. Am J Kidney Dis. 2003;41:925–932. doi: 10.1016/s0272-6386(03)00189-6. [DOI] [PubMed] [Google Scholar]
- 37.Chang TI, Friedman GD, Cheung AK, Greene T, Desai M, Chertow GM. Systolic blood pressure and mortality in prevalent haemodialysis patients in the HEMO study. J Hum Hypertens. 2010 doi: 10.1038/jhh.2010.42. [DOI] [PMC free article] [PubMed] [Google Scholar]
- 38.Arguedas JA, Perez MI, Wright JM. Treatment blood pressure targets for hypertension. Cochrane Database Syst Rev. 2009 doi: 10.1002/14651858.CD004349.pub2. CD004349. [DOI] [PubMed] [Google Scholar]
- 39.Grigorian-Shamagian L, Gonzalez-JuAnatey JR, Vazquez R, Cinca J, Bayes-Genis A, Pascual D, et al. Association of blood pressure and its evolving changes with the survival of patients with heart failure. J Card Fail. 2008;14:561–568. doi: 10.1016/j.cardfail.2008.03.006. [DOI] [PubMed] [Google Scholar]
- 40.Shoji T, Tsubakihara Y, Fujii M, Imai E. Hemodialysis-associated hypotension as an independent risk factor for two-year mortality in hemodialysis patients. Kidney Int. 2004;66:1212–1220. doi: 10.1111/j.1523-1755.2004.00812.x. [DOI] [PubMed] [Google Scholar]
- 41.Agarwal R. Blood pressure components and the risk for end-stage renal disease and death in chronic kidney disease. Clin J Am Soc Nephrol. 2009;4:830–837. doi: 10.2215/CJN.06201208. [DOI] [PMC free article] [PubMed] [Google Scholar]
- 42.Kovesdy CP, Trivedi BK, Kalantar-Zadeh K, Anderson JE. Association of low blood pressure with increased mortality in patients with moderate to severe chronic kidney disease. Nephrol Dial Transplant. 2006;21:1257–1262. doi: 10.1093/ndt/gfk057. [DOI] [PubMed] [Google Scholar]
- 43.Kalantar-Zadeh K, Kopple JD, Block G, Humphreys MH. A malnutrition-inflammation score is correlated with morbidity and mortality in maintenance hemodialysis patients. Am J Kidney Dis. 2001;38:1251–1263. doi: 10.1053/ajkd.2001.29222. [DOI] [PubMed] [Google Scholar]
- 44.Martinez-Vea A, Bardaj A, Gutierrez C, Garca C, Peralta C, Marcas L, Oliver JA. Exercise blood pressure, cardiac structure, and diastolic function in young normotensive patients with polycystic kidney disease: a prehypertensive state. Am J Kidney Dis. 2004;44:216–223. doi: 10.1053/j.ajkd.2004.04.026. [DOI] [PubMed] [Google Scholar]


