

Abstract
Epithelial cancer cells are likely to undergo epithelial mesenchymal transition (EMT) prior to entering the peripheral circulation. By undergoing EMT, circulating tumor cells (CTCs) lose epithelial markers and may escape detection by conventional methods. Therefore, we conducted a pilot study to investigate mRNA transcripts of EMT-inducing transcription factors (TFs) in tumor cells from the peripheral blood (PB) of primary breast cancer (PBC) patients.
Peripheral blood mononuclear cells were isolated from 52 stages I–III PBC patients and 30 healthy donors (HD) and sequentially depleted of EpCAM+ cells and CD45+ leukocytes, henceforth referred to as CD45−. The expression levels of EMT-inducing TFs (TWIST1, SNAIL1, SLUG, ZEB1, and FOXC2) in the CD45− cells were determined using qRT-PCR. The highest level of expression by the CD45− cell fraction of HD was used as “cut off” to determine if samples from PBC patients overexpressed any EMT-inducing TFs. In total, 15.4% of PBC patients overexpressed at least one of the EMT-inducing TF transcripts. Overexpression of any EMT-inducing TF transcripts was more likely to be detected in PBC patients who received neoadjuvant therapies (NAT) than patients who received no NAT (P = 0.003). Concurrently, CTCs were detected in 7 out of 38 (18.4%) patients by CellSearch® and 15 out of 42 (35.7%) patients by AdnaTest™. There was no association between the presence of CTCs measured by CellSearch® or AdnaTest™.
In summary, our results demonstrate that CTCs with EMT phenotype may occur in the peripheral circulation of PBC patients and NAT is unable to eliminate CTCs undergoing EMT.
Keywords: circulating tumor cells, epithelial-mesenchymal transition, primary breast cancer, neoadjuvant therapy
INTRODUCTION
Recent studies have demonstrated that circulating tumor cells (CTCs) in the peripheral blood (PB) is an independent prognostic factor for progression-free survival (PFS) and overall survival (OS) in patients with metastatic breast1, colon2, or prostate3 cancers. Commercially-available CTCs detection kits, including the FDA-cleared CellSearch® system (Veridex LLC, Warren, NJ) and the RT-PCR-based AdnaTest Breast Cancer Select/Detect kit or AdnaTest™ (AdnaGen AG, Langenhagen, Germany), exploit the expression of epithelial cell adhesion molecule (EpCAM), aka epithelial surface antigen/CD326, and epithelial cytokeratins (CK) to detect CTCs 1, 4–6. In addition to EpCAM, AdnaTest™ recognizes a CTC as expressing MUC1 and/or HER2.
A common cause of death for patients diagnosed with epithelial tumors, including breast tumors, is the development of distant metastatic disease, which is difficult to predict and diagnose in the early stages. In order to metastasize to distant organs, epithelial tumor cells must detach from the primary tumor, traverse the peripheral circulation, extravasate into the parenchyma, and establish a new tumor 7. A number of studies have shown that carcinoma cells often activate a transdifferentiation program, termed epithelial-mesenchymal transition (EMT), to acquire the traits needed to execute the multiple steps of metastasis 8. Through the EMT process, epithelial cells lose cell-cell contacts and cell polarity, downregulate epithelial-associated genes, acquire mesenchymal gene expression, and undergo major changes in their cytoskeleton. This cellular process culminates in a mesenchymal appearance and increased motility and invasiveness 8
Cancer cells can be induced to undergo EMT by several signaling pathways, most notably those involving the cooperation between TGF-β 1 signaling and oncogenic Ras or other receptor tyrosine kinases, as well as Wnt, Notch, and the signaling activated by Hedgehog 9. In addition, certain transcription factors (TF), including TWIST1, SNAIL1, SLUG, ZEB1, and FOXC2 can induce EMT in mammary epithelial cells and/or breast cancer cells 10. Moreover, blocking the expression of Twist in the highly metastatic 4T1 murine mammary cell line reduced both metastatic burden and the number of CTCs in mice bearing xenograft mammary tumors 11 thus linking EMT, metastasis, and the presence of CTCs. These findings suggest that the expression of epithelial-cell surface markers, such as EpCAM, may not be optimal for detecting a heterogeneous population of CTCs including those with a mesenchymal phenotype. Currently, a CTC detection kit is available to detect CTCs expressing EMT-associated genes by semi-quantitative RT-PCR (AdnaTest EMT-1/Stem Cell Select/Detect kit or AdnaTest-EMT™). However, this kit includes an initial step to enrich EpCAM expressing cells 12.
We recently found that induction of EMT in immortalized human mammary epithelial cells (HMECs) results in de novo expression of stem cell markers and acquisition of functional stem cell properties, including mammosphere forming potential. These findings illustrated a link between the EMT process and tumor-initiating cells (TICs) 13 and suggest that EMT contributes to the heterogeneity of tumor-initiating potential observed amongst breast tumor cells. Due to the aggressive nature of TICs, these findings support the need to detect tumor cells with mesenchymal features in breast cancer patients.
EMT plays a pivotal role during breast cancer progression 14 and results in the loss of epithelial markers and current CTCs detection kits may not detect CTCs with EMT features. Thus, we determined the feasibility of detecting CTCs based on the mRNA expression of EMT-inducing TF in peripheral blood (PB) of primary breast cancer (PBC) patients and to correlate these findings with clinical parameters as well as the presence of CTCs determined by EpCAM-based CTCs detection methods.
PATIENTS AND METHODS
This is a translational study (Protocol 04-0657; Chair: A. Lucci) approved by the Institutional Review Board (IRB) of the University of Texas MD Anderson Cancer Center (MDACC) and conducted between November 2008 to May 2009. The study included 52 patients with stage I–III primary breast cancer who were undergoing definitive surgery. We assessed the presence of CTCs measured by the CellSearch® system and the AdnaTest Breast Cancer Select/Detect test (AdnaTest™) at the time of surgery. Each patient was given a complete diagnostic evaluation to exclude the presence of distant metastasis. Healthy donors (HD) were age-matched women without breast cancer who were recruited and consented according to the IRB-approved protocol. All samples were processed as described in Fig 1.
Figure 1. Flow chart of processing samples from breast cancer patients.
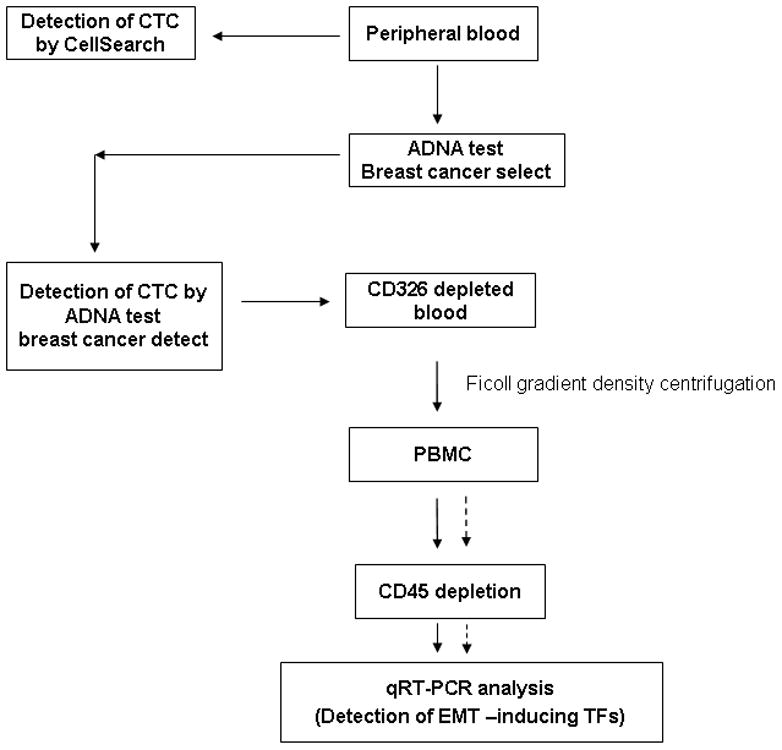
CD326+ cells were depleted using AdnaTest Breast Cancer Select, from the peripheral blood prior to isolation of peripheral blood mononuclear cell (PBMC) fraction. Subsequently, CD45+ leukocytes were depleted from the PBMC prior to detection of EMT-inducing TF genes by quantitative RT-PCR. Concurrently, CTCs were detected by CellSearch® and by AdnaTest™.
Detection of CTCs in peripheral blood using the CellSearch® system
The CellSearch® system (Veridex LLC) was used to detect CTCs in 7.5 mL of PB, as previously described 4. Briefly, peripheral blood samples from BC patients were subjected to enrichment of EpCAM+ cells with anti-EpCAM coated ferrous particles. CTCs were defined as nucleated cells lacking surface expression of the leukocyte antigen CD45 but expressing cytoplasmic cytokeratin (CK)-8, -18, or -19 1. Samples were considered to be positive if they had ≥ 1 CTC per 7.5 mL PB.
Detection of CTC using AdnaTest Breast Cancer Select and AdnaTest Breast Cancer Detect kits (AdnaTest™)
Five mL of PB were collected in AdnaCollect™ tubes (AdnaGen AG), transported to the laboratory on ice and processed within 4 hours of collection according to the manufacturer’s instructions. Briefly, samples were enriched for epithelial cells with anti-EpCAM coated magnetic beads (AdnaTest Breast Cancer Select kit). Thereafter, mRNA was isolated from EpCAM-enriched cells and followed by reverse transcription to cDNA and polymerase chain reaction (PCR) to detect expression of tumor associated antigens (EpCAM, MUC1, HER-2) and the housekeeping gene, β-actin (AdnaTest Breast Cancer Detect kit). Samples were considered positive if the PCR product expressed transcripts of at least one of the tumor associated genes.
Depletion of CD45+ leukocytes prior to detection of EMT-inducing Transcription Factor (TF) genes by a quantitative RT-PCR assay
The AdnaTest Breast Cancer Select kit was used to deplete the peripheral blood of EpCAM+ cells. Next, the EpCAM-depleted peripheral blood was subjected to a ficoll-hypaque density gradient to isolate peripheral blood mononuclear cells (PBMCs). The PBMCs were collected, washed twice with sterile phosphate buffered saline (PBS) and adjusted to a concentration of 107 PBMCs per mL and incubated with 40 μL of magnetic beads coated with anti-CD45 antibody (Miltenyi-Biotec, Auburn, CA) for 15 minutes on 4°C. Thereafter, the PBMCs were passed through a magnet-filled column on an AutoMACSPro Cell Separator (Miltenyi-Biotec) using the negative selection protocol (DEPLETE protocol) to enrich for CD45-depleted CTCs. The CD45-depleted (CD45−) sample was recycled through the magnet-filled column to deplete the sample of any residual CD45+ cells using the MACS DEPLETES protocol. Using this approach, a median percentage of 97.4% CD45+ cells (range 90.1% to 99.8%) were depleted.
RNA extraction and cDNA synthesis
CD45-depleted cells were mixed with TRIzol LS Reagent (Invitrogen Corporation, Carlsbad, CA) and stored at −80°C until it was necessary to extract RNA according to manufacturer’s instructions. The isolated RNA was treated by DNAse (Ambion Inc, Austin, TX) to minimize contamination by genomic DNA and stored at −80°C. All RNA preparation and handling steps took place in a laminar flow hood, under RNase free conditions. RNA concentration was determined by absorbance readings at 260 nm. RNA extracted from HMEC transduced with TWIST1 (HMEC-TWIST1) 13 and SUM149 cells 8 were used as positive controls. Reverse transcription of RNA was carried out with the cDNA archive kit (Applied Biosystems Inc., Foster City, CA).
Identification of gene transcripts in CD45− enriched subsets
Synthesized cDNA was subjected to quantitative Real-Time polymerase chain reaction (qRT-PCR) to detect EMT-inducing TF gene transcripts (TWIST, SNAIL1, SLUG, ZEB1 and FOXC2) and EpCAM. In brief, 2.5 μL of cDNA were placed in 25 μL of reaction volume containing 12.5 μL of TaqMan Universal PCR Master Mix, No AmpErase UNG, 8.75 μL water and 1.25 μL of primers. The Taqman assays, TWIST1: Hs00361186_m1, SNAIL1: Hs00195591_m1, SLUG: Hs00161904_m1, ZEB1: Hs01566408_m1, FOXC2: Hs00270951_s1 and EpCAM: Hs00158980_m1, were purchased from ABI. Amplicons spanned intron-exon boundaries with the exception of FOXC2 because it is a single exon.
Amplification was performed using an ABI Fast 7500 Real-Time PCR system (ABI) using the cycling program: 95°C for 10 min; 40 cycles of 95°C for 15s, 60°C for 60s. All samples were analyzed in triplicate. Calibrator samples were run with every plate to ensure consistency of the PCR. DNA contamination was assessed by performing PCR on the non-reverse transcribed portion of each sample. All samples demonstrated sufficient elimination of genomic DNA. For all fluorescence-based RT-PCR, fluorescence was detected between 0–40 cycles for the control and marker genes in single-plex reactions, which allow for the deduction of the cycles at threshold (CT) value for each product. Expression of the genes of interest was calibrated against expression of the housekeeping gene, GAPDH. Target cDNA was quantified using the delta-CT method with the formula: ½ ^Ct (target-GAPDH).
Detection of CTC in Normal PB spiked with HMEC-TWIST1 cells
The immortalized HMECs were transduced with TWIST1 as previously described 13. Four 7.5 mL samples of healthy donor PB were collected. Two of the PB samples were spiked with either 200 HMEC-Control or 200 HMEC-TWIST1 and analyzed by CellSearch® to determine its ability to detect the spiked epithelial cells. Each of the remaining two 7.5 mL PB samples was spiked with HMEC-TWIST1 cells and analyzed by AdnaTest™ to determine its ability to detect the spiked cells. Thereafter, the four PB samples containing the spiked epithelial cells were sequentially depleted of EpCAM+/CD326+ epithelial cells and CD45+ leukocytes before being assessed for the presence of TWIST1 gene transcripts by RT-PCR (Fig 2).
Figure 2. Spiking experiment with Human Mammary Epithelial Cells.
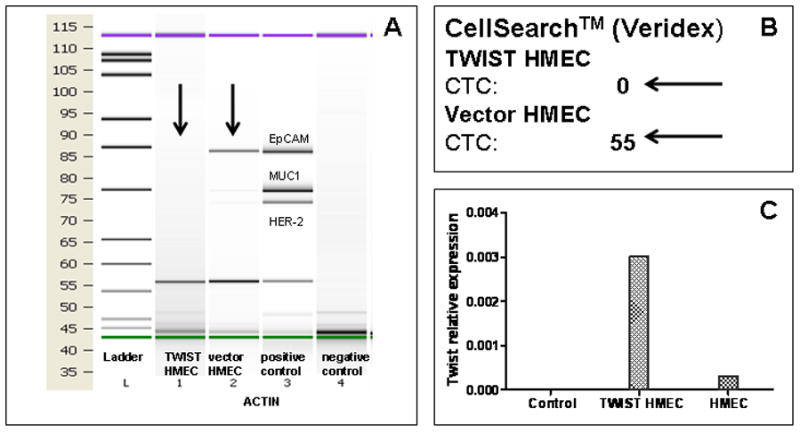
Two hundred TWIST1-expressing or control vector expressing human mammary epithelial cells were spiked into 7.5 mL of peripheral blood of a healthy donor. The samples were then processed using three different methods: A) AdnaTest Select/Detect (AdnaTest™) kit; B) CellSearch®; C) TWIST1 expression by cells sequentially depleted of CD326 and CD45 by qRT-PCR. While HMEC-TWIST1 cells were not detected by CellSearch® and AdnaTest™, the control counterparts with epithelial phenotype were detected. However, HMEC-TWIST1 cells were detected by TWIST1 expression in the CD326- and the CD45-depleted fraction of peripheral blood mononuclear cells.
The SUM149 cell line was developed from pleural effusions of a patient with inflammatory breast cancer 8. SUM149 cells display a partial EMT phenotype as evidenced by relatively high expression of fibronectin, N-cadherin, and vimentin along with expression of EpCAM 15. SUM149 cells were suspended in F-12 Hams medium (Gibco™, Invitrogen, Carlsbad, CA) supplemented with 5% fetal bovine serum (Tissue Culture Biologicals, Seal Beach, CA), 5 μg/mL of insulin, and 1 μg/mL hydrocortisone and cultured in a humidified incubator at 37°C with 5% CO2. As with the HMEC-Control and HMEC-TWIST1 cells, 200 SUM149 cells were spiked into 7.5 mL of PB sample of a HD and analyzed with AdnaTest™ and CellSearch® assays to detect the spiked cells. Additionally, the SUM149-spiked PB sample was sequentially depleted of EpCAM/CD326+ epithelial cells and CD45+ leukocytes before being assessed for TWIST1 gene transcripts by RT-PCR (Fig 3).
Figure 3. Spiking experiment with SUM149 cells.
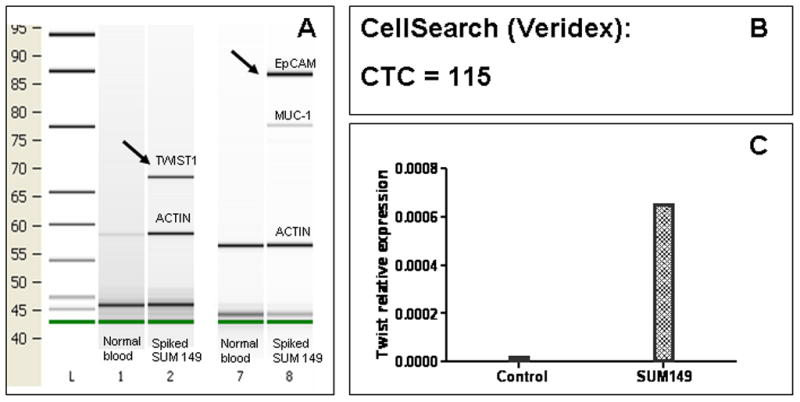
Two hundred SUM149 cells were spiked into 7.5 mL of peripheral blood of a healthy donor. The samples were then processed by three different methods: A) AdnaTest-EMT and AdnaTest Breast Select/Detect; B) CellSearch®; C) Relative TWIST1 expression by qRT-PCR of CD326- and CD45-depleted cells. SUM149 cells were detected by all methods suggesting that TWIST expression may not be associated with complete disappearance of EpCAM in all cells.
Statistical considerations
Patient characteristics were summarized using the median (range) for continuous variables and frequency (percentage) for categorical variables. Fisher’s Exact test was used to assess the association between overexpression of EMT-inducing TF transcripts and other patient characteristics. A p-value of < 0.05 was deemed to detect statistically significant differences between samples. All statistical analyses were conducted using SAS 9.1 (SAS Institute Inc., Cary, NC).
RESULTS
Expression of EMT-inducing TF gene transcripts TWIST1, SNAIL1, SLUG, ZEB1, and FOXC2 in CD45-depleted PBMC from healthy donors
In order to analyze for overexpression of EMT-inducing TF transcripts in CD45-depleted PBMC from patients, we first established the range of expression of these genes in healthy donors (HD). Utilizing TaqMan-based qRT-PCR, we were unable to detect SLUG transcripts in any of the 30 CD45-depleted PBMC fractions from HD. Conversely, TWIST1, SNAIL1, ZEB1 and FOXC2 gene transcripts were detected in 23.3%, 86.7%, 93.3% and 93.3% of HD samples, respectively. The levels of TWIST1, SNAIL1, ZEB1, and FOXC2 transcripts in the HD samples were calculated relative to that of the house keeping gene GAPDH. The highest expression levels of the EMT-inducing TF gene transcripts relative to that of GAPDH were 2.0 × 10⁻⁴, 1 × 10⁻², 2.2 × 10⁻² and 2.1 × 10⁻² for TWIST1, SNAIL1, ZEB1 and FOXC2, respectively. These values were used as “cut off” to determine if breast cancer patients have overexpression of EMT-inducing TF gene transcripts in the PBMC samples depleted of both EpCAM/CD326+ epithelial cells and CD45+ leukocytes.
Relative quantification of TWIST1, SNAIL1, SLUG, ZEB1 and FOXC2 gene transcripts in CD45-depleted PBMC of breast cancer patients depleted of epithelial cells and leukocytes
The study population consisted of 52 PBC patients with median age of 54 years old, range from 34 to 72 years. There were 42 (80.8%) patients with estrogen receptor positive (ER+) and/or progesterone receptor positive (PR+) tumors, 6 (11.2%) with HER-2/neu amplified, and 7 (13.5%) triple receptor negative (TN) tumors (Table 1). Twenty-three (44.2%) patients had positive lymph nodes and 14 (26.9%) patients received neoadjuvant therapy (NAT), including 5 patients who achieved pathological complete responses (pCR). Patients treated with NAT were more likely to have lymph node metastasis than non-NAT patients (100% vs. 23.7%; P < 0.001), while the differences in stage of disease (stage ≥ T2: 78.6% vs. 44.7%; P = 0.06), grade of disease (grade ≥ 3: 35,7% vs.24.3%; P = 0.49), and tumor type (infiltrative ductal carcinoma: 78.6% vs. 78.9%; P = 0.99) were not statistically significant between NAT and non-NAT patients.
Table 1.
Patient characteristics (N = 52)
| Variable | N | % |
|---|---|---|
| Tumor stage | ||
| T1 | 24 | 46.2 |
| T2 | 21 | 40.4 |
| T3 | 6 | 11.5 |
| T4 | 1 | 1.9 |
|
| ||
| Lymph Node status | ||
| N0 | 29 | 55.8 |
| ≥ N1 | 23 | 45.2 |
|
| ||
| Histology | ||
| Infiltrative ductal carcinoma | 41 | 78.8 |
| Infiltrative lobular carcinoma | 6 | 11.5 |
| Other | 5 | 9.6 |
|
| ||
| ER/PR status | ||
| Positive for either | 42 | 80.8 |
| Negative for both | 10 | 19.2 |
|
| ||
| HER2/Neu status | ||
| Amplified | 6 | 11.5 |
| Normal | 46 | 88.5 |
|
| ||
| High grade | 14 | 27.5 |
|
| ||
| Triple receptor negative | 7 | 13.5 |
|
| ||
| Neoadjuvant therapy | 14 | 26.9 |
| Pathological complete response | 5 | 35.7 |
|
| ||
| CTC ≥ 1 by CellSearch® (Total) | 7 (38) | 18.4 |
| CTC+ by AdnaTest™ (Total) | 15 (42) | 35.7 |
Among the 52 PBC patient samples analyzed, the expression of EMT-inducing TF transcripts were detected as follows: 30 (57.7%) TWIST1, 47 (90.4%) SNAIL1, 6 (11.5%) SLUG, and 52 (100%) ZEB1. TWIST1 transcript was more commonly expressed in patients than in healthy donors (57.7% vs. 23.3%; p = 0.003). The FOXC2 transcript was detected in all of the 31 patient samples tested for the presence of this transcription factor.
To determine overexpression of the EMT-inducing TF gene transcripts in PBC patients, we compared the expression levels in patient samples with those of healthy donors. Relative to the highest levels of SNAIL and ZEB1 transcripts detected in healthy donor samples, none of the patient samples overexpressed these gene transcripts. Among the patient samples, TWIST1, SLUG, and FOXC2 transcripts were overexpressed in 1 of 52 (1.9%), 6 of 52 (11.5%), and 1 of 31 (3.2%) samples, respectively. Overexpression of at least one of the EMT-inducing TF gene transcripts was detected in 8 (15.4%) of the 52 patients. There was no overlap between overexpression of EMT-inducing TF gene transcripts in patient samples.
Overexpression of EMT-inducing TF gene transcripts in relation to clinicopathological parameters
Overexpression of TWIST1, SNAIL1, SLUG, ZEB1 and FOXC2 gene transcripts in relation to various clinicopathological characteristics is shown in Table 2. There was no association between overexpression of these EMT-inducing TF transcripts and tumor size, ER/PR status, HER2/neu amplification, or TN tumors. Patients who received NAT were more likely to have an overexpression of EMT-inducing TF gene transcripts in their PBMC fractions depleted of both epithelial cells and leukocytes compared to those of patients who did not receive NAT (42.9% vs. 5.3%; P = 0.003). Of the 14 patients who received NAT, 5 achieved a pathological complete response (pCR). Whereas only 1 of 5 (20%) patients with pCR had overexpression of EMT-inducing TF gene transcripts, 5 of 9 patients (55%) without pCR had overexpression of EMT-inducing TF gene transcripts (P = 0.30). Patients treated with NAT are significantly more likely to have lymph node metastasis (100% vs. 23.7%; P < 0.001), while the differences in stage (stage ≥ T2: 78.6% vs. 44.7%; P = 0.06), grade (grade ≥ 3: 35.7% vs. 24.3%; P = 0.49), and tumor type (infiltrative ductal carcinoma: 78.6% vs. 78.9%; P = 0.99) was not statistically significant.
Table 2.
Association between clinicopathological characteristics and EMT overexpression
| EMT-inducing Transcription Factor Genes | |||||
|---|---|---|---|---|---|
| Normal expression | Over-expression | p-value | |||
| Variable | N | % | N | % | |
| Lymph Node status | |||||
| N0 | 26 | 92.9 | 2 | 7.1 | 0.12 |
| ≥ N1 | 17 | 73.9 | 6 | 26.1 | |
|
| |||||
| Tumor stage | |||||
| T1 | 18 | 85.7 | 3 | 14.3 | 1.00 |
| ≥T2 | 25 | 83.3 | 5 | 16.7 | |
|
| |||||
| Histology | |||||
| Infiltrative ductal carcinoma | 35 | 85.4 | 6 | 14.6 | 0.37 |
| Infiltrative lobular carcinoma | 4 | 66.7 | 2 | 33.3 | |
| Other | 5 | 100 | 0 | 0 | |
|
| |||||
| ER/PR status | |||||
| Positive for either | 34 | 81 | 8 | 19 | 0.33 |
| Negative for both | 10 | 100 | 0 | 0 | |
|
| |||||
| HER2/Neu status | |||||
| Amplified | 6 | 100 | 0 | 0 | 0.57 |
| Normal | 37 | 82.2 | 8 | 17.8 | |
|
| |||||
| High grade | 13 | 92.9 | 1 | 7.1 | 0.42 |
| Low/intermediate grade | 30 | 81.1 | 7 | 18.9 | |
|
| |||||
| Triple-receptor negative | 7 | 100 | 0 | 0 | 0.58 |
| Other | 37 | 82.2 | 8 | 17.8 | |
|
| |||||
| Neoadjuvant therapy | 8 | 57.1 | 6 | 42.9 | 0.003 |
| No therapy | 36 | 94.7 | 2 | 5.3 | |
|
| |||||
| Pathologic complete response (pCR) | 4 | 80.0 | 1 | 20 | 0.30 |
| Other than pCR | 4 | 44.4 | 5 | 55.6 | |
|
| |||||
| AdnaTest™/CellSearch® | |||||
| CTC negative for both | 24 | 92.3 | 2 | 7.7 | 0.21 |
| CTC positive for either | 15 | 75.0 | 5 | 25.0 | |
Overexpression of EMT-inducing TF gene transcripts relative to CTCs measured by CellSearch® and AdnaTest™
CTC enumeration by CellSearch® was available for 38 of the 52 patients. Seven of the 38 (18.4%) patients had a detectable CTC count by CellSearch® (range: 1–17 per 7.5 mL of PB) (Table 1). Of the 42 patients who were tested for CTCs by the RT-PCR based AdnaTest™, at least one of the tumor-associated gene transcripts was detected in 15 (35.7%) patients. We found that 20 of the patient samples were positive for CTCs by either the CellSearch® or AdnaTest™ assays or both. Patients positive for CTCs, by either CellSearch® or AdnaTest™, had a higher tendency to overexpress EMT-inducing TF gene transcripts compared to patients with a negative CTCs test (25.0% versus 7.7%) (Table 2). However, there was no association between the over-expression of any EMT-inducing TF gene transcripts and the presence of CTCs detected by either CellSearch® (P = 0.30) or AdnaTest™ (P = 0.23) (Table 3).
Table 3.
There is no association between the over-expression of any EMT-inducing TF gene and the positivity of CTCs
| EMT-inducing TF genes | |||||
|---|---|---|---|---|---|
| Variable | Normal expression | Over-expression | P-value | ||
| N | % | N | % | ||
| CTC AdnaTest Select/Detect™ | |||||
| negative | 24 | 88.9 | 3 | 11.1 | 0.23 |
| positive | 11 | 73.3 | 4 | 26.6 | |
|
| |||||
| CTC CellSearch® | |||||
| negative | 27 | 87.1 | 4 | 12.9% | 0.30 |
| positive | 5 | 71.4 | 2 | 28.6 | |
Detection of spiked cells with EMT phenotype in healthy donor peripheral blood
To test if cells that had undergone EMT can be detected by EpCAM-based detection methods, we first utilized HMECs that ectopically expressed TWIST1 (HMEC-TWIST1) and the respective control vector infected HMECs (HMEC-Control). A previous study showed that HMEC-TWIST1 cells exhibited an EMT phenotype as evidenced by spindle-shaped morphology, inability to form epithelial-like colonies in monolayer culture, the complete loss of E-cadherin protien, and de novo expression of N-cadherin, vimentin and fibronectin 10. These traits suggest that HMEC-TWIST1 cells had fully acquired a mesenchymal phenotype or, in other words, had undergone a “complete EMT”. To test whether the commercially-available CTC detection assays could detect HMECs that had undergone EMT, we analyzed healthy donor PB samples that were spiked with either HMEC-TWIST1 or HMEC-Control cells using both CellSearch® and AdnaTest™ kits. Whereas the CellSearch® and AdnaTest™ kits were able to detect the HMEC-Control cells, the mesenchymal-like HMEC-TWIST cells were not detected by either CellSearch® or the AdnaTest™ (Fig 2A and 2B). On the other hand, healthy donor PB samples that were spiked with SUM149 cells with a partial EMT phenotype were detected by the PCR-based AdnaTest™ and the AdnaTest-EMT™ kits (Fig 3A) as well as the CellSearch® system (Fig 3B). These results suggest that CellSearch®, AdnaTest™ and AdnaTest-EMT™ kits can detect cancer cells that have undergone a partial EMT.
Since the CellSearch® and AdnaTest™ kits were unable to detect CTCs with a complete mesenchymal phenotype, we next spiked HMEC-TWIST1 and SUM149 cells into healthy donor PB samples and then depleted the samples of CD45+ leukocytes before determining the expression of EMT-inducing TF gene transcripts using qRT-PCR. Indeed, we were able to detect TWIST1 gene transcripts in the CD45− fraction of HMEC-TWIST1 (Fig 2C) and SUM149 cells (Fig 3C) spiked blood samples of healthy donors. In addition, we detected SNAIL1 and SLUG gene transcripts in CD45-depleted PBMC isolated from healthy donor blood samples spiked with SUM149 (data not shown).
DISCUSSION
EMT is believed to play an important role in intravasation and the release of CTCs, and the expression of EMT-inducing TF gene transcripts in breast cancer has been associated with poor prognosis 16. In this study, 8 of the 52 (15.4%) PBC patients had overexpression of at least one EMT-inducing TF gene in the PBMC fractions depleted of both epithelial cells and leukocytes. We observed that SLUG gene transcript was the most commonly overexpressed EMT-inducing TF gene transcript (6 out of the 8 cases), while SNAIL1 and ZEB1 gene transcripts were not overexpressed in any of the samples. SLUG is believed to be required for the invasion and bone marrow homing of cancer cells of a different origin 17. Hence, the long term follow up of patients is needed to determine if overexpression of SLUG is a significant prognostic factor for metastasis. Moreover, TWIST1 gene expression was more often detected in patients than in healthy donors (57.7% vs. 23.3%; P = 0.003); however, only one patient overexpressed the TWIST1 gene transcript.
EMT has been previously linked with cancer stem cell properties 13, which have been associated with increased therapeutic resistance 18–20. We report that patients who received NAT were more likely to exhibit overexpression of EMT-inducing TF gene transcripts in their PBMC fractions depleted of both epithelial cells and leukocytes in comparison to identical cell fractions of patients who had not received NAT. This finding suggests either the intrinsic nature of CTCs undergoing EMT to resist NAT or an association between therapeutic stress and the surviving CTCs undergoing EMT. Furthermore, our data are consistent with another study that reported chemotherapy and hormonal treatment induced not only apoptosis, but also EMT in an experimental model 21. Consistent with these findings, we also observed an increase in disseminated tumor cells with ALDH activity (Aldeflour+/CD45−/CD326+) in bone marrow of PBC patients who had received NAT 22. Unfortunately, the current study cannot definitely exclude the expression of EMT-inducing TF gene transcripts by other cells such as hematopoietic progenitor cells mobilized from the bone marrow or other EpCAM−/CD45− cells such as endothelial cells.
Paradoxically, we observed that some poor prognostic subgroups like patients with HER2 amplified, ER and PR negative, and/or triple-receptor negative tumors did not overexpress EMT-inducing TF gene transcripts. Alternatively, our observations could be a consequence of the small sample size and under representation of these patient subgroups in our study. Nevetheless, other mechanism beyond EMT could also be responsible for the outcome of these patients.
A recent study reported that there was a substantial variation in the detection rates of CTCs from breast cancer patients, 36% of patients with MBC were positive by CellSearch® and 22% by the AdnaTest™ 23. Consistent with these findings, we found no association between the presence of CTCs measured by CellSearch® or AdnaTest™ and the overexpression of EMT-inducing TF gene transcripts. Alternatively, the discordance between CTC and EMT-inducing TF gene transcripts in some patients suggests that the conventional CTC detection assays are incapable of detecting both epithelial and mesenchymal phenotypes. We found that HMEC-TWIST1 cells with complete EMT phenotype cannot be detected using conventional EpCAM based CTCs detection methods such as CellSearch® or AdnaTest™ Breast Cancer Select/Detect. However, HMEC-TWIST1 cells can be detected using a qRT-PCR based method in blood samples depleted of CD45+ leukocytes. Furthermore, Aktas et al showed that more than 60% of CTCs detected by the AdnaTest-EMT™ kit expressed genes associated with EMT and stem cell phenotype (TWIST1, PI3K, Akt, ALDH) 12. Taken together, these data suggest that there is a continuum of development of CTCs from one end of the spectrum (epithelial phenotype) to the other end of the spectrum (mesenchymal phenotype), and some CTCs with a partial EMT phenotype may co-express both epithelial and mesenchymal related genes (Fig 3). Since CTCs with the EMT phenotype play a significant role in the progression of epithelial cancers, we suggest that the detection of CTCs undergoing EMT could have prognostic value in a broad range of epithelial tumors.
Despite the small sample size, this is a first study aimed to detect CTCs based on the overexpression of EMT-inducing TF gene transcripts in peripheral blood of PBC patients. Nevertheless we are prepared to concede that our study has a few limitations starting with the recognition that the qRT-PCR does not allow visualization of CTCs and therefore the detection of CTCs with EMT phenotype by this method is, at best, an indirect assessment. Secondarily, the limited sample size is an under representation of high risk subgroups such as those with HER2 amplified or triple-receptor negative primary tumors. Finally, the lack of paired samples in the current study prohibits definitive conclusions regarding the effect of NAT. On the other hand, our data are consistent with an in vitro study and translational findings linking EMT induction and cancer stem cell characteristics with treatment resistance 21, 22.
In summary, CTC expressing EMT-inducing gene transcripts are likely to be enriched in PBC patients who have received neoadjuvant chemotherapy, while there were no differences in expression levels of EMT-inducing TF gene transcripts according tumor size, tumor grade or tumor type. The loss of epithelial antigen on CTCs as a result of EMT, likely triggered by high expression of EMT-inducing TFs, may be responsible for the underestimation of CTCs by conventional methods such as CellSearch® or AdnaTest™ that rely on the expression of EpCAM/CD326 by CTCs for optimal detection. A future prospective study is warranted to characterize CTCs in partial or complete EMT that could lead to identification of additional tumor markers that might serve as potential novel therapeutic targets. In addition, we believe our methodology is a reliable assay that detects CTCs undergoing EMT in peripheral blood and may facilitate the monitoring of therapeutic agents capable of targeting CTC in epithelial-mesenchymal transition.
Acknowledgments
We wish to thank the patients treated at the Nellie B. Connally Breast Center, the University of Texas MD Anderson Cancer Center for their willingness to participate in translational research studies.
Michal Mego was supported by a UICC American Cancer Society International Fellowship for Beginning Investigators, ACSBI Award ACS/08/006. Massimo Cristofanilli, James M. Reuben and Sendurai Mani are the recipients of a R01 grant from the National Cancer Institute to study human breast cancer stem cell surrogates (CA138239-02). Massimo Cristofanilli is also the recipient of a grant from the State of Texas Rare and Aggressive Breast Cancer Research Program. Anthony Lucci is the recipient of the Society of Surgical Oncology Clinical Investigator Award and a grant from the CDMRP Department of Defense (BC087443). Gabriel N. Hortobagyi is the principal investigator of a Breast Cancer SPORE (1 P50 CA116199) grant from the National Cancer Institute.
Footnotes
The methods described in this paper are representative of a patent application by Michal Mego, Sendurai Mani, Massimo Cristofanilli, and James M. Reuben.
References
- 1.Cristofanilli M, Budd GT, Ellis MJ, Stopeck A, Matera J, Miller MC, Reuben JM, Doyle GV, Allard WJ, Terstappen LW, Hayes DF. Circulating tumor cells, disease progression, and survival in metastatic breast cancer. N Engl J Med. 2004;351:781–91. doi: 10.1056/NEJMoa040766. [DOI] [PubMed] [Google Scholar]
- 2.Cohen SJ, Punt CJ, Iannotti N, Saidman BH, Sabbath KD, Gabrail NY, Picus J, Morse M, Mitchell E, Miller MC, Doyle GV, Tissing H, et al. Relationship of circulating tumor cells to tumor response, progression-free survival, and overall survival in patients with metastatic colorectal cancer. J Clin Oncol. 2008;26:3213–21. doi: 10.1200/JCO.2007.15.8923. [DOI] [PubMed] [Google Scholar]
- 3.de Bono JS, Attard G, Adjei A, Pollak MN, Fong PC, Haluska P, Roberts L, Melvin C, Repollet M, Chianese D, Connely M, Terstappen LW, et al. Potential applications for circulating tumor cells expressing the insulin-like growth factor-I receptor. Clin Cancer Res. 2007;13:3611–6. doi: 10.1158/1078-0432.CCR-07-0268. [DOI] [PubMed] [Google Scholar]
- 4.Allard WJ, Matera J, Miller MC, Repollet M, Connelly MC, Rao C, Tibbe AG, Uhr JW, Terstappen LW. Tumor cells circulate in the peripheral blood of all major carcinomas but not in healthy subjects or patients with nonmalignant diseases. Clin Cancer Res. 0004;10:6897–904. doi: 10.1158/1078-0432.CCR-04-0378. [DOI] [PubMed] [Google Scholar]
- 5.Ignatiadis M, Kallergi G, Ntoulia M, Perraki M, Apostolaki S, Kafousi M, Chlouverakis G, Stathopoulos E, Lianidou E, Georgoulias V, Mavroudis D. Prognostic value of the molecular detection of circulating tumor cells using a multimarker reverse transcription-PCR assay for cytokeratin 19, mammaglobin A, and HER2 in early breast cancer. Clin Cancer Res. 2008;14:2593–600. doi: 10.1158/1078-0432.CCR-07-4758. [DOI] [PubMed] [Google Scholar]
- 6.Pachmann K, Dengler R, Lobodasch K, Frohlich F, Kroll T, Rengsberger M, Schubert R, Pachmann U. An increase in cell number at completion of therapy may develop as an indicator of early relapse: quantification of circulating epithelial tumor cells (CETC) for monitoring of adjuvant therapy in breast cancer. Journal of cancer research and clinical oncology. 2008;134:59–65. doi: 10.1007/s00432-007-0248-3. [DOI] [PubMed] [Google Scholar]
- 7.Fidler IJ. The pathogenesis of cancer metastasis: the ‘seed and soil’ hypothesis revisited. Nature reviews. 2003;3:453–8. doi: 10.1038/nrc1098. [DOI] [PubMed] [Google Scholar]
- 8.Hay ED. An overview of epithelio-mesenchymal transformation. Acta Anat (Basel) 1995;154:8–20. doi: 10.1159/000147748. [DOI] [PubMed] [Google Scholar]
- 9.Moustakas A, Heldin CH. Signaling networks guiding epithelial-mesenchymal transitions during embryogenesis and cancer progression. Cancer Sci. 2007;98:1512–20. doi: 10.1111/j.1349-7006.2007.00550.x. [DOI] [PMC free article] [PubMed] [Google Scholar]
- 10.Yang J, Weinberg RA. Epithelial-mesenchymal transition: at the crossroads of development and tumor metastasis. Dev Cell. 2008;14:818–29. doi: 10.1016/j.devcel.2008.05.009. [DOI] [PubMed] [Google Scholar]
- 11.Yang J, Mani SA, Donaher JL, Ramaswamy S, Itzykson RA, Come C, Savagner P, Gitelman I, Richardson A, Weinberg RA. Twist, a master regulator of morphogenesis, plays an essential role in tumor metastasis. Cell. 2004;117:927–39. doi: 10.1016/j.cell.2004.06.006. [DOI] [PubMed] [Google Scholar]
- 12.Aktas B, Tewes M, Fehm T, Hauch S, Kimmig R, Kasimir-Bauer S. Stem cell and epithelial-mesenchymal transition markers are frequently overexpressed in circulating tumor cells of metastatic breast cancer patients. Breast Cancer Res. 2009;11:R46. doi: 10.1186/bcr2333. [DOI] [PMC free article] [PubMed] [Google Scholar]
- 13.Mani SA, Guo W, Liao MJ, Eaton EN, Ayyanan A, Zhou AY, Brooks M, Reinhard F, Zhang CC, Shipitsin M, Campbell LL, Polyak K, et al. The epithelial-mesenchymal transition generates cells with properties of stem cells. Cell. 2008;133:704–15. doi: 10.1016/j.cell.2008.03.027. [DOI] [PMC free article] [PubMed] [Google Scholar]
- 14.Thiery JP. Epithelial-mesenchymal transitions in development and pathologies. Curr Opin Cell Biol. 2003;15:740–6. doi: 10.1016/j.ceb.2003.10.006. [DOI] [PubMed] [Google Scholar]
- 15.Blick T, Widodo E, Hugo H, Waltham M, Lenburg ME, Neve RM, Thompson EW. Epithelial mesenchymal transition traits in human breast cancer cell lines. Clin Exp Metastasis. 2008;5:629–42. doi: 10.1007/s10585-008-9170-6. [DOI] [PubMed] [Google Scholar]
- 16.Martin TA, Goyal A, Watkins G, Jiang WG. Expression of the transcription factors snail, slug, and twist and their clinical significance in human breast cancer. Ann Surg Oncol. 2005;12:488–96. doi: 10.1245/ASO.2005.04.010. [DOI] [PubMed] [Google Scholar]
- 17.Tanno B, Sesti F, Cesi V, Bossi G, Ferrari-Amorotti G, Bussolari R, Tirindelli D, Calabretta B, Raschella G. Expression of slug is regulated by C-MYB and is required for invasion and bone marrow homing of cancer cells of different origin. J Biol Chem. 2010 Jul 11; doi: 10.1074/jbc.M109.089045. [Epub ahead of print] [DOI] [PMC free article] [PubMed] [Google Scholar]
- 18.Hollier BG, Evans K, Mani SA. The epithelial-to-mesenchymal transition and cancer stem cells: a coalition against cancer therapies. J Mammary Gland Biol Neoplasia. 2009;14:29–43. doi: 10.1007/s10911-009-9110-3. [DOI] [PubMed] [Google Scholar]
- 19.Li X, Lewis MT, Huang J, Gutierrez C, Osborne CK, Wu MF, Hilsenbeck SG, Pavlick A, Zhang X, Chamness GC, Wong H, Rosen J, et al. Intrinsic resistance of tumorigenic breast cancer cells to chemotherapy. J Natl Cancer Inst. 2008;100:672–9. doi: 10.1093/jnci/djn123. [DOI] [PubMed] [Google Scholar]
- 20.Woodward WA, Chen MS, Behbod F, Alfaro MP, Buchholz TA, Rosen JM. WNT/beta-catenin mediates radiation resistance of mouse mammary progenitor cells. Proc Natl Acad Sci U S A. 2007;104:618–23. doi: 10.1073/pnas.0606599104. [DOI] [PMC free article] [PubMed] [Google Scholar]
- 21.Li QQ, Xu JD, Wang WJ, Cao XX, Chen Q, Tang F, Chen ZQ, Liu XP, Xu ZD. Twist1-mediated adriamycin-induced epithelial-mesenchymal transition relates to multidrug resistance and invasive potential in breast cancer cells. Clin Cancer Res. 2009;15:2657–65. doi: 10.1158/1078-0432.CCR-08-2372. [DOI] [PubMed] [Google Scholar]
- 22.Reuben JM, Lee B, Lucci A, Gao H, Cohen EN, Li C, Krishnamurthy S, Hortobagyi GN, Woodward WA, Cristofanilli M. Disseminated tumor cells in primary breast cancer: Evaluation of the percentage of breast cancer stem cells in bone marrow aspirates of patients receiving neoadjuvant chemotherapy. J Clin Oncol. 2009;27:15s. [Google Scholar]
- 23.Van der Auwera I, Peeters D, Benoy IH, Elst HJ, Van Laere SJ, Prove A, Maes H, Huget P, van Dam P, Vermeulen PB, Dirix LY. Circulating tumour cell detection: a direct comparison between the CellSearch System, the AdnaTest and CK-19/mammaglobin RT-PCR in patients with metastatic breast cancer. Br J Cancer. 2009;102:276–84. doi: 10.1038/sj.bjc.6605472. [DOI] [PMC free article] [PubMed] [Google Scholar]