

Abstract
Most gene promoters have multiple binding sequences for many transcription factors, but the contribution of each of these factors to chromatin remodeling is still unclear. Although we previously found a dynamic change in the arrangement of nucleosome arrays at the Il2 promoter during T cell activation, its timing preceded that of a decrease in nucleosome occupancy at the promoter. Here we show that the initial nucleosome rearrangement was temporally correlated with the binding of NFAT1 and AP-1 (Fos/Jun), while the second step occurred in parallel with the recruitment of other transcription factors and RNA polymerase II. Pharmacologic inhibitors for activation of NFAT1 or induction of Fos blocked the initial phase in the sequential changes. This step was not affected, however, by inhibition of c-Jun phosphorylation, which instead blocked the binding of the late transcription factors, the recruitment of CREB-binding protein (CBP) and the acetylation of histone H3 at lysine 27 (H3K27ac). Thus, the sequential recruitment of transcription factors appears to facilitate two separate steps in chromatin remodeling at the Il2 locus.
Introduction
The initiation of gene transcription requires the binding of transcription factors to promoters and/or enhancers in the target gene. These regulatory cis-elements are usually packaged into chromatin, which presents an obstacle to their accessibility for transcription factor binding. The open/close switch for access cannot be simple, because DNA strands are folded into chromatin at several levels (1, 2). This process has been studied using inducible transcription systems. For example, cultured cells carrying a high-copy number locus with a hormone responsive element revealed enlargement of stained foci cytologically, in parallel with binding of nuclear receptors following hormone exposure (3, 4). This chromatin decondensation appears to be at the level of the 30-nm fiber or higher order structures. In contrast, the binding of a complex including RelA to the promoter of the interferon-β gene caused repositioning of a nucleosome to expose the TATA box to TFII basal transcription factors following viral infection (5, 6). RAR/RXR nuclear receptors are also known to be capable of sliding nucleosomes along a DNA strand after binding their agonists. (7).
The Interleukin-2 gene (Il2) is induced in T cells activated through the T cell receptor (TCR) by antigen displayed on the surface of an antigen-presenting cell (APC). It functions as a differentiation and growth factor for the T cell itself as well as for other cells (8). T cell activation is known to trigger chromatin structural changes around the Il2 promoter region, such as alterations in nucleosome occupancy or an increase in accessibility to endonucleases (9-14). We recently described a new fractionation assay, based on the size of sheared, formaldehyde-crosslinked chromatin (designated the “SEVENS” assay), that can be used to examine chromatin structure at promoter regions (15). This technique revealed a dynamic change in chromatin configuration at the Il2 locus following anti-CD3 and anti-CD28 stimulation of previously activated CD4+ mouse T cells (15). The change occurred predominantly around the minimal promoter/enhancer region, located near the transcription start site, where many well-known transcription factors bind for Il2 induction (16). Although cooperative occupancy by these factors has been observed with in vivo footprinting (17, 18), the relationship between these chromatin structural changes and the binding of the transcription factors is still unclear.
Here, the kinetics of recruitment of NFAT1 and AP-1 is shown to correspond to the timing of the nucleosome rearrangement process seen in the SEVENS assay. After this initial step, occupancy of nucleosomes and linker histones was diminished at the Il2 promoter region. This second event was accompanied by the binding of other critical transcription factors and RNA polymerase II, as well as the binding of the histone acetyltransferase CBP. Thus, there appears to be a two step recruitment process in which “early-binding” and “late-binding” transcription factors are responsible for the sequential changes in chromatin structure observed around the Il2 promoter during T cell activation.
Materials and Methods
Mouse T cells and chemicals
All T cells were derived from B10.A, TCR-5C.C7 transgenic, Rag-2-deficient mice (female, 5-8 weeks old) (19). Naïve T cells were collected from lymph nodes. Preactivated resting T (PR-T) cells were prepared as described before (15). For (re)activation of these cells, culture dishes pre-coated with 10 μg/ml of anti-CD3ε Ab (clone 145-2C11, BD Biosciences) and a 1:2500 dilution of an ascites preparation of an anti-CD28 mAb (clone 37.51) were used (15). CHX, FK506, and SP600125 were used at 10 μg/ml, 10 nM, and 30 μM, respectively. CHX was added at time 0, while FK506 and SP600125 were added 30 min prior to activation. All of these chemicals were purchased from Sigma-Aldrich.
IL-2 secretion assay
An IL-2 secretion assay was performed using a Mouse IL-2 Secretion Assay Detection kit (Miltenyi Biotec). Naïve T cells and PR-T cells were also stained with anti-CD4 Ab (clone GK1.5, BD Biosciences) and 7-amino actinomycin D (7AAD) (BD Biosciences). After gating out dead cells stained by the 7AAD, IL-2- and CD4-expressing cells were detected using a FACSCalibur (BD Biosciences).
Western blotting
A cell lysate in SDS lysis buffer (SLB: 1% SDS, 50 mM Tris-HCl (pH 8.0), and 10 mM EDTA, Complete Protease Inhibitor Cocktail (#4693124, Roche)) was run on SDS-PAGE, and then blotted onto a nitrocellulose membrane. Following exposure to a primary Ab, a biotinylated secondary Ab (GE Healthcare), and a streptavidin-conjugated alkaline phosphatase (GE Healthcare), sequentially, the membrane was developed using Western Blue (Promega). The primary Abs used are shown in Supplementary Table S1.
RT-qPCR
Extraction of mRNA and preparation of cDNA were performed as described before (15). For quantitative PCR (qPCR), 25 pg (IL-2, β-actin, and18S rRNA) or 250 pg (CD3δ, BDNF, and Adad1) of cDNA was applied to one reaction using a QuantiFast SYBR Green PCR Kit (Qiagen) in a real time PCR machine ABI7900HT (Applied Biosystems). Because different primers have different PCR amplification efficiencies, we could not directly compare the values we measured by qPCR among different genes. Instead, we utilized mouse genomic DNA diluted serially (0.76-12500 ng) as a standard for comparison. In addition, we performed qPCR for three different regions of each mRNA using primers specific for three different exons. Therefore, all primers for PCR were designed to amplify a coding region within a single exon. The relative amount of cDNA of interest was estimated from its Ct value plotted on a standard curve acquired from the Ct values of a diluted series of genomic DNA. These quantified amounts were normalized to the amount of ribosomal 18S RNA. The primers used are shown in Supplementary Table S2.
Chromatin immunoprecipitation (ChIP) assay
For assays using anti-histone H3 Ab, PR-T cells were treated with 1% formaldehyde in PBS at room temperature for 10 min. In the other assays PR-T cells were crosslinked with N-hydroxysuccinimide-ester cocktail (2 mM each of disuccinimidyl glutarate, disuccinimidyl suberate, and ethylene glycol bis-succinimidylsuccinate (all from Pierce) in PBS) for 45 min at room temperature prior to incubation with 1% formaldehyde in PBS for 15 min at room temperature (20). After shearing to an average DNA size of about 300 bp, we applied the chromatin containing 5 μg of DNA (estimated using a PicoGreen Quantification Kit from Invitrogen), to a ChIP Assay Kit (Millipore). The precipitation percentage was calculated from Ct values (precipitated vs. input DNA) on qPCR. The primary Abs or PCR primers are shown in Supplementary Table S1 or S2, respectively.
The SEVENS assay
The details of the SEVENS assay are described in our previous report (15). Primers for the specific DNA sequences used in these assays are shown in Supplementary Table S2.
Statistical analysis
Statistical analysis was performed with Microsoft Excel. All data with error bars are presented as mean±SD for at least 3 independent experiments.
Results
Large induction of IL-2 mRNA from most pre-activated T cells stimulated with anti-CD3ε and anti-CD28
We utilized CD4+ cells isolated from TCR transgenic mice to study chromatin structural changes in inducible Il2 transcription. We activated the cells with plate-bound anti-CD3ε and anti-CD28 Abs, which only react with the T cells in the population and mimic stimulation through the TCR and the costimulatory receptor, CD28, respectively. To evaluate the homogeneity of activation of the T cell population for IL-2 production, we measured IL-2 secretion by flow cytometry using anti-IL-2 Ab. As shown in the upper right panel of Fig. 1A, only about 7% of naïve T cells made IL-2 following 4 hrs of activation. To circumvent this low response problem, we prepared a population of pre-activated resting T (PR-T) cells. When these cells were re-stimulated for 4 hrs, 84% of them secreted IL-2 (lower right in Fig. 1A). No secretion was observed prior to activation. Thus, PR-T cells appeared suitable for biochemical analysis of chromatin structural changes at the Il2 locus following synchronized T cell activation.
FIGURE 1.
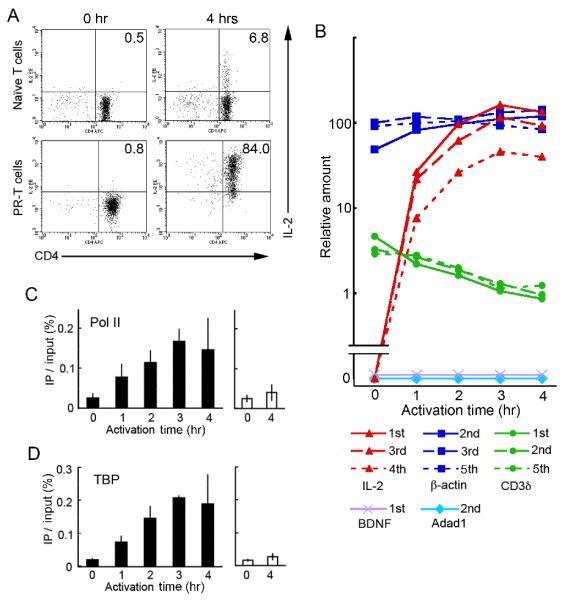
Expression profiles of IL-2 mRNA production and protein secretion compared to the recruitment kinetics of a Pol II complex to the Il2 promoter following T cell activation. A, IL-2-expressing cells were counted in a secretion capture assay. Naïve T cells or PR-T cells, which were unactivated or activated for 4 hrs, were stained with anti-IL-2 and anti-CD4 Abs. The percentages of IL-2-expressing CD4+ T cells are indicated in the upper right quadrants. B, The relative values of mRNA for Il2 and 4 control genes were calculated by qRT-PCR compared to a standard curve obtained using genomic DNA (see Materials and Methods). The PCR reactions were performed using primer sets annealing to a region within a single exon, which is shown as an ordinal number (1st to 5th) in the key. The results are shown as relative values compared to the signal for β-actin mRNA encoded by the 3rd exon in resting PR-T cells, which is designated as 100%. Because there were no signals in the PCR reactions using the primers for BDNF or Adad1, the possibility of contamination with genomic DNA was ruled out. C and D, The recruitment kinetics of Pol II (C) and TBP (D) were evaluated with ChIP assays. The Il2 promoter (PCR position: −77 to +39, closed columns) and the Adad1 promoter (open columns) regions were examined in the immunoprecipitates.
The kinetics of IL-2 mRNA induction was measured using a quantitative RT-PCR method, in which the quantitative PCR (qPCR) values are normalized to the genomic DNA standard for each primer pair (Fig. 1B, see Materials and Methods). As shown in the red lines of this figure, IL-2 mRNA was not detected in the PR-T cell population prior to activation. In 1 hr of stimulation with anti-CD3ε and anti-CD28, the mRNA was easily detected. At 2 hrs, the induced level reached 53-60% of maximum in all three assays using different primer sets. The levels then peaked at 3 hrs. Although the signals from the primers for the fourth exon were 2-4 fold less than those from the first or third exon primers, all of the PCR values showed the same induction kinetics. To evaluate the relative amount of Il2 transcription, we also performed qPCR using primers annealing to β-actin (blue lines) and CD3δ (green lines). β-Actin and CD3δ mRNA were expressed constitutively, although the mRNA level of β-actin was estimated to be ≥40 fold more than that of CD3δ. The latter appeared to decrease about 4 fold following 4 hrs of T cell activation. We also carried out qPCR using primer sets for brain derived neurotrophic factor (BDNF) (21) or adenosine deaminase domain containing 1 (Adad1) (22). Expression of these repressed genes was not observed at all during the 4 hr-stimulation period. Importantly, the induced level of IL-2 mRNA was comparable to the constitutive level of β-actin mRNA when the qPCR was performed with primers to either the first or third exons.
Recruitment kinetics of RNA polymerase II and TATA-binding protein
To evaluate transcriptional activity at the Il2 locus following T cell activation, we performed a chromatin immunoprecipitation (ChIP) assay using anti-RNA polymerase II (Pol II) Ab, which recognizes all Pol II proteins regardless of the phosphorylation state of the carboxy-terminal domain (CTD). As shown in Fig. 1C, the Il2 promoter in the precipitate from unactivated PR-T cells was at a background level, equivalent to the promoter of the non-expressing Adad1 gene. This indicates that no Pol II proteins were bound to the Il2 transcription start site (TSS) region before T cell activation, as reported previously (23). Subsequent activation, however, increased the Pol II level, reaching a maximum binding at 3 hrs. To confirm this timing, we also performed a ChIP assay using an anti-TATA-binding protein (TBP), one component of the preinitiation complex (PIC) (Fig. 1D). Its binding kinetics was identical to that of Pol II. These ChIP assays showed a good correlation with the expression level of IL-2 mRNA.
Timing of alterations in nucleosome and linker histone occupancy at the Il2 promoter during T cell activation
In our previous report, we used the new “SEVENS” assay to show that stimuli through the TCR and CD28 receptors on PR-T cells made nucleosomes around the Il2 promoter alter their arrangement. This structural change begins 1 hr after stimulation and is almost complete by 2 hrs (15). Although the occupancy of nucleosomes at the Il2 promoter is known to diminish following T cell activation (13, 14), the relationship between this event and changes observed in the SEVENS assay was not clear. In order to explore this, we performed ChIP assays with an anti-pan-histone H3 Ab, using our PR-T cells and the anti-CD3ε/CD28 stimulus (Fig. 2A). Precipitation of the Il2 promoter region remained constant up to 1 hr. Beyond this point, however, the ChIP value began to decrease, leveling off by 3-4 hrs at about 50% of the starting level. We also performed ChIP assays using an anti-histone H1 Ab. As shown in Fig. 2B, the amount of the Il2 promoter in the precipitate did not significantly change up to 2 hrs. Incubation for a 3rd hour, however, showed a 50-60% decrease in the level of the precipitated promoter, and this lower level was maintained at 4 hrs. This kinetics is similar to what was seen with the anti-histone H3 Ab. These observations suggest that both the nucleosomes and the linker histones alter their occupancy at the Il2 promoter following T cell activation. Importantly, it took the core and linker histones 3 hrs to be altered, while the structural change seen in the SEVENS assay is almost complete within the first 2 hrs of activation (15). Therefore, we conclude that structural activation at the Il2 promoter is composed of at least two separable changes: an initial remodeling event and a subsequent alteration in nucleosome occupancy.
FIGURE 2.
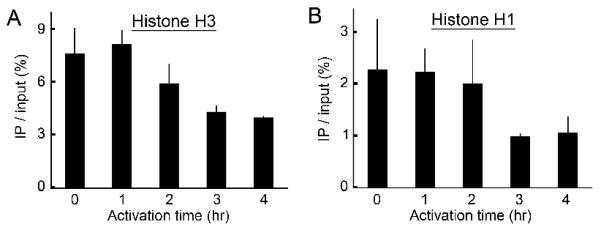
The removal kinetics of histone H3 and H1 from the Il2 promoter following T cell activation. A and B, In ChIP assays using anti-histone H3 (A) or anti-histone H1 (B), the Il2 promoter region (PCR position: −77 to +39) was precipitated from PR-T cells either unactivated or activated hourly for up to 4 hrs.
Kinetics of the recruitment of transcription factors to the Il2 promoter
The first 300 bp region of the Il2 promoter upstream from the transcription start site has been well characterized, and many binding sites for transcription factors have been mapped there, as shown in Fig. 3A (16). To explore the relationship between the binding of these transcription factors and the sequential chromatin structural changes, we investigated the recruitment kinetics of the transcription factors using ChIP assays.
FIGURE 3.

The recruitment kinetics of transcription factors to the Il2 promoter region. A, Many transcription factors bind to the Il2 promoter in the 300 bp region upstream from the TSS. The binding sites of the ones examined are shown as colored ovals. The black box and arrow represent the 1st exon and transcription direction, respectively. B-H, The recruitment kinetics of transcription factors at the Il2 promoter in PR-T cells were analyzed with ChIP assays using Abs against RelA (B), c-Rel (C), Oct2 (D), NFAT2 (E), NFAT1 (F), Jun proteins (G), or Fra-2 (H). The activation led these transcription factors to be gradually recruited to the Il2 promoter (PCR position: −220 to −111) (closed columns). In each experiment the level of the Adad1 promoter in the precipitates was used as a control for non-specific binding in the ChIP assay (open columns). Colored ovals in each chart correspond to their binding sites in the Il2 promoter shown in A. I, The normalized recruitment kinetics for all the factors are summarized. Since the value of the Il2 promoter precipitated by all Abs in unactivated PR-T cells was close to that of the Adad1 promoter, this value was used as the “0%” background for the ChIP assay. The maximal level was generally observed in PR-T cells activated for 3 hrs (except for the Fra-2 ChIP, where it was 4 hrs). The percentage of the binding at these time points was designated “100%”.
For the NFκB/Rel family, the recruitment of RelA and c-Rel to the Il2 promoter was examined (Fig. 3B and 3C). Before activation, both Abs hardly precipitated the Il2 promoter region. Stimulation with anti-CD3ε/CD28 increased the binding of both proteins to the Il2 promoter, reaching a maximum level by 3 hrs. No enhancement was seen at the Adad1 promoter over the same time period. Similar results were observed for Oct2 and NFAT2 (Fig. 3D and 3E). Fig. 3I shows the percent binding occupancy of these proteins over time (see legend for calculation). In all cases for this group of proteins, about 25% of the maximal level was bound to the Il2 promoter after 1 hr of activation. Although binding levels increased over the next hour, occupancy was still only 46-71% of the maximum, which was only reached at 3 hrs. These kinetics are similar to that for the formation of the Pol II complex (summarized in Fig. 3I). Importantly, because changes in occupancy of nucleosomes at the Il2 promoter also required activation for 3 hrs (Fig. 2A), the recruitment of these transcription factors appeared to occur in parallel with or just prior to this nucleosomal alteration rather than with the initial rearrangement of nucleosomes seen in the SEVENS assay.
We next examined the recruitment kinetics of NFAT1 (Fig. 3F). The binding of NFAT1 to the Il2 promoter was greatly increased within 1 hr, and the level for 2 hr-activated cells was 83% of the maximum seen after activation for 3 hrs. Surprisingly, this pattern was not comparable to that of NFAT2 (Fig. 3F vs. 3E). Thus, the recruitment of NFAT1 apparently preceded that of NFAT2. Finally, in order to examine the recruitment of AP-1 (Fos/Jun heterodimer), we performed ChIP assays using anti-pan-Jun and anti-Fra-2 Abs (Fig. 3G and 3H). For both proteins, activation for only 1 hr significantly increased the precipitated Il2 promoter, and the recruitment at 2 hrs almost reached the maximum level (95% for Jun and 87% for Fra-2). The recruitment of FosB showed a similar kinetics (data not shown). The parallel recruitment of Fos and Jun proteins suggests that we are observing the binding of AP-1 to the Il2 promoter. In addition, its kinetics are similar to that of NFAT1, implying that the well-known NFAT1/AP-1 complex assembles early on the activated Il2 promoter (24). These kinetics are also similar to the early chromatin remodeling seen with the SEVENS assay and thus raised the possibility that these two events were linked. As summarized in Fig. 3I, these careful ChIP analyses clearly subdivide the DNA-binding transcription factors required for Il2 transcription into two discernible groups: “early-binding” and “late-binding” proteins.
Inhibition of protein synthesis prevents the nucleosome rearrangement at the Il2 promoter
Because the Jun and Fos proteins are known to be induced by various extracellular stimuli such as hormones and stress (25), we evaluated the level of expression of these proteins, as well as the other transcription factors, in the PR-T cells (Fig. 4A). Only Fos proteins, observed with an anti-pan-Fos Ab, were completely absent in unactivated PR-T cells. After activation, Fos proteins were first detected at 0.5 hr, and both c-Fos and FosB/Fra-2 (indistinguishable bands) reached a maximum between 2 and 3 hrs. All the transcription factors other than Fos proteins were constitutively expressed, although the levels of Jun, c-Rel, and Oct2 increased somewhat during the activation period. In order to verify that AP-1 is required for the initial nucleosome rearrangement, we utilized cycloheximide (CHX), a general translation inhibitor, to create activated PR-T cells lacking all Fos proteins. Under these conditions, IL-2 transcripts were not detected (Supplementary Fig. S1A). Fig. 4B shows that 1 hr-activated PR-T cells treated with CHX did not show induction of any Fos proteins, although Jun proteins were still expressed at a basal level. In the SEVENS assay (Fig. 4C), the Il2 promoter was distributed evenly throughout all the fractions of the gradient (closed columns). This pattern is different from that observed in 1 hr-activated PR-T cells without CHX, showing enrichment of the Il2 promoter in the upper fractions (open columns), similar to the open chromatin pattern seen for the Actb promoter (Supplementary Fig. S2A). These observations indicate that CHX blocked the structural changes seen in the SEVENS assay around the Il2 promoter following T cell activation.
FIGURE 4.

Expression profiles of transcription factors at the protein level before and during T cell activation, and the effect of CHX on the chromatin remodeling at the Il2 promoter. A, Western blotting experiments were performed on total lysates from resting and activated PR-T cells. Fos proteins are marked with a circle (c-Fos) or a triangle (FosB/Fra-2 as indistinguishable bands), all of which were newly synthesized following activation. B, The prevention of induction of Fos proteins in CHX-treated PR-T cells was confirmed by Western blotting. C, The SEVENS assay on 1 hr-activated PR-T cells revealed that their pretreatment with CHX resulted in an even distribution in the gradient of the Il2 promoter (PCR position: −77 to +39, closed columns), which is different from that seen in cells not treated with CHX (open columns). As a control, the enrichment of the Actb promoter in the upper gradient fractions in the presence of CHX is shown in Supplementary Fig. S2A.
Contribution of dephosphorylation of NFAT1 to the initial chromatin rearrangement around the Il2 promoter following T cell activation
Following TCR signaling, NFAT1 is dephosphorylated by calcineurin and then translocated to the nucleus (26, 27). This event is well-known to be blocked by the pharmacologic inhibitor, FK506 (26, 28). Western blotting experiments were performed to confirm its effect on PR-T cells (Fig. 5A). The transcript from the Il2 gene was barely detectable in the drug-treated cells (Supplementary Fig. S1B). In the SEVENS assay, FK506 treatment resulted in an even fractional distribution of the Il2 promoter in 3 hr-activated cells (yellow columns in Fig. 5C). This is different from FK506-untreated, but activated cells (blue columns), and corresponds to what is seen in unactivated PR-T cells (red columns). In contrast, the distribution pattern of the Actb promoter was not affected by the drug (open columns in Supplementary Fig. S2B). Thus, FK506 specifically blocked the nucleosome rearrangement around the Il2 promoter. Taken together with the rapid recruitment of NFAT1 to the promoter, the data argue that activation of this transcription factor is required for the initial change in the chromatin structure at the Il2 promoter. In addition, changes in occupancy of nucleosomes and linker histones at the Il2 promoter were not observed, consistent with their being downstream events (arrows over the yellow bars in Fig. 5D).
FIGURE 5.

The effect of FK506 or SP600125 on the nucleosome rearrangement and occupancy of core and linker histones at the Il2 promoter. A, The prevention of dephosphorylation of NFAT1 in FK506-treated PR-T cells was confirmed by Western blotting. The arrow or the arrowhead denotes the dephosphorylated or the phosphorylated form of NFAT1, respectively. B, The prevention of phosphorylation of c-Jun in SP600125-treated cells was confirmed by Western blotting using anti-phopho-c-Jun (serine 63). C, The SEVENS assays for 3 hr-activated PR-T cells revealed that the pre-treatment with FK506 (yellow columns), but not SP600125 (green columns), blocked the enrichment of the Il2 promoter (PCR position: −77 to +39) in the upper fractions. For comparison, the distribution of the Il2 promoter in unactivated (red columns) or 3 hr-activated drug-non-treated cells (blue columns) is shown. The distribution of the Actb promoter was not affected by either of the drugs (Supplementary Fig. S2B). D, ChIP assays using anti-histone H3 (left panel) or H1 (right panel) showing that FK506 and SP600125 prevented core/linker histones from being removed from the Il2 promoter following 3 hr-activation (arrows and arrowheads, respectively). As controls, the constant level of these histones binding to the Actb or Adad1 promoters was monitored. Because of different lots of the Abs used, the actual values in this figure are not the same as those shown in Fig. 2
An inhibitor of Jun phosphorylation prevents the changes in nucleosome occupancy, CBP and late transcription factor binding, and histone acetylation, but not the initial chromatin rearrangement
The activity of c-Jun is believed to require phosphorylations at serine residues 63 and 73 by c-Jun N-terminal kinase (JNK) in order to respond to various stimuli (29, 30). To explore the contribution of these phosphorylation events to the chromatin structural changes, we utilized SP600125, a chemical that inhibits JNK activity (31). The effect of this drug was confirmed in Western blotting (Fig. 5B). When the drug-pretreated, activated cells were applied to the SEVENS assay, we still observed enrichment of the Il2 promoter into the upper fractions of the gradient (green columns in Fig. 5C). This indicates that SP600125 did not greatly affect this chromatin structural change, despite its 90% inhibition of IL-2 transcription (Supplementary Fig. S1B). Thus, although induction of Fos, the partner of Jun in an AP-1 complex, is required for the initial chromatin changes (Fig. 4C), the phosphorylation of c-Jun is not essential for this step. Instead, SP600125 blocked the changes in nucleosome and linker histone occupancy at the Il2 promoter following T cell activation (arrowheads over the green bars in Fig. 5D). In addition, the drug blocked the enhanced binding of all the “late-binding” transcription factors as measured in ChIP assays 3 hrs after T cell activation (green bars in Figs. 6B-E). Pol II and TBP also did not bind to the promoter in the drug-treated cells (data not shown). The selective effect of SP600125 supports a two-step model for the chromatin remodeling in which the phosphorylation of serines 63/73 in c-Jun is required for the transition between the first and second steps.
FIGURE 6.
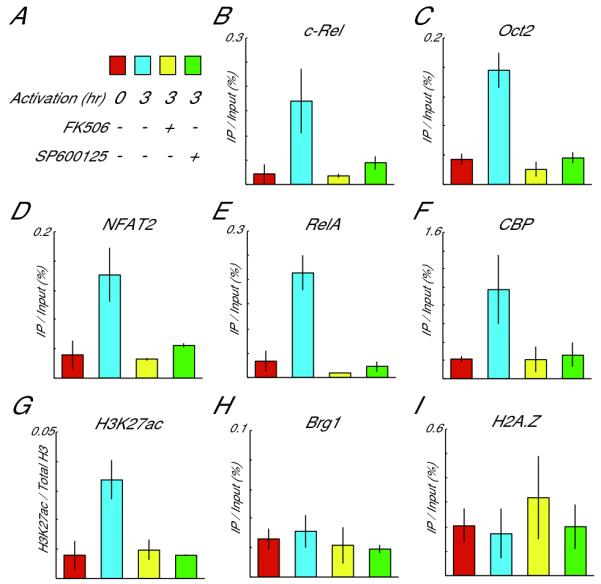
ChIP assays to examine the recruitment of the “late-binding” transcription factors and chromatin-related factors to the Il2 promoter (PCR position: -220 to -111). A, The culture conditions are represented in this key by four different colors. Red is cells without activation and drugs; blue is cells activated without drugs for 3 hrs; yellow is cells activated for 3 hrs in the presence of 10 nM FK506; and green is cells activated for 3 hrs in the presence of 30μM SP600125. B-E, The recruitment of the “late-binding” factors Rel A (B), c-Rel (C), Oct2 (D) and NFAT2 (E), was blocked by SP600125 as well as FK506. F, CBP, a coactivator with HAT activity, bound to the Il2 promoter upon T cell activation. Treatment with either FK506 or SP600125 blocked this recruitment. G, Histone H3 was acetylated at lysine 27 in the activated PR-T cells. Similar to the pattern for CBP, the level of acetylation was not increased when either of the drugs was added to the culture. These values are normalized by total amount of histone H3. H and I, TCR activation did not enhance Brg1 binding (H) or enrich for the presence of H2A.Z (I), at the Il2 locus.
Phosphorylated c-Jun is known to bind to CREB binding protein (CBP), which possesses histone acetyltransferase (HAT) activity (30). To evaluate the contribution of this protein, we performed ChIP assays using an anti-CBP Ab. Recruitment of CBP to the Il2 promoter was indeed observed in 3 hr-activated PR-T cells (blue column in Fig. 6F). Furthermore, treatment with SP600125 prevented CBP from being recruited (green column in Fig. 6F). In addition, ChIP assays with an antibody specific for histone H3 acetylation at lysine 27 showed an enhancement in this histone modification 3h after T cell stimulation (Fig. 6G). This too was blocked by SP600125. In contrast, Brahma-related gene 1 (Brg1), a SWI/SNF chromatin remodeling factor, and histone H2AZ, a variant for histone H2A, which are both associated with chromatin structural changes at activated loci, were not enriched at the Il2 promoter upon T cell activation (Fig. 6H and 6I). These observations suggest that CBP and its possible product, H3K27ac, are involved in facilitating the binding of the late transcription factors and diminishing the nucleosomal occupancy at the activated Il2 promoter.
Discussion
We have recently described a new assay, designated “SEVENS”, which is able to estimate the local compactness of chromatin via the frequency of chemical crosslinking (15). Using this assay, we found that the density of nucleosomes in the vicinity of the Il2 promoter begins to decrease within 1 hr when PR-T cells are stimulated with anti-CD3ε and anti-CD28 Abs. This change is almost complete in the cell population by 2 hrs (15). There is also a decrease in the nucleosome occupancy at the Il2 promoter as observed in a ChIP assay with anti-histone H3 Ab; however, this process takes 3 hrs to show a significant change (Fig. 2). This one hour time lag indicates that the alteration in nucleosome occupancy follows the structural change seen in the SEVENS assay, suggesting that two distinct changes in the chromatin structure are occurring sequentially. Because the DNA helix in the cell is folded into high order structures such as 30-nm fibers and chromatin loops, (1, 2), sequential changes in structure to unveil the Il2 locus after induction would seem plausible. For example, after relieving compression of chromatin structure through decompaction, the nucleosomes could then be free to reposition their location on the DNA or alter their exchange rates.
The factors required for IL-2 transcription have been reported to work cooperatively (17, 18). Our ChIP assays, however, suggest a two-step process in transcription complex assembly, with “early-binding” factors (NFAT1, Jun, and Fos) and “late-binding” factors (Oct2, RelA, c-Rel, and NFAT2). The Jun and Fos families, known as immediate early genes, harbor a paused pre-initiation complex (PIC) even before the cells receive a stimulus (32, 33). In our PR-T cells, the Jun proteins are already expressed prior to activation. Thus, the rate limiting step is the induction of the Fos proteins, which begin expressing by 0.5 hr after stimulation (Fig. 4A). In contrast, expression of IL-2 mRNA appears to take a longer time. RNA polymerase is not dwelling on this promoter at time “0” (Fig. 1C), indicating that this gene is transcribed as a secondary response gene in T cell activation. In addition, the factor binding required for its transcription occurs in two sequential steps. The early-binding factors reach >80% of maximum levels within 2 hrs of IL-2 induction (Fig. 3I). This recruitment kinetics corresponds to that of the initial nucleosome rearrangement seen in the SEVENS assay. Disruption of Fos production (by CHX) or prevention of nuclear mobilization of NFAT (by FK506) blocked this initial nucleosome rearrangement (Fig. 4C and yellow columns of Fig. 5C), suggesting that these two factors are required for the event. Perhaps this is a general function of poised genes. After this step, the late-binding factors seem to be capable of recognizing their target sequences in the pre-opened chromatin. This in turn presumably results in the alterations in nucleosome occupancy at the Il2 promoter. This second step is blocked by the JNK inhibitor SP600125, which prevents Jun phosphorylation and CBP binding. However, why there is a second rate-limiting step, which delays the late-factor binding for an average of an hour, is still not clear. A similar two-component process for the binding of transcription factors to the Il2 promoter (observed by EMSA) was reported following forskolin addition to EL4 cells (17). The elevation of cAMP disrupted NFκB and TGGGC binding activities following T cell activation, but not that of NFAT and AP-1. Thus, there appears to be a check point after NFAT1/AP-1 binding where activation of the Il2 locus can be prevented by inhibiting the second step in various ways. Finally, transcriptional activation at the interleukin-1β promoter also occurs in a multi-step process involving first the recruitment of PU.1 and C/EBPβ, next the recruitment of a third factor IRF-4, and then the binding of RNA polymerase (34). Thus, sequential binding of transcription factors might be the normal series of events for activation of inducible cytokine genes.
How do the early-binding transcription factors work for the initial chromatin rearrangement around the Il2 proximal promoter? The NFAT1, c-Jun, and c-Fos proteins have been reported to interact with CBP, a co-activator that includes a HAT activity (30, 35, 36). While CBP does in fact get recruited to the Il2 promoter following T cell activation (Fig. 6F), this binding was inhibited by SP600125, a drug that could not block the early changes in the SEVENS assay (Fig. 5C). Therefore, CBP and its H3K27 acetylation are dispensable for the first step. We also did not detect any increase in acetylation of histone H3 at lysines 9/14 or histone H4 at lysines 5/8/12/16 (15). Thus, acetylation of histones is unlikely to be responsible for the chromatin rearrangement, although there is still the possibility that other histone modifications we have not examined contribute to this change. Recombinant AP-1 has been reported to make reconstituted nucleosomes accessible to a nuclease, prior to the binding of another transcription factor (37). Taken together with the whole genome analysis showing co-localization of AP-1 with a pioneer factor, FoxA1 (38), AP-1 may collaborate with such a factor to loosen chromatin structure at the activated Il2 promoter. Interestingly, the initial nucleosome rearrangement appeared to require NFAT1, but not NFAT2, as reflected in their different recruitment kinetics (Fig. 3I). Such separable binding of NFAT family members has also been observed in human Jurkat cells stimulated with PMA and ionomycin (39). Only NFAT1 has a unique C-terminal domain, which is reported to function as a transactivation domain as well as an interaction domain with Jun (39, 40). This domain may contribute to the initial change at the Il2 promoter. In addition, NFAT1 is known to interact with Brg1, and to recruit it to the promoter region of the interferon-γ locus following activation of T cells (41). However, our ChIP assays failed to detect the recruitment of Brg1 to the Il2 promoter following activation (Fig. 6H). Nonetheless, other family members, such as Brahma, could bind to the Il2 promoter of activated T cells and contribute to the change seen in the SEVENS assay. Finally, NFAT1 has been reported to facilitate the up-regulation of c-Rel expression by binding directly to its promoter (42). Thus, NFAT1 could be responsible for the late enhancement of c-Rel expression we observed (Fig. 4A), and this in turn could be the second rate-limiting step for IL-2 transcription (14).
The nucleosomes were diminished around the Il2 proximal promoter as the second change detected following T cell activation. This structural change occurred with a similar kinetics to that of Pol II binding to the Il2 promoter. This reciprocal relationship is consistent with whole genome analyses in human T cells showing that expressed loci generally lack nucleosomes just upstream of the TSS, which instead is occupied by a Pol II complex (43). This change was blocked by both FK506 and SP600125 (Fig. 5D). The FK506 effect presumably results from disruption of the initial chromatin remodeling step, and thus also prevents any further downstream events. SP600125, however, hardly affects the initial step (green columns in Fig. 5C), and instead the Jun phosphorylations seem to be required for the second step. The major target of JNK phosphorylation is c-Jun (44); however, its DNA binding to target genes does not depend on its phosphorylation (45). Therefore, it is possible that c-Jun proteins have a dual function. First, non-phosphorylated c-Jun would bind and loosen the chromatin structure, and then, after JNK phosphorylation, operate to recruit in other remodeling proteins. JNK-mediated phosphorylation of c-Jun has been reported to result in recruitment of the CBP coactivator (30), which is capable of catalyzing acetylation at lysine 27 of histone H3 (46). Here we show that T cell activation resulted in the recruitment of CBP to the Il2 promoter and an increase in H3K27-acetylation (Figs. 6F and 6G). Importantly, the pharmacologic block of the c-Jun phosphorylation inhibited both of these events, suggesting that the H3K27ac might be required for late transcription factor binding and changes in nucleosome occupancy at the Il2 promoter. This idea is supported by previous reports showing that some lysine residues of histone H3 are acetylated at MNase hypersensitive sites in the Il2 promoter of fully activated T cells (12, 14). Alternatively, either of those two events could be the rate limiting step since they were also blocked by SP600125. Finally, IL-2 transcription is also negatively regulated by the transcription factors CREM/ICER, Nil-2a, and Ikaros (47-51), which we have not examined in this paper. Although whole genome analyses have not shown any apparent enrichment of methylation of histone H3 at lysine 27 (a repressive epigenetic mark that opposes transcriptional activation) at the Il2 promoter in resting murine CD4+ T cells (52), the negatively regulating transcription factors might facilitate the deposition of other repressive marks such as methylation of lysine 9 on histone H3. TCR stimulation might then be needed to erase such marks by a process that could also be rate-limiting for the second step in IL-2 gene activation.
Supplementary Material
Acknowledgments
We are grateful to Dr. Anjana Rao for anti-NFAT1 antibody. We also thank Drs. Ellen Rothenberg, Gary Felsenfeld, Carl Wu, Wendy Bickmore, Keiko Ozato, Rajat Varma, and Nevil Singh for constructive criticisms of the experiments presented in this manuscript.
3 Abbreviations used in this paper
- SEVENS
sedimentation velocity method followed by normalization in the size of the DNA
- PR-T
preactivated resting T
- CHX
cycloheximide
- qPCR
quantitative PCR
- BDNF
brain derived neurotrophic factor
- Adad1
adenosine deaminase domain containing 1
- ChIP
chromatin immunoprecipitation
- Pol II
RNA polymerase II
- TSS
transcription start site
- TBP
TATA-binding protein
- PIC
preinitiation complex
- CBP
CREB-binding protein
- HAT
histone acetyltransferase
- H3K27ac
acetylation of lysine residue at position 27 of histone H3
- Brg1
Brahma-related gene 1
Footnotes
This research was supported by the Intramural Research Program of NIAID, at the U.S. National Institutes of Health.
References
- 1.Kornberg RD. Chromatin structure: a repeating unit of histones and DNA. Science. 1974;184:868–871. doi: 10.1126/science.184.4139.868. [DOI] [PubMed] [Google Scholar]
- 2.Tremethick DJ. Higher-order structures of chromatin: the elusive 30 nm fiber. Cell. 2007;128:651–654. doi: 10.1016/j.cell.2007.02.008. [DOI] [PubMed] [Google Scholar]
- 3.Muller WG, Walker D, Hager GL, McNally JG. Large-scale chromatin decondensation and recondensation regulated by transcription from a natural promoter. J. Cell Biol. 2001;154:33–48. doi: 10.1083/jcb.200011069. [DOI] [PMC free article] [PubMed] [Google Scholar]
- 4.Nye AC, Rajendran RR, Stenoien DL, Mancini MA, Katzenellenbogen BS, Belmont AS. Alteration of large-scale chromatin structure by estrogen receptor. Mol. Cell. Biol. 2002;22:3437–3449. doi: 10.1128/MCB.22.10.3437-3449.2002. [DOI] [PMC free article] [PubMed] [Google Scholar]
- 5.Agalioti T, Lomvardas S, Parekh B, Yie J, Maniatis T, Thanos D. Ordered recruitment of chromatin modifying and general transcription factors to the IFN-beta promoter. Cell. 2000;103:667–678. doi: 10.1016/s0092-8674(00)00169-0. [DOI] [PubMed] [Google Scholar]
- 6.Lomvardas S, Thanos D. Modifying gene expression programs by altering core promoter chromatin architecture. Cell. 2002;110:261–271. doi: 10.1016/s0092-8674(02)00822-x. [DOI] [PubMed] [Google Scholar]
- 7.Dilworth FJ, Chambon P. Nuclear receptors coordinate the activities of chromatin remodeling complexes and coactivators to facilitate initiation of transcription. Oncogene. 2001;20:3047–3054. doi: 10.1038/sj.onc.1204329. [DOI] [PubMed] [Google Scholar]
- 8.Leonard WJ. Type I cytokines and interferons and their receptors. In: Paul WE, editor. Fundamental Immunology. 6th ed Lippincott Williams & Wilkins; Philadelphia, PA: 2008. pp. 706–749. [Google Scholar]
- 9.Siebenlist U, Durand DB, Bressler P, Holbrook NJ, Norris CA, Kamoun M, Kant JA, Crabtree GR. Promoter region of interleukin-2 gene undergoes chromatin structure changes and confers inducibility on chloramphenicol acetyltransferase gene during activation of T cells. Mol. Cell. Biol. 1986;6:3042–3049. doi: 10.1128/mcb.6.9.3042. [DOI] [PMC free article] [PubMed] [Google Scholar]
- 10.Ward SB, Hernandez-Hoyos G, Chen F, Waterman M, Reeves R, Rothenberg EV. Chromatin remodeling of the interleukin-2 gene: distinct alterations in the proximal versus distal enhancer regions. Nucleic Acids Res. 1998;26:2923–2934. doi: 10.1093/nar/26.12.2923. [DOI] [PMC free article] [PubMed] [Google Scholar]
- 11.Rao S, Procko E, Shannon MF. Chromatin remodeling, measured by a novel real-time polymerase chain reaction assay, across the proximal promoter region of the IL-2 gene. J. Immunol. 2001;167:4494–4503. doi: 10.4049/jimmunol.167.8.4494. [DOI] [PubMed] [Google Scholar]
- 12.Thomas RM, Gao L, Wells AD. Signals from CD28 induce stable epigenetic modification of the IL-2 promoter. J. Immunol. 2005;174:4639–4646. doi: 10.4049/jimmunol.174.8.4639. [DOI] [PubMed] [Google Scholar]
- 13.Chen X, Wang J, Woltring D, Gerondakis S, Shannon MF. Histone dynamics on the interleukin-2 gene in response to T-cell activation. Mol. Cell. Biol. 2005;25:3209–3219. doi: 10.1128/MCB.25.8.3209-3219.2005. [DOI] [PMC free article] [PubMed] [Google Scholar]
- 14.McKarns SC, Schwartz RH. Biphasic regulation of Il2 transcription in CD4+ T cells: roles for TNF-alpha receptor signaling and chromatin structure. J. Immunol. 2008;181:1272–1281. doi: 10.4049/jimmunol.181.2.1272. [DOI] [PMC free article] [PubMed] [Google Scholar]
- 15.Ishihara S, Varma R, Schwartz RH. A new fractionation assay, based on the size of formaldehyde-crosslinked, mildly sheared chromatin, delineates the chromatin structure at promoter regions. Nucleic Acids Res. 2010;38:e124. doi: 10.1093/nar/gkq203. [DOI] [PMC free article] [PubMed] [Google Scholar]
- 16.Schwartz RH. T cell clonal anergy. Curr. Opin. Immunol. 1997;9:351–357. doi: 10.1016/s0952-7915(97)80081-7. [DOI] [PubMed] [Google Scholar]
- 17.Chen D, Rothenberg EV. Interleukin 2 transcription factors as molecular targets of cAMP inhibition: delayed inhibition kinetics and combinatorial transcription roles. J Exp. Med. 1994;179:931–942. doi: 10.1084/jem.179.3.931. [DOI] [PMC free article] [PubMed] [Google Scholar]
- 18.Garrity PA, Chen D, Rothenberg EV, Wold BJ. Interleukin-2 transcription is regulated in vivo at the level of coordinated binding of both constitutive and regulated factors. Mol. Cell. Biol. 1994;14:2159–2169. doi: 10.1128/mcb.14.3.2159. [DOI] [PMC free article] [PubMed] [Google Scholar]
- 19.Sojka DK, Bruniquel D, Schwartz RH, Singh NJ. IL-2 secretion by CD4+ T cells in vivo is rapid, transient, and influenced by TCR-specific competition. J. Immunol. 2004;172:6136–6143. doi: 10.4049/jimmunol.172.10.6136. [DOI] [PubMed] [Google Scholar]
- 20.Nowak DE, Tian B, Brasier AR. Two-step cross-linking method for identification of NF-kappaB gene network by chromatin immunoprecipitation. Biotechniques. 2005;39:715–725. doi: 10.2144/000112014. [DOI] [PubMed] [Google Scholar]
- 21.Leibrock J, Lottspeich F, Hohn A, Hofer M, Hengerer B, Masiakowski P, Thoenen H, Barde YA. Molecular cloning and expression of brain-derived neurotrophic factor. Nature. 1989;341:149–152. doi: 10.1038/341149a0. [DOI] [PubMed] [Google Scholar]
- 22.Schumacher JM, Lee K, Edelhoff S, Braun RE. Distribution of Tenr, an RNA-binding protein, in a lattice-like network within the spermatid nucleus in the mouse. Biol. Reprod. 1995;52:1274–1283. doi: 10.1095/biolreprod52.6.1274. [DOI] [PubMed] [Google Scholar]
- 23.Adachi S, Rothenberg EV. Cell-type-specific epigenetic marking of the IL2 gene at a distal cis-regulatory region in competent, nontranscribing T-cells. Nucleic Acids Res. 2005;33:3200–3210. doi: 10.1093/nar/gki637. [DOI] [PMC free article] [PubMed] [Google Scholar]
- 24.Chen L, Glover JN, Hogan PG, Rao A, Harrison SC. Structure of the DNA-binding domains from NFAT, Fos and Jun bound specifically to DNA. Nature. 1998;392:42–48. doi: 10.1038/32100. [DOI] [PubMed] [Google Scholar]
- 25.Karin M, Liu Z, Zandi E. AP-1 function and regulation. Curr. Opin. Cell Biol. 1997;9:240–246. doi: 10.1016/s0955-0674(97)80068-3. [DOI] [PubMed] [Google Scholar]
- 26.Clipstone NA, Crabtree GR. Identification of calcineurin as a key signalling enzyme in T-lymphocyte activation. Nature. 1992;357:695–697. doi: 10.1038/357695a0. [DOI] [PubMed] [Google Scholar]
- 27.Jain J, McCaffrey PG, Miner Z, Kerppola TK, Lambert JN, Verdine GL, Curran T, Rao A. The T-cell transcription factor NFATp is a substrate for calcineurin and interacts with Fos and Jun. Nature. 1993;365:352–355. doi: 10.1038/365352a0. [DOI] [PubMed] [Google Scholar]
- 28.Liu J, Farmer LD, Jr., Lane WS, Friedman J, Weissman I, Schreiber SL. Calcineurin is a common target of cyclophilin-cyclosporin A and FKBP-FK506 complexes. Cell. 1991;66:807–815. doi: 10.1016/0092-8674(91)90124-h. [DOI] [PubMed] [Google Scholar]
- 29.Derijard B, Hibi M, Wu IH, Barrett T, Su B, Deng T, Karin M, Davis RJ. JNK1: a protein kinase stimulated by UV light and Ha-Ras that binds and phosphorylates the c-Jun activation domain. Cell. 1994;76:1025–1037. doi: 10.1016/0092-8674(94)90380-8. [DOI] [PubMed] [Google Scholar]
- 30.Arias J, Alberts AS, Brindle P, Claret FX, Smeal T, Karin M, Feramisco J, Montminy M. Activation of cAMP and mitogen responsive genes relies on a common nuclear factor. Nature. 1994;370:226–229. doi: 10.1038/370226a0. [DOI] [PubMed] [Google Scholar]
- 31.Bennett BL, Sasaki DT, Murray BW, O’Leary EC, Sakata ST, Xu W, Leisten JC, Motiwala A, Pierce S, Satoh Y, Bhagwat SS, Manning AM, Anderson DW. SP600125, an anthrapyrazolone inhibitor of Jun N-terminal kinase. Proc. Natl. Acad. Sci. USA. 2001;98:13681–13686. doi: 10.1073/pnas.251194298. [DOI] [PMC free article] [PubMed] [Google Scholar]
- 32.Aida M, Chen Y, Nakajima K, Yamaguchi Y, Wada T, Handa H. Transcriptional pausing caused by NELF plays a dual role in regulating immediate-early expression of the junB gene. Mol. Cell. Biol. 2006;26:6094–6104. doi: 10.1128/MCB.02366-05. [DOI] [PMC free article] [PubMed] [Google Scholar]
- 33.Plet A, Eick D, Blanchard JM. Elongation and premature termination of transcripts initiated from c-fos and c-myc promoters show dissimilar patterns. Oncogene. 1995;10:319–328. [PubMed] [Google Scholar]
- 34.Liang MD, Zhang Y, McDevit D, Marecki S, Nikolajczyk BS. The interleukin-1β gene is transcribed from a poised promoter architecture in monocytes. J. Biol. Chem. 2006;281:9227–9237. doi: 10.1074/jbc.M510700200. [DOI] [PubMed] [Google Scholar]
- 35.Garcia-Rodriguez C, Rao A. Nuclear factor of activated T cells (NFAT)-dependent transactivation regulated by the coactivators p300/CREB-binding protein (CBP) J. Exp. Med. 1998;187:2031–2036. doi: 10.1084/jem.187.12.2031. [DOI] [PMC free article] [PubMed] [Google Scholar]
- 36.Bannister AJ, Kouzarides T. CBP-induced stimulation of c-Fos activity is abrogated by E1A. EMBO J. 1995;14:4758–4762. doi: 10.1002/j.1460-2075.1995.tb00157.x. [DOI] [PMC free article] [PubMed] [Google Scholar]
- 37.Ng KW, Ridgway P, Cohen DR, Tremethick DJ. The binding of a Fos/Jun heterodimer can completely disrupt the structure of a nucleosome. EMBO J. 1997;16:2072–2085. doi: 10.1093/emboj/16.8.2072. [DOI] [PMC free article] [PubMed] [Google Scholar]
- 38.Lupien M, Eeckhoute J, Meyer CA, Wang Q, Zhang Y, Li W, Carroll JS, Liu XS, Brown M. FoxA1 translates epigenetic signatures into enhancer-driven lineage-specific transcription. Cell. 2008;132:958–970. doi: 10.1016/j.cell.2008.01.018. [DOI] [PMC free article] [PubMed] [Google Scholar]
- 39.Nguyen TN, Kim LJ, Walters RD, Drullinger LF, Lively TN, Kugel JF, Goodrich JA. The C-terminal region of human NFATc2 binds cJun to synergistically activate interleukin-2 transcription. Mol. Immunol. 2010;47:2314–2322. doi: 10.1016/j.molimm.2010.05.287. [DOI] [PMC free article] [PubMed] [Google Scholar]
- 40.Kaminuma O, Kitamura F, Kitamura N, Hiroi T, Miyoshi H, Miyawaki A, Miyatake S. Differential contribution of NFATc2 and NFATc1 to TNF-alpha gene expression in T cells. J. Immunol. 2008;180:319–326. doi: 10.4049/jimmunol.180.1.319. [DOI] [PubMed] [Google Scholar]
- 41.Zhang F, Boothby M. T helper type 1-specific Brg1 recruitment and remodeling of nucleosomes positioned at the IFN-gamma promoter are Stat4 dependent. J. Exp. Med. 2006;203:1493–1505. doi: 10.1084/jem.20060066. [DOI] [PMC free article] [PubMed] [Google Scholar]
- 42.Nolz JC, Fernandez-Zapico ME, Billadeau DD. TCR/CD28-stimulated actin dynamics are required for NFAT1-mediated transcription of c-rel leading to CD28 response element activation. J. Immunol. 2007;179:1104–1112. doi: 10.4049/jimmunol.179.2.1104. [DOI] [PubMed] [Google Scholar]
- 43.Schones DE, Cui K, Cuddapah S, Roh TY, Barski A, Wang Z, Wei G, Zhao K. Dynamic regulation of nucleosome positioning in the human genome. Cell. 2008;132:887–898. doi: 10.1016/j.cell.2008.02.022. [DOI] [PMC free article] [PubMed] [Google Scholar]
- 44.Kallunki T, Deng T, Hibi M, Karin M. c-Jun can recruit JNK to phosphorylate dimerization partners via specific docking interactions. Cell. 1996;87:929–939. doi: 10.1016/s0092-8674(00)81999-6. [DOI] [PubMed] [Google Scholar]
- 45.Aguilera C, Nakagawa K, Sancho R, Chakraborty A, Hendrich B, Behrens A. c-Jun N-terminal phosphorylation antagonises recruitment of the Mbd3/NuRD repressor complex. Nature. 2011;469:231–235. doi: 10.1038/nature09607. [DOI] [PubMed] [Google Scholar]
- 46.Pasini D, Malatesta M, Jung HR, Walfridsson J, Willer A, Olsson L, Skotte J, Wutz A, Porse B, Jensen ON, Helin K. Characterization of an antagonistic switch between histone H3 lysine 27 methylation and acetylation in the transcriptional regulation of Polycomb group target genes. Nucleic Acids Res. 2010;38:4958–4969. doi: 10.1093/nar/gkq244. [DOI] [PMC free article] [PubMed] [Google Scholar]
- 47.Bodor J, Spetz AL, Strominger JL, Habener JF. cAMP inducibility of transcriptional repressor ICER in developing and mature human T lymphocytes. Proc. Natl. Acad. Sci. USA. 1996;93:3536–93541. doi: 10.1073/pnas.93.8.3536. [DOI] [PMC free article] [PubMed] [Google Scholar]
- 48.Powell JD, Lerner CG, Ewoldt GR, Schwartz RH. The −180 site of the IL-2 promoter is the target of CREB/CREM binding in T cell anergy. J. Immunol. 1999;163:6631–6639. [PubMed] [Google Scholar]
- 49.Williams TM, Moolten D, Burlein J, Romano J, Bhaerman R, Godillot A, Mellon M, Rauscher FJ, 3rd, Kant JA. Identification of a zinc finger protein that inhibits IL-2 gene expression. Science. 1991;254:1791–1794. doi: 10.1126/science.1840704. [DOI] [PubMed] [Google Scholar]
- 50.Bandyopadhyay S, Duré M, Paroder M, Soto-Nieves N, Puga I, Macián F. Interleukin 2 gene transcription is regulated by Ikaros-induced changes in histone acetylation in anergic T cells. Blood. 2007;109:2878–2886. doi: 10.1182/blood-2006-07-037754. [DOI] [PMC free article] [PubMed] [Google Scholar]
- 51.Thomas RM, Chunder N, Chen C, Umetsu SE, Winandy S, Wells AD. Ikaros enforces the costimulatory requirement for IL2 gene expression and is required for anergy induction in CD4+ T lymphocytes. J. Immunol. 2007;179:7305–7315. doi: 10.4049/jimmunol.179.11.7305. [DOI] [PubMed] [Google Scholar]
- 52.Wei G, Wei L, Zhu J, Zang C, Hu-Li J, Yao Z, Cui K, Kanno Y, Roh TY, Watford WT, Schones DE, Peng W, Sun HW, Paul WE, O’Shea JJ, Zhao K. Global mapping of H3K4me3 and H3K27me3 reveals specificity and plasticity in lineage fate determination of differentiating CD4+ T cells. Immunity. 2009;30:155–167. doi: 10.1016/j.immuni.2008.12.009. [DOI] [PMC free article] [PubMed] [Google Scholar]
Associated Data
This section collects any data citations, data availability statements, or supplementary materials included in this article.