

Abstract
Breath analysis is a powerful non-invasive technique for the diagnosis and monitoring of respiratory diseases, including asthma and chronic obstructive pulmonary disease (COPD). Exhaled nitric oxide (NO) and carbon monoxide (CO) are markers of airway inflammation and can indicate the extent of respiratory diseases. We have developed a compact fast response quantum cascade laser system for analysis of multiple gases by tunable infrared absorption spectroscopy (TILDAS). The ARI breath analysis instrument has been deployed in a study of exhaled breath from patients with asthma or COPD. A total of 173 subjects participated, including both adult and pediatric patients. Patients in asthma or COPD exacerbations were evaluated twice—during the exacerbation and at a follow-up visit—to compare variations in breath biomarkers during these events. The change in exhaled NO levels between exacerbation and ‘well’ visits is consistent with spirometry data collected. Respiratory models are important for understanding the exchange dynamics of nitric oxide and other species in the lungs and airways. At each patient visit, tests were conducted at four expiratory flow rates. We have applied a trumpet model with axial diffusion to the multi-flow exhaled nitric oxide data, obtaining NO alveolar concentrations and airway fluxes. We found higher airway fluxes for those with more severe asthma and during exacerbation events. The alveolar concentrations from the model were higher in adults with asthma and COPD, but this trend was less clear among the pediatric subjects.
1. Introduction
Asthma and chronic obstructive pulmonary disease (COPD) are widespread respiratory diseases involving airway inflammation. Asthma is a chronic inflammation of the airways that involves airflow obstruction and increased airway responsiveness to a variety of stimuli [1–2]. A key feature is the inflammation in both proximal and distal lung airways. Although asthma affects people of all ages, it often starts in childhood. Asthma is a growing medical problem with its incidence increasing in recent years. Chronic obstructive pulmonary disease (COPD) is a chronic disease of the airways characterized by a gradually increasing loss of lung function. The classification of COPD includes chronic bronchitis, chronic obstructive bronchitis, or emphysema, with cigarette smoking its most important risk factor, although a significant role has been established for environmental and occupational exposures [3].
Conventional diagnosis of asthma and COPD includes lung function tests such as spirometry and peak flows, along with reported symptoms. The spirometer measures how much and how fast a patient can expel air from the lungs after a deep breath. This test, however, cannot be used with children under the age of five, has poor sensitivity, and is not specific.
Breath analysis has great potential in the diagnosis and treatment of respiratory problems, including asthma and COPD. These lung diseases are characterized by chronic inflammation of the lungs, associated with oxidative stress in the lungs. This causes the release of increased amounts of reactive oxygen species, damaging the lung tissues of patients with asthma or COPD.
The presence of nitric oxide (NO) and carbon monoxide (CO) in breath have been identified as biomarkers of asthma and COPD [4–5]. Exhaled NO has been associated with asthma and sensitization to perennial allergens. Malmberg et al. [6] found that exhaled NO is superior to other more accepted guidelines, including baseline respiratory function and bronchodilator responsiveness, in identifying preschool children with asthma. Exhaled NO is also directly correlated with extent of untreated asthma and research has shown that it decreases with corticosteroid treatment [5–8].
Treatment of asthma involves the attempt to reduce or eliminate inflammation, often through administration of inhaled corticosteroids. The decision to use these medications usually depends on reported symptoms and lung function tests. But these lung function tests do not always correlate with the asthma condition [9–10] If this is true, then there is clearly a need for a new approach to assess the extent of inflammation in asthma and thus make better treatment decisions.
Models are being developed to characterize the exchange of NO in the respiratory system [11–15]. For example, in a two compartment model George et al.[11] characterize NO exchange using three flow-independent exchange parameters to describe the airway compartment and the alveolar region. The model is applied to exhaled nitric oxide measured at several different exhalation flow rates, to separately assess alveolar and bronchial NO [13, 15]. It is generally recognized that the fractional exhaled NO (FENO) is increased due to asthma and allergy. Some researchers suggest that in asthmatics there is a measured increase in bronchial NO flux, while alveolar NO concentration is usually in the normal range [16–17]. However, more recent modeling by Shelley, et al. that include further lung partitioning[18] suggest that asthma control is better predicted by alveolar NO concentration than by airway flux and exhaled NO concentration. Thus, there is evidence that this multicompartment method upon further refinement will be extremely valuable in assessing disease severity and the efficacy of treatment.
Carbon monoxide (CO) is a marker of oxidative stress, produced by the stress protein heme oxygenase [(HO)-1], and also of inflammation [5]. Increased levels of CO have been measured in asthmatics [5, 19], but in general the elevation of CO in the breath of asthmatics compared to normal subjects is less than that of NO. Although the effect of steroid treatment on exhaled CO in mild asthmatics is negligible, when acute exacerbation of asthma occurs, CO levels increase and are reduced following corticosteroid treatment [5]. For patients with COPD, carbon monoxide may also be a useful indicator of disease, except for those COPD patients who are smokers as smoking causes high breath CO [5]. In a recent review paper, Gajdócsy and Horváth [20] report that studies that show that exhaled CO is increased in inflammatory airway diseases, although its usefulness as a biomarker of airway diseases is still open and further research is needed.
Carbon dioxide (CO2) measurements provide two potential benefits for modeling NO and CO. The dynamics of CO2 concentration in exhaled breath can be used to determine dead space volume. These data can then be used to refine the number of airway turnovers for identification of the appropriate interval for making FENO measurements as input to the physiologic models. Potentially more important, however, is that the physiologic dead space measurements may reflect air trapping and be a useful measure of disease activity.
The ARI system is based on tunable infrared laser differential absorption spectroscopy (TILDAS), a sensitive detection method for many small molecules, including NO, CO, nitrous oxide (N2O), and CO2. Infrared absorption is an absolute technique whereby the concentration of the trace gas can be obtained from fundamental molecular parameters (line strengths, broadening coefficients, partition functions) and physical measurements (sample pressure, temperature, and absorption path length). The TILDAS method can thus be used without reliance on calibration cylinders or permeation sources which may vary with time, and are expensive to obtain and maintain.
The ARI laser systems are based on quantum cascade infrared lasers (QCLs) that operate near room temperature, without the need for cryogens. Combining thermoelectrically cooled (TE) detectors with TE cooled lasers yields a fully noncryogenic system. The ARI QCL system achieves fast response with a multipass sampling cell of small volume (0.5 l) and long pathlength (76 m) for high sensitivity. These characteristics of the system are critical to measurement strategies in the study of NO and CO formation and exchange in the different regions of the respiratory system, which may lead to improved models of exchange dynamics in the respiratory airways.
2. Methods
2.1. Instrumentation
We have developed a fully noncryogenic laser based system for measuring gaseous components of exhaled breath. The state of the art laser based instrument was deployed at medical clinics and operated by nurses. The system was controlled by persons untrained in laser systems and spectroscopy for approximately 16 months. The breath analysis instrument simultaneously measures NO, CO2, CO, and N2O at multiple flow rates to investigate the dynamics of the components in airways. The overall system consists of two compact quantum cascade laser instruments and a multi-flow sampling manifold. All of the components, including a vacuum pump and water cooling circulator, are mounted in a single rack for portability. A laptop computer with wireless capability is used to operate the laser instruments and the breath analysis software interface. The sampling pump (Variac dry scroll IDP-3) provides sub-second time response.
The entire system can be turned on and initiated to take baseline data automatically without operator intervention. We have written a breath analysis software interface to collect patient information and automatically carry out a series of breath tests at four different exhalation flow rates. This was critical for allowing nurses to perform the breath testing independent of scientists. In the following sections we will give a brief description of the main components of the system. Further details of the instrument have been given previously [21].
2.2. Compact Quantum Cascade Laser Instrument
There are two compact quantum cascade laser (QCL) instruments which function in series in the ARI breath analysis system. The optical design and performance of the ARI compact QCL has been described in detail previously [21–22] and will only be described briefly here. Each compact system is based around a pulsed distributed feedback (DFB) QC laser (Alpes Laser) and a thermoelectrically cooled detector (Vigo). There is a pulsed QCL that operates at 1900 cm−1 for NO and CO2 detection in one system and a 2190 cm−1 laser for CO and N2O monitoring in the second system. We obtain precisions of 0.5 ppb Hz−1/2 for NO, 0.8 ppb Hz−1/2 CO, and 0.8 ppb Hz−1/2 N2O. The sensitivity is sufficient and necessary for breath analysis over the range of the exhalation rates. During the testing the instrument monitored the breath components in real time at 10 sec−1 data rate. Each compact QCL instrument has dimensions of 17″(W} × 24″(D) × 10.5″(H) and weighs 25 kg.
2.3. Exhaled Breath Sampling system
The multiple flow sampling system for breath analysis was described previously[21]. There are four breath exhalation flows (0.6, 3, 6, and 20 L/min) employed. Each flow is set by an orifice selected to obtain the desired flow rate at an expiratory resistance between 5 and 13 cm H2O. The minimum resistance of 5 cm H2O is recommended to close off the nasal plenum[23] and the upper limit was selected to keep within the comfortable range for most individuals.
We have designed an automated system of flow selection which uses a 5-way Gatlin-shaped unit (Hans-Rudolph) with four inflatable balloon valves. The three higher flow rates are selected with this unit while the lowest flow (0.6 L/min) uses a secondary sampling path with small diameter tubing. The latter was necessary to obtain reasonable time response even at the low flow rate.
The patient breathes into the system by means of a nonrebreathing valve (NRV) in a tee configuration with a bacterial/viral mouthpiece filter. The NRV has two one-way valves. The patient inhales air through one of the one-way valves with an NO scrubber attached, and the exhaled air goes into the sampling system through the other valve. The latter prevents the patient from inhaling air from the sampling line.
The ARI breath analysis system was developed for routine operation by medical personnel. A key tool necessary to place the state-of-the art laser system into the hands of nurses and other non-technical persons was a new software interface, Puffin, which was designed to control the QCL instruments and all aspects of the breath testing. Puffin is operated from a laptop computer which is interfaced with the instrument computers via a wireless router. It is used for patient data input and selection of measurement protocol and flows. Puffin performs the data acquisition and storage, and provides a visual interface to help the patient perform the breath maneuvers. The visual interface gives real-time feedback on the exhalation flow and its relationship to the target flow. The patient uses this information to maintain the target flow for the duration of the exhalation.
2.4. Measurement Protocol
The measurement protocol was to collect three breath tests at each of four expiratory flow rates (0.6, 3, 6, and 20 L/min) for each patient. The patient exhales at the target flow for a set time period: 30 sec for 0.6 L/min; 20sec for 3 and 6 L/min; and 8 sec for 20 L/min. Prior to measurements all patients were presented with and signed consent forms. In addition to the exhaled breath tests, spirometry tests of lung capacity, and either blood samples (adults) or nasal swabs (children) were collected. All protocols and procedures had approval from Fallon Clinic IRB.
2.5. Clinic tests
Clinic tests were carried out between November 2008 and April 2010 at two Fallon Clinic facilities in Worcester, Massachusetts. In general, adult measurements were conducted in the Pulmonary Department at the Worcester Medical Center and pediatric patients were seen at the Fallon Clinic Plantation Street Pediatric Department. The breath analysis system was operated by Fallon Clinic research nurses with occasional support from Aerodyne Research scientists.
We collected breath data from adult asthmatics and COPD patients, pediatric asthmatics and allergic rhinitis patients, and both adult and pediatric controls. A total of 173 patients at 243 visits participated, with some asthmatics seen at two visits. Of the pediatrics patients in the study, 43% were female and 57% male. There were 72% female and 28% male adults in the study. The distribution of patients by health category and the percentage of visits that gave useable breath data (i.e., ‘analyzed’ visits) is given in table 1. Each pediatric patient’s asthma was classified based on frequency of symptoms, patient medications, and pediatrician diagnosis. Allergic rhinitis patients were identified by a diagnosis in the patient’s medical record by his/her physician based on symptoms, treatment, and/or allergy testing. There were two main difficulties that led to data being deemed unacceptable. First, there were patients who simply were too sick to be able to control their breathing well enough to complete the tests. The second was problems with the sampling system (e.g. valves either not opening or not closing). Overall, 73% of visits could be usefully analyzed.
Table 1.
Distribution of patient visits by patient health category.
| Patient health category | Number of Visits | Percent of visits analyzed, % |
|---|---|---|
| COPD exacerbation | 35 | 60 |
| Adult asthma exacerbation | 21 | 71 |
| Ped. asthma exacerbation | 20 | 85 |
| Pediatric control | 20 | 80 |
| Ped. allergic rhinitis | 20 | 80 |
| Ped. Intermittent/mild asthma | 20 | 60 |
| Ped. Moderate/severe asthma | 20 | 85 |
| Adult control | 20 | 60 |
| COPD exacerbation follow-up | 27 | 70 |
| Adult asthma exac. follow-up | 20 | 80 |
| Ped. asthma exac. follow-up | 20 | 85 |
3. Results
3.1 Analysis method
We conducted the breath tests at four exhalation flow rates that spanned from 0.6 to 20 liters per min (L/min). This protocol provides data over a flow range suitable for inclusion in models of NO dynamics in the respiratory system. The American Thoracic Society and the European Respiratory Society (ATS/ERS) standard exhalation flow rate of 50 ml per sec (ml/sec), or 3L/min,[23] was included as a target flow to be useful for comparison with data sets from other research groups.
During each exhaled breath we simultaneously measure four trace gas concentrations, exhalation flow rate, and expiratory pressure. An example of a simultaneous data set collected from a male pediatric asthmatic patient, age 16, is shown in figure 1. After completion of each breath maneuver, the valve on the 20 L/min flow path is opened to facilitate removal of residual breath sample in the system before the next test. We do not include this post-maneuver data in figure 1 as it is not representative of normal exhalation behavior. While plateaus in NO and N2O are attained, both CO and CO2 continued to increase during exhalation. Although we expect to see a plateau in NO, we have observed variability in the shape of the profile of exhaled N2O.
Figure 1.
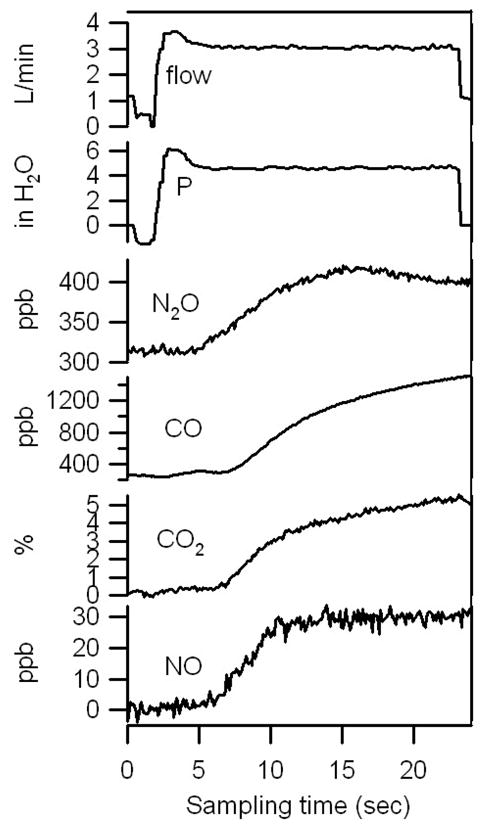
Breath data from and male asthma patient, age 16, on aerosolized steroid treatment.
Each series of trace gas profiles was analyzed to determine NO, CO, N2O and CO2 levels. As discussed by Punkett et al.[24], the analysis method can impact the result of the two-compartment model with axial diffusion. Our goal is to analyze the approximately same volume of exhalation for all flows. The number of airway volume turnovers examined might differ from one subject to the next due to the size of the individual’s airway volume. But for a given subject, the analysis addresses the same volume or volume turnovers for all flows, taking into account the exhalation flow rate and the instrumental delays. Puckett et al. [24] found that for exhalation flows of 3 and 6 L/min, whether one used a time interval or volume interval analysis did not affect the calculated plateau concentration. But because it does affect the determined exhaled mixing ratio at higher flow rates, consideration of the analysis volume is important. The analysis method was designed to also be in compliance with the ATS recommendation for analysis of 3 L/min data (i.e., average the first 3 seconds of the 3 L/min data plateau).[23] Finally, we also accounted for the delay and response time of our system (2.7, 1.5, and <1 sec for 3, 6, and 20L/min, respectively) due primarily to the size and length of the sampling system.
For analysis of NO and CO2, the species measured by the first instrument in the system, we chose a starting volume similar to that in Puckett et al. [24]. For 3L/min the region starts approximately 5 sec after breath flow, or ~8 sec including delay and response time. For the 6 and 20 L/min tests, we analyze after 5 and 1.7 sec, respectively. The duration of the analysis region is kept at 3sec for the 3L/min tests to keep in conformance with the ATS recommendations [23]. These analysis periods therefore correspond to a start at ~265ml after exhalation onset and continue for another ~150 ml. For 6 L/min, we start at 3 sec from start (~300 ml) and have an analysis region of 3 sec, or 300 ml. For 20 L/min we start at ~1sec after exhalation start, or ~330 ml, and continue for ~2.2 sec, or another 666ml. The 20 L/min analysis region is longer with respect to total volume because a concern was that if too short a time period was chosen, additional error would be introduced.
The CO and N2O trace gases in the same exhaled air volumes were analyzed. Because these species were measured with the second QCL instrument with respect to the sampling line flow, the additional one second delay was accounted for in the determination of analysis region.
3.2. Exhaled Breath Results from 3 L/min data
The nitric oxide and carbon monoxide levels of all of the asthmatics and controls in the study are compared by patient type in figure 2. We have excluded CO data from smokers in the analysis because smoking results in very high exhaled CO.
Figure 2.

Exhaled NO, CO and N2O from asthmatics and controls by health status from 3L/min exhalation tests. For each health category, the median is shown with 25th and 75th quartile. Each circle is the average of an individual’s tests (a) pediatric patients (b) adults.
The first observation one can make is that there is significant variability within a given health category. The variability in a category is a true variability from one patient to the next and not a measurement error. The variability, or error, for a given patient/patient visit is given in table 2. The variability between tests for a particular subject is small but larger than the instrumental noise (see table 2). We also calculate the average ratio of the variability (σ) to the mean mixing ratio for each subject and visit. We have not included N2O in the table because exhaled N2O profiles sometimes vary from test to test. Hence the standard deviation of N2O from test to test is not easily defined.
Table 2.
Comparison of standard deviation of test results and instrument precision.
| Breath Gas | Average σ per subject | Average (σ/mean mixing ratio)×100 | Instrumental noise a |
|---|---|---|---|
| NO | 2.1 ppb | 9.7% | 0.2 ppb |
| CO | 117 ppb | 6.5% | 0.6 ppb |
| CO2 | 0.4 % | 8.5% | 0.06 % |
instrumental noise over the integration time of the measurement
The distribution of pediatric and adult patients within a category is compared in figure 2a and b, respectively. In both parts a and b of the figure, we show for each category each subject’s average exhaled value, as well as the quartiles of all subjects in that category (median and 25th and 75th quartiles). There is a range of values within each health category. If we compare the NO results for the pediatric patients in figure 2, we find that the controls and children with allergic rhinitis had lowest median NO. The moderate or severe asthmatics had the highest NO. Pediatrics in asthma exacerbation had lower breath CO and N2O which was also the case at their follow-up visits. For the adult controls and asthmatic groups, there is little difference between the median NO levels, although the patients in exacerbation had higher 75th quartile the post-exacerbation data had a lower top quartile and tighter range in NO. Also similar to the pediatrics, the asthmatic adults at follow-up visits had lower breath CO.
The nitric oxide, carbon monoxide, and nitrous oxide levels of the chronic obstructive pulmonary disease (COPD) group are compared by patient type in figure 3. In this graph we show again the median with the 25th and 75th quartiles. Each individual marker is the average value of all tests of a subject’s visit. A large range was observed for each of the measured exhaled gases. This is true for the measurements both during exacerbation and those at the follow-up visit. The CO data from smokers (5 COPD patients) are not included in the analysis. We note that of the remaining 30 COPD patients that participated in the study, 29 were ex-smokers and only one was a non-smoker.
Figure 3.

Exhaled NO, CO and N2O from COPD patients, 3L/min tests. The median is shown with 25th and 75th quartile. Each circle is the average of an individual’s tests.
An important parameter collected from the patients in the study was their smoking status. Exhaled carbon monoxide is highly elevated in the breath of smokers. We observed exhaled CO of over 10 ppm from smokers in this study. We have excluded smoker CO data and statistics in figures 2 and 3 as the data of just a few patients clearly skewed the overall statistics.
There have been studies that have shown lower NO in the exhaled breath of smokers as compared to that of nonsmokers [25–27]. In our study the NO levels of the smokers were within the range of the nonsmoker data. We therefore did not exclude them from the NO data and statistics presented in figures 2 and 3. However, we examine here the impact on the data if the smokers in the study were excluded from the NO statistics.
We find that if we exclude the smoker data from the NO statistics of the groups to which they belong, we observe slightly lower median and quartiles for these groups. For the group of adult controls, we obtain exhaled NO of 20.2 (16.2 – 44.5) ppb when excluding the smokers, where we express here the median (25th – 75th quartiles) of the group. This is compared to 18.8 (14.3 – 41.8) ppb NO if the two smokers are included in the NO statistics. Similarly, for the adult asthmatics group we find that including the smokers decreases the medians, etc. For example, if we exclude the smokers in the analysis of exhaled NO of adult asthmatics during exacerbation, we find a median NO level of 18.4 (12.6 – 51.1) ppb as compared to 14.7 (8.4 – 41.9) ppb when including the three smokers. A similar change was also observed in the post exacerbation analysis of the adult smokers. Although our smoker data is limited, it appears consistent with previous studies [25–27].
3.2.1. Comparison of Asthmatic Exacerbation and Post-exacerbation Exhaled Breath Gases
We have collected exhaled breath data from patients during an asthma or COPD exacerbation clinic visit and at a subsequent follow-up visit. We can analyze the data either by examining the overall group results or by comparing an individual patient’s visits. As shown above there is a large range of levels within a chosen health category. If we compare results of exacerbation and follow-up visits for individual patients, we find that for many of the asthmatics, exhaled nitric oxide was higher during the exacerbation event than at the follow-up visit. This is similarly true for CO, although not always. There were also patients who had higher exhaled NO at their follow-up visit.
We have studied the distribution of the changes in NO, CO and N2O between the exacerbation and follow-up visits. To do this we have calculated the differences in the exhaled breath components for the two visits and determined the distributions of these differences. Histograms of the distribution of the differences for asthmatics are shown in figure 4. In each histogram, the delta value is the exacerbation minus follow-up visit.
Figure 4.

Distribution of changes in NO, CO and N2O for asthma exacerbation patients for exacerbation visit and follow-up visit, where Δ = exacerbation visit − follow-up visit..
For the asthmatics, the NO level at exacerbation minus that at the follow-up visit generally fell near or above zero. There were also three patients who had significantly higher NO at their second visit. For CO and N2O, we obtained a distribution of patients both above and below zero. Although we expected NO and CO would be elevated during an asthma exacerbation, we sometimes observed increases in the NO and CO biomarkers at the return visit when the patient was thought to be healthy. To try to understand this we compare these results with the results of more traditional lung measurements, spirometry tests. Spirometry tests were conducted at each visit after the exhaled breath tests with the ARI system. We compare the delta NO (i.e., visit 1 minus visit 2) for asthmatics against changes in FEV1 (forced exhaled volume in 1 second) in figure 5. The FEV1 is expected to increase with improved health and improved asthma control, while the NO level is expected to decrease. Our exhaled breath data appears consistent with the spirometry data. The “healthy” follow-up visit did not necessarily mean that the patient’s asthma was under control. In figure 5 the pediatric and adult asthmatics are discriminated by color. The linear fits to all the data, to just the adults, and to only the pediatrics are given by the red, blue and green lines, respectively. We note that the one patient with an increase in NO by ~100 ppb was not included in the fits as it is clear that another factor must have been involved.
Figure 5.

Comparison of ΔFEV1 to ΔNO for pediatric and adult asthmatics.
 linear fit to both peds and adult asthmatics;
 fit to adult data;
 fit to pediatric data
A comparison of the change in NO with the patient’s change in forced vital capacity (FVC), another indicator of lung health obtained from the spirometry tests, yields similar correlations. Patients who had higher NO at their follow-up visit generally had lower FEV1 and FVC, indicating that their respiratory condition was worse than during the exacerbation. The second visit was typically scheduled 2–4 weeks after exacerbation with the expectation that the patient’s health be improved at that time. But that does not appear to be the case, as indicated by both the exhaled breath and the spirometry measurements. There are also anecdotal notes by the administering nurses that patients sometimes did not appear healthy or with improved asthma control at their second visit.
3.3 Analysis and Modeling of Exhaled Breath Components
Exhaled nitric oxide can originate from various sites in the respiratory system. Simple models of the respiratory system differentiate between airway sources (proximal source) and alveolar sources (peripheral sources) of NO. The airway gradually branches toward the alveoli, where the alveolar region is in fast equilibrium with the blood supply. The simplest model of the lungs is the “ball on stick” model where the alveolar is represented by a “ball” and the airway by a “stick”. But this model is too simplistic and does not represent the realistic complexity of the respiratory system sufficiently.
A slightly more complex model of the respiratory system is the two compartment trumpet model. The trumpet model describes the lungs as two regions: the proximal (airway) and peripheral (alveolar) regions. It portrays the airway geometry as being a trumpet-like shape with the larger cross-sectional area at the peripheral region. Alveolar air contains NO at a constant steady-state concentration (CANO). This alveolar air moves to the mouth and picks up NO in the airway as it moves through it. In the airway NO is added at a rate equal to the wall flux of NO, JawNO. This is considered to be equal to the maximum airway flux, J′awNO, at the assumed range of flow rates. The trumpet model with axial diffusion (TMAD) goes slightly further and includes axial diffusion of NO as described by Fick’s 1st law of diffusion. This additional component of the model allows for some diffusion of NO from the airways to the alveolar region. Details of the model and associated equations are found in Condorelli et al [28].
The result of the TMAD is that if one plots the elimination rate of NO against the flow rate, the model predicts a linear relationship between these two parameters. The elimination rate of NO is defined as the product of the flow rate and the exhaled mixing ratio of NO. From the linear fit of the data collected over a range of flows, one obtains CANO and J′awNO from the slope and intercept of the fit. From the model one obtains [28]:
where S is the slope and I is the intercept of the fit.
These slope and intercept equations of the model assume the following approximation of the analytical function f for expiratory flow rates in the range of 100 to 250 ml/s:
We have analyzed exhalation data collected at 3, 6, and 20 L/min; i.e., a range of 50 to 333 ml/sec. The data from 0.6 L/min flow rate was not included because it did meet the criteria of the model. The flows in our experiments extend both below and above the range of 100 to 250 ml/sec value where the function, f, of the model is approximated by the above linear equation (see Condorelli, et al.[28] for details). If we look at the function over the full range of our experiments, it is clear that the function is not simply a linear function of the expiratory flow. We have calculated a new linear approximation for f which extends to cover the full range of flows in our data. We obtain the following new approximation:
This new approximation has only a small effect on the calculation of CANO and J′awNO as compared to the use of the original Condorelli’s equations. New equations for CANO and J′awNO are:
We analyzed all acceptable data sets using the above method of fitting elimination rate of NO versus flow rate. An example of one of these analysis plots is shown in figure 6, with data from a 40 year old male asthmatic at his follow-up visit. We rejected any results which yielded an unrealistic negative value of CANO. In addition, we required that a data set have a minimum of 4 data points for it to be analyzed.
Figure 6.

The NO elimination rate as a function of exhalation rate for adult asthmatic at a follow-up visit. The solid line is the least squares linear fit to the data.
As with the exhaled NO distributions, there are ranges in both CANO and J′awNO. The model results are grouped by patient type in figures 7 and 8 with median, 25th and 75th quartile for each group. For the pediatric patients (figure 7) we observe that the maximum airway fluxes (J′awNO) were highest for the moderate and severe asthmatics and asthmatics during asthma exacerbation. For these patients there was more airway inflammation causing higher production and flux of NO into the airways. For pediatric asthmatics who were seen during exacerbation, we observed in general a decrease in the airway NO flux at the follow-up healthy visit. A pattern in the alveolar concentration of NO is more difficult to discern. In general, those with asthma exacerbation had higher CANO which decreased at the follow-up visit.
Figure 7.

Comparison of CANO and J′awNO by patient type for Pediatric patients. The median (solid circle) and 25th and 75th quartiles (bottom and top of boxes) are given for each patient group.
Figure 8.

Comparison of CANO and J′awNO by patient type for Adult patients. The median (solid circle) and 25th and 75th quartiles (bottom and top of boxes) are given for each patient group.
The results of modeling the adult patient data is shown in figure 8. For the adult patients, the maximum airway fluxes of NO were higher in patients having an asthma exacerbation, with a range of values obtained. As with the pediatrics, this implies that there is more airway inflammation causing higher production and flux of NO into the airways during exacerbation. The flux was lower, with smaller range in values, for the post-exacerbation asthmatics. The COPD patients did not follow this pattern. We also observe that the adult asthmatics and COPD patients have higher levels of NO in the distal or alveolar regions than did the adult controls. And the COPD patients, both during and post exacerbation had the highest levels of alveolar NO (CANO).
We can compare CANO and J′awNO values from the exacerbation and post exacerbation visits of individual asthmatic and COPD patients. Histograms of the distribution of ΔCANO and ΔJ′awNO for asthmatics (adult and pediatric) are shown in figure 9, where Δ = (exacerbation visit – follow-up visit). We observe that most of the asthmatics had a positive ΔJ′awNO value; that is, the patient had a higher maximum airway NO flux during the exacerbation than at the patient’s post-exacerbation visit. The distribution of changes in the alveolar NO concentration, ΔCANO, include both positive and negative values. There were more patients with a decrease in CANO at the follow up visit, but almost as many of the patients in the group had an increase in alveolar NO (ΔCANO<0).
Figure 9.

Distribution of ΔCANO and ΔJ′awNO for asthmatic patients, where Δ= exacerbation visit -post-exacerbation visit. Note that in 9a, one patient with ΔCANO of −34 ppb is not shown.
The changes in CANO and J′awNO for COPD patients who were tested during exacerbation and at a follow-up visit are given in figure 10. As reflected in the results in figure 8, there were more patients with a higher airway flux at the post exacerbation visit than at their exacerbation visit. Similarly, more COPD patients had higher alveolar NO on the second visit than had a decrease in CANO. The processes associated with asthma and COPD exacerbation are different. Further studies are needed to better understand the mechanisms of nitric oxide exchange dynamics in these respiratory conditions.
Figure 10.

Distribution of ΔCANO and ΔJ′awNO for COPD patients, where Δ= exacerbation visit -post exacerbation visit.
4. Discussion
4.1 Comparison of standardized flow( 3 lpm) data with literature values
An exhalation flow rate of 3 lpm (50 ml/s) was established by the American Thoracic Society (ATS) and the European Respiratory Society (ERS) as a “standard” flow for the measurement of exhaled nitric oxide [23]. The objective was to have all studies use the same flow to allow comparisons of results obtained by different research groups. Because the measurement of exhaled NO is dependent on exhalation rate, having a standard flow is critical for comparisons of exhaled NO from patient groups collected by various researchers.
We reported here on one of the first larger studies of exhaled nitric oxide measured with quantum cascade laser instrumentation. Most other large scale studies have deployed either a chemiluminescence or electrochemical instrument to measure NO. In 2008 Grob and Dweik provided a review of published data since the standardized methodology for NO measurements was introduced [29] They reported that despite the guidelines, there remains a wide range of NO reported for healthy and asthmatic patients. We compare our results to the data in this review as well as several more recently published studies.
In our study healthy children had a median exhaled NO concentration of 11.5 ppb with 25th and 75th quartile of 7.8 and 26.4 ppb, respectively. This is in very good agreement with Grob and Dweik [29]. They found the geometric mean for exhaled NO to range from 5 to 14 ppb in healthy children [see [29] and references therein]. Our results also agree with reported values of several more publications not included in their review, including Baraldi et al.[30], Puckett et al.[24, 31–32], and Paraskakis et al.[33], with mean or median NO values between 5.3 and 10.4 ppb reported for healthy children.
The comparisons are also very good if we look at results of studies of exhaled NO from adults. Most of these studies again collected data with chemiluminescence and electrochemical instruments. For healthy adults we obtained a median exhaled NO of 18.8 ppb with 14.8 and 41.8 ppb as 25th and 75th quartiles, respectively. This compares well with the geometric mean reported by Grob and Dweik from the published literature [29], a range of 10 to 33 ppb in healthy adult controls. In all studies including ours, a fairly wide range of exhaled NO is reported for patients within a particular health status group. This likely reflects in large part the variability between individuals, perhaps due in part to confounding factors, such as age, smoking status, gender and height.
4.2 NO exchange dynamics model results
We can compare the model results of our study to other published efforts to model NO exchange dynamics. We focus this comparison to studies that applied the TMAD model or a very similar model to their exhaled nitric oxide breath data. In table 3 results from this study and four other modeling efforts are given. Of the latter, two had adults while the other two focused on children. Condorelli [28] and Kerckx [34] both used a trumpet model analysis for exhaled NO, but Kerckx did not report the airway NO flux. and Puckett [32] and Paraskakis et al.[33] used TMAD or a similar model by Tsoukias and George [15], respectively.
Table 3.
Comparison of model results with other studies.
| CANO, ppb | J′awNO, pl/s | Reference | |
|---|---|---|---|
| Adult control | 1.77 (0.51–3.10) | 1199 (455–3295) | this study |
| Pediatric controls | 4.14 (0.89–6.97) | 725 (173–3470) | |
| Ped. Allergic Rhinitis | 3.50 (0.46–19.1) | 1140 (52 – 4444) | |
| Ped. Intermittent/Mild Asthma | 4.85 (0.26–11.5) | 1223 (105–3996) | |
| Ped. Moderate/Severe Asthma | 3.80 (0.51–12.0) | 2210 (464–6364) | |
| Ped. Asthma Exacerbation | 5.45 (0.21–8.17) | 1699 (80–4269) | |
| Ped. Asthma Post-exacerbation | 4.44 (2.02–8.15) | 1229 (132–3807) | |
| Adult Asthma Exacerbation | 2.64 (0.25–5.67) | 1330 (336–6076) | |
| Adult Asthma Post-exacerbation | 4.98 (0.57–38.1) | 651 (87–2854) | |
| COPD Exacerbation | 4.77 (0.34–14.1) | 1062 (219–3068) | |
| COPD Post-Exacerbation | 5.95 (0.16–17.9) | 1353 (309–3955) | |
| Adult controls | 0.66 ± 0.98 | 770 ± 470 | Condorelli[28] |
| Controls, Adults | 2.2 ± 1.5 | Kerckx[34] | |
| Asthmatics, Adults | 1.5 ± 1.8 | ||
| FENO≤350 | |||
| FENO>50 | 2.1 ± 3.3 | ||
| Normal, Peds. | 1.63 (0.44 – 3) | 480 (196 – 1913) | Paraskakis[33] |
| Asthmatics, Peds. | 2.22 (0.44 – 6.6) | 1230 (204 –9236) | |
| Nonasthmatic, atopic, Peds. | 1.21 (0.03 – 2.85) | 1225 (486 – 4119) | |
| Non asthmatic non-atopic controls, Peds. | 1.5 (0.1 – 2.2) | 700 (100 – 1400) | Puckett[32] |
| ICS-treated asthma, Peds. | 1 (0.006 – 5.1) | 1100 (100 – 14000) | |
| ICS naïve asthma, Peds. | 1.5 (0.02 – 13.4) | 2800 (200 – 17000) |
We will look at the controls and asthmatics results separately. Our adult control results for CANO and J′awNO compare well with the other studies. The alveolar concentration is very similar to the other study results while the median adult J′awNO is somewhat higher but within the range of other studies. Pediatric controls in our study had higher median CANO, but J′awNO very similar to the other reports.
If we compare our results to those of Paraskakis et al. [33], we first note that the average CANO for adult and pediatric controls in our study is in line with those of Paraskakis et al. The maximum airway fluxes, J′awNO, that we obtain are higher on average, but both our study and that of Paraskaskis have J′awNO values that cover a wide range. Children with allergic rhinitis in our study have J′awno comparable to that of nonasthmatic atopics in the above study, but higher alveolar NO. We can also compare our results to another study by Puckett et al. [32] where children were again the focus. In this study the authors separate their pediatric subjects into three groups: non asthmatic non-atopic controls; inhaled corticosteroids (ICS)-treated asthmatics; and ICS naïve asthmatics. Similar to our results, Puckett et al [32] obtained a range of values for each parameter within each category of subjects. ICS treatment primarily targets the proximal airways. One of the observations of Puckett’s study [32] is that ICS treatment is associated with a lower FENO at 50ml/s exhalation rate, and lower J′awNO. Comparing this to our results we also found J′awnNO to be higher for the pediatric asthmatics in exacerbation (i.e., not controlled), than for the asthmatics on their follow-up visit after treatment. And those with moderate or severe asthma also had amongst the highest values of J′awnNO.
We can draw some general conclusions based on our model results. For the group of pediatric patients, the maximum airway flux, J′awNO, was higher in moderate and severe asthmatics and during asthma exacerbation. This implies that more airway inflammation was causing higher production and flux of NO into the airway. When the pediatric patients returned for their follow-up visit several weeks after the exacerbation event, presumably with their asthma under better control, we saw in general a decrease in the airway flux. For adult patients, the difference between the fluxes for the different health categories was less clear. For adult patients, the maximum airway fluxes of NO were higher in patients having an exacerbation, with a range of values obtained overall. The fluxes decreased and had a smaller range for the post exacerbation asthmatics. This was not true for the post exacerbation COPD patients. The latter showed an overall slight increase in NO airway flux compared to during exacerbation. Also as Paraskakis et al noted in their study [33], no correlation between CANO and J′awNO is evident.
The alveolar concentration of NO did not follow clear patterns. For pediatric asthmatics, the alveolar NO was higher during the exacerbation than at the follow-up visit. The adult asthmatics and COPD patients had higher CANO than did the controls. But a group’s post-exacerbation alveolar CO was a little higher than at the exacerbation visit. In the case of the COPD group, the overall alveolar NO concentrations were higher at both visits in comparison with the other adult groups.
The application of the TMAD model provides information about the dynamics of nitric oxide in the respiratory system. The use of the model to analyze larger and diverse groups of patients will lead to refinements of the model; will help to better determine optimal exhalation flow rates for the model; and increase the understanding of the roles of the alveolar and airway regions of the lungs in respiratory diseases including asthma and COPD. It should also be possible to extend the trumpet model to other exhaled breath components that have sources in both the alveolar and airways. Of those which were measured in our study, CO and CO2 have their primary source in the alveolar region while N2O profiles indicate that it may have multiple source regions. N2O has interesting, variable exhalation profiles that require further study before application of the TMAD model to the dynamics of this exhaled trace species.
Acknowledgments
The Authors would like to thank Ryan McGovern, Daniel Glenn, and Frank Hills for their assistance in the construction of the ARI breath analysis system, and Janet Guilbert and Diane Gannon of Fallon Clinic for their collection of the breath samples from patients at the clinic. This work was supported by NIH SBIR grant 5R44HL081951.
References
- 1.Wood LG, Gibson PG, Garg ML. Biomarkers of lipid peroxidation, airway inflammation and asthma. Eur Respir J. 2003;21:177–186. doi: 10.1183/09031936.03.00017003a. [DOI] [PubMed] [Google Scholar]
- 2.Puckett JL, George SC. Partitioned exhaled nitric oxide to non-invasively assess asthma. Respiratory Physiology & Neurobiology. 2008;163:166–177. doi: 10.1016/j.resp.2008.07.020. [DOI] [PMC free article] [PubMed] [Google Scholar]
- 3.Balmes J, Becklake M, Blanc P, Henneberger P, Kreiss K, Mapp C, Milton D, Schwartz D, Toren K, Viegi G. American Thoracic Society Statement: Occupational Contribution to the Burden of Airway Disease. Am J Respir Crit Care Med. 2003;167(5):787–797. doi: 10.1164/rccm.167.5.787. [DOI] [PubMed] [Google Scholar]
- 4.Kharitonov SA, Barnes PJ. Exhaled markers of pulmonary disease. Am J Respir Crit Care Med. 2001;163:1693–1722. doi: 10.1164/ajrccm.163.7.2009041. [DOI] [PubMed] [Google Scholar]
- 5.Paredi P, Kharitonov SA, Barnes PJ. Analysis of Expired Air for Oxidation Producs. Am J Respir Crit Care Med. 2002;166:531–537. doi: 10.1164/rccm.2206012. [DOI] [PubMed] [Google Scholar]
- 6.Malmberg LP, Pelkonen AS, Haahtela T, Turpeinen M. Exhaled nitric oxide rather than lung function distinguishes preschool children with probable asthma. Thorax. 2003;58:494–499. doi: 10.1136/thorax.58.6.494. [DOI] [PMC free article] [PubMed] [Google Scholar]
- 7.Silkoff PE, Romero FA, Gupta N, Townley RG, Milgrom H. Exhaled nitric oxide in children with asthma receiving Xolair (Omalizumab), a monoclonal anti-immunoglobulin E antibody. Pediatrics. 2004;113:308–312. doi: 10.1542/peds.113.4.e308. [DOI] [PubMed] [Google Scholar]
- 8.Mahut B, Delacourt C, Zerah-Lancner F, De Blic J, Harf A, Delclaux C. Increase in alveolar nitric oxide in the presence of symptoms in childhood asthma. Chest. 2004;125:1012–1018. doi: 10.1378/chest.125.3.1012. [DOI] [PubMed] [Google Scholar]
- 9.Lious R, Lau LD, Bron AO, Radermecker M, Djukanovic R. The relationship between airways inflammation and asthma severity. Am J Respir Crit Care Med. 2000;161:9–16. doi: 10.1164/ajrccm.161.1.9802048. [DOI] [PubMed] [Google Scholar]
- 10.Wilson NM, Bridge P, Spanevello A, Silverman M. Induced sputum in children: feasibility, repeatability, and relation of findings to asthma severity. Thorax. 2000;55:867–874. doi: 10.1136/thorax.55.9.768. [DOI] [PMC free article] [PubMed] [Google Scholar]
- 11.George SC, Hogman M, Permutt S, Silkoff PE. Modeling pulmonary nitric oxide exchange. J Appl Physiol. 2004;96:831–839. doi: 10.1152/japplphysiol.00950.2003. [DOI] [PubMed] [Google Scholar]
- 12.Shin H-W, Condorelli P, George SC. A new and more accurate technique to characterize airway nitric oxide using different breathhold times. J Appl Physiol. 2005;98:1869–1877. doi: 10.1152/japplphysiol.01002.2004. [DOI] [PubMed] [Google Scholar]
- 13.Silkoff PE, Sylvester JT, Zamel N, Permutt S. Airway nitric oxide diffusion in asthma. Am J Respir Crit Care Med. 2000;161:1218–1228. doi: 10.1164/ajrccm.161.4.9903111. [DOI] [PubMed] [Google Scholar]
- 14.Tsoukias NM, Shin H-W, Wilson AF, George SC. A single-breath technique with variable flow rate to characterize nitric oxide exchange dynamics in the lungs. J Appl Physiol. 2001;91:477–487. doi: 10.1152/jappl.2001.91.1.477. [DOI] [PubMed] [Google Scholar]
- 15.Tsoukias NM, George SC. A two-compartment model of pulmonary nitric oxide exchange dynamics. J Appl Physiol. 1998;85:653–666. doi: 10.1152/jappl.1998.85.2.653. [DOI] [PubMed] [Google Scholar]
- 16.Lehtimaki L, Kankaanranta H, Saarelainen S, Hahtola P, Jarvenpaa R, Koivula T, Turjanmaa V, Moilanen E. Extended exhaled NO measurement differentiates between alveolar and bronchial inflammation. Am J Respir Crit Care Med. 2001;163:1557–1561. doi: 10.1164/ajrccm.163.7.2010171. [DOI] [PubMed] [Google Scholar]
- 17.Lehtimaki L, Kankaanranta H, Saarelainen S, Turjanmaa V, Moilanen E. Inhaled fluticasone decreases bronchial but not alveolar nitric oxide output in asthma. Eur Respir J. 2001;18:635–639. doi: 10.1183/09031936.01.00000201. [DOI] [PubMed] [Google Scholar]
- 18.Shelley DA, Puckett JL, George SC. Quantifying proximal and distal sources of NO in asthma using a multicompartment model. J Appl Physiol. 2010;108:821–829. doi: 10.1152/japplphysiol.00795.2009. [DOI] [PMC free article] [PubMed] [Google Scholar]
- 19.Zayasu KKS, Okinage S, Yamaya M, Ohrui T, Sasaki H. Increased carbon monoxide in exhaled air of asthmatic patients. Am J Respir Crit Care Med. 1997;156:1140–1143. doi: 10.1164/ajrccm.156.4.96-08056. [DOI] [PubMed] [Google Scholar]
- 20.Gajdócsy R, Horváth I. Exhaled carbon monoxide in airway diseases: from research findings to clinical relevance. J Breath Res. 2010;4(4):04702, 7. doi: 10.1088/1752-7155/4/4/047102. [DOI] [PubMed] [Google Scholar]
- 21.Shorter JH, Nelson DD, McManus JB, Zahniser MS, Milton DK. Multicomponent breath analysis with infrared absorption using room temperature quantum cascade lasers. IEEE Sensors. 2010;10:76–84. doi: 10.1109/JSEN.2009.2035764. [DOI] [PMC free article] [PubMed] [Google Scholar]
- 22.McManus JB, Shorter JH, Nelson DD, Zahniser MS, Glenn DE, McGovern RM. Pulsed quantum cascade laser instrument with compact design for rapid, high sensitivity measurements of trace gases in air. Applied Physics B. 2008;92(3):387–392. [Google Scholar]
- 23.American Thoracic Society and European Respiratory Society. ATS/ERS Recommendations for Standardized Procedures for the Online and Offline Measurement of Exhaled Lower Respiratory Nitric Oxide and Nasal Nitric Oxide. 2005. Am J Crit Care Med. 2005;171:912–930. doi: 10.1164/rccm.200406-710ST. [DOI] [PubMed] [Google Scholar]
- 24.Puckett JL, Taylor RW, Galant SP, George SC. Impact of analysis interval on the multiple exhalation flow technique to partition exhaled nitric oxide. Pediatric Pulmonology. 2010;45(2):182–191. doi: 10.1002/ppul.21182. [DOI] [PubMed] [Google Scholar]
- 25.Horvath IDLE, Kiss A, Balint B, Kharitonov SA, JBP Exhaled nitric oxide and hydrogen peroxide concentrations in asthmatic smokers. Respiration. 2004;71(5):463. doi: 10.1159/000080630. [DOI] [PubMed] [Google Scholar]
- 26.Louhelainen N, Myllärniemi M, Rahman I, Kinnula VL. Airway biomarkers of the oxidant burden in asthma and chronic obstructive pulmonary disease: Current and future perspectives. International Journal of COPD. 2008;3(4):585. doi: 10.2147/copd.s3671. [DOI] [PMC free article] [PubMed] [Google Scholar]
- 27.Maziak W, Loukides S, Culpitt S, Sullivan P, Kharitonov SA, Barnes PJ. Exhaled nitric oxide in chronic obstructive pulmonary disease. Am J Respir Crit Care Med. 1998;157(3):998. doi: 10.1164/ajrccm.157.3.97-05009. [DOI] [PubMed] [Google Scholar]
- 28.Condorelli P, Shin H-W, Aledia A, Silkoff P, George SC. A simple technique to characterize proximal and peripheral nitric oxide exchange using constant flow exhalations and an axial diffusion model. J Appl Physiol. 2007;102:417–425. doi: 10.1152/japplphysiol.00533.2006. [DOI] [PubMed] [Google Scholar]
- 29.Grob NM, Dweik RA. Exhaled nitric oxide in asthma: progress since the introduction of standardized methodology. J Breath Res. 2008;2:037002. doi: 10.1088/1752-7155/2/3/037002. [DOI] [PMC free article] [PubMed] [Google Scholar]
- 30.Baraldi E, Scollo M, Zaramella C, Zanconato S, Zacchello F. A simple flow-driven method for online measurement of exhaled NO starting at the age of 4 to 5 years. Am J Respir Crit Care Med. 2000;162:1828–1832. doi: 10.1164/ajrccm.162.5.2002014. [DOI] [PubMed] [Google Scholar]
- 31.Puckett J, Taylor R, Leu S-Y, Guijon O, Aledia A, Galant S, George S. Clinical patterns in asthma based on proximal and distal airway nitric oxide categories. Respiratory Research. 2010;11(1):47. doi: 10.1186/1465-9921-11-47. [DOI] [PMC free article] [PubMed] [Google Scholar]
- 32.Puckett JL, Taylor RW, Leu SY, Guijon OL, Aledia AS, Galant SP, George SC. An elevated bronchodilator response predicts large airway inflammation in mild asthma. Pediatric Pulmonology. 2010;45(2):174–181. doi: 10.1002/ppul.21172. [DOI] [PubMed] [Google Scholar]
- 33.Paraskakis E, Brindicci C, Fleming L, Krol R, Kharitonov SA, Wilson NM, Barnes PJ, Bush A. Measurement of Bronchial and Alveolar Nitric Oxide Production in Normal Children and Children with Asthma. Am J Respir Crit Care Med. 2006;174(3):260–267. doi: 10.1164/rccm.200506-962OC. [DOI] [PubMed] [Google Scholar]
- 34.Kerckx Y, Michils A, Van Muylem A. Airway contribution to alveolar nitric oxide in healthy subjects and stable asthma patients. Journal of Applied Physiology. 2008;104(4):918–924. doi: 10.1152/japplphysiol.01032.2007. [DOI] [PubMed] [Google Scholar]