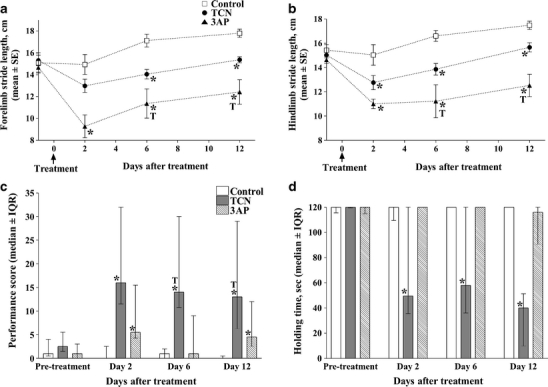
Fig. 3.

a Effects of TCN and 3AP + 3.5 h on forelimb stride length at different time points before (day 0) and after treatment. Data points represent mean±SEM. b Effects of TCN and 3AP + 3.5 h on hindlimb stride length at different time points before (day 0) and after treatment. Data points represent mean±SEM. c Effects of TCN and 3AP + 3.5 h on performance scores in the beam-walking test. Bars represent the median ± interquartile ranges. A higher score means a greater difficulty in performing the task. Animals were tested before (pretreatment) and at different time points after treatment at days 2, 6 and 12. Asterisk indicates a statistically significant difference from control (P < 0.05, Mann—Whitney U test). d Effects of TCN and 3AP + 3.5 h on holding time in the vertical grid test. Bars represent the median ± interquartile ranges of the holding time. On each day of assessment the test was carried out for a maximum time period of 120 s. Animals were tested before (pretreatment) and at different time points after treatment at days 2, 6 and 12. Asterisk indicates a statistically significant difference from control (P < 0.05, Mann—Whitney U-test). Adapted from [56]
