

Abstract
Parallel circuits throughout the CNS exhibit distinct sensitivities and responses to sensory stimuli. Ambiguities in the source and properties of signals elicited by physiological stimuli, however, frequently obscure the mechanisms underlying these distinctions. We found that differences in the degree to which activity in two classes of Off retinal ganglion cell (RGC) encode information about light stimuli near detection threshold were not due to obvious differences in the cells' intrinsic properties or the chemical synaptic input the cells received; indeed, differences in the cells' light responses were largely insensitive to block of fast ionotropic glutamate receptors. Instead, the distinct responses of the two types of RGCs likely reflect differences in light-evoked electrical synaptic input. These results highlight a surprising strategy by which the retina differentially processes and routes visual information and provide new insight into the circuits that underlie responses to stimuli near detection threshold.
Introduction
Behavior is guided by information encoded in the ensemble activity of diverse populations of neurons. The neural activity that forms the basis for visually guided behavior, for example, is distributed across ∼20 distinct classes of retinal ganglion cell (RGC) that differ in their morphology, central projections, and/or sensitivities to spatial, chromatic, and temporal features of light stimuli (for review, see Masland, 2001; Troy and Shou, 2002; Dacey and Packer, 2003; Wässle, 2004; Field and Chichilnisky, 2007).
Insight into the mechanisms that underlie distinct processing of sensory information by parallel circuits is frequently limited by the large number of sites at which such differences could originate. Differences in the functional properties of two classes of RGCs, for example, could reflect differences in (1) the photoreceptors from which light-evoked electrical signals originate; (2) the circuit or cellular properties of the interneurons through which excitatory and inhibitory signals propagate; and/or (3) intrinsic properties of the RGCs themselves.
Examining responses to light stimuli near absolute detection threshold circumvents several of the complexities that have hindered investigation of the origin of functional differences between parallel circuits. First, while many light stimuli elicit responses from a mixture of rod and several types of cone photoreceptors, only the homogenous population of rod photoreceptors responds robustly to dim light stimuli. Thus, by using just-detectable light stimuli, the origin of neural signals is constrained. Second, a circuit unique to mammalian retina (Fig. 1A) (Sharpe and Stockman, 1999; Bloomfield and Dacheux, 2001) is well suited to process and convey signals generated in a small fraction of rod photoreceptors. Late divergence of signals in this circuit is thought to limit the potential sites at which parallel processing could occur; in particular, because a single class of bipolar cell (the rod bipolar cell) provides the most sensitive readout of signals produced in rod photoreceptors, and rod bipolar cell responses are thought to be conveyed to the rest of the retina exclusively through the AII class of amacrine cell, differences in RGC activity elicited by signals traversing this circuit likely arise downstream of the AII amacrine cell. We exploited these features, and the ability to record from several identified classes of RGC simultaneously, to better understand the origin and potential impact of functional differences in the responses of two classes of RGCs to light stimuli near detection threshold.
Figure 1.

OffT and OffS RGCs exhibit distinct rates of AP generation in darkness and in response to dim flashes of light. A, Schematic of the mammalian retina; elements of the rod bipolar pathway are highlighted in gray. RB, Rod bipolar cell; AII, AII amacrine cell. B, Patterns of APs elicited in neighboring OffS and OffT RGCs by a family of brief (10 ms) increases in light intensity from darkness. Top, Superposition of five consecutive responses to each of three flash strengths. Bottom, Rate of AP generation as a function of time; APs were binned, summed across all identical trials, and divided by the bin width (5 ms) for each cell and flash intensity. Flash time indicated by vertical dashed line. C, Summary of the peak and baseline (dark) rate of AP generation in nearby OffS and OffT RGCs. Data from cells recorded simultaneously are linked by gray lines (n = 11 pairs). D, Maximum intensity projection of adjacent OffT and OffS RGCs recorded simultaneously. Scale bar, 20 μm.
Materials and Methods
Tissue preparation.
Mice (C57BL/6, 5–8 weeks old) were dark adapted overnight and killed according to protocols approved by the Administrative Panel on Laboratory Animal Care at the University of Washington. After hemisecting each eye, we removed the vitreous and stored the eyecup in a light-tight container in warm (∼32°C), bicarbonate-buffered Ames Solution (280–285 mOsm; Sigma-Aldrich) equilibrated with 5% CO2/95% O2. These and all subsequent procedures were performed under infrared illumination (>900 nm).
All experiments were performed in a flat mount preparation of the retina. Pieces of retina were isolated from the pigment epithelium, placed photoreceptor side down on a triangular piece of filter paper (Anodisc 25; Whatman), and transferred into a recording chamber. The retina was secured by nylon wires stretched across a platinum ring and perfused with warm (30–34°C) equilibrated Ames solution at a rate of 6–8 ml/min.
Light stimuli and data collection.
Light from a blue light-emitting diode (LED; peak output = 470 nm) was delivered to the recording chamber via a fiber optic cable positioned beneath an upright microscope's condenser lens. The light stimulus uniformly illuminated a circular area 0.6 or 0.65 mm in diameter centered on the recorded cell(s). Calibrated photon fluxes at the preparation were converted to photoisomerizations per rod (Rh*/rod) using the spectral output of the LED, absorption spectrum of rhodopsin, and an assumed collecting area per rod of 0.5 μm2.
We performed electrophysiological recordings with pipettes fabricated from thin-wall borosilicate glass (Sutter Instruments). Light-evoked patterns of action potentials (APs) were measured via cell-attached (or “loose patch”) recordings with pipettes (∼10 MΩ) filled with Ames solution. To characterize light-evoked excitatory and inhibitory synaptic input to RGCs, we performed whole-cell voltage-clamp recordings with pipettes (∼4–6 MΩ) filled with an internal solution containing 105 mm CsCH3SO3, 10 mm TEA-Cl, 20 mm HEPES, 10 mm EGTA, 5 mm Mg-ATP, 0.5 mm Tris-GTP, and 2 mm QX-314 (pH ∼7.3 with CsOH, ∼280 mOsm). The ∼10 mV junction potential associated with this internal solution was corrected offline. A subset of experiments used an internal solution in which CsCl was substituted for CsCH3SO3. Series resistance for voltage-clamp recordings (∼10–15 MΩ) was compensated electronically by 75–80%. RGCs were voltage clamped near the reversal potential for chloride-mediated conductances (ECl ≈ −67 mV) to isolate EPSCs. The large light-evoked inhibitory postsynaptic conductance in Off RGCs (Murphy and Rieke, 2006) greatly facilitated the estimation of ECl, as it produced a clear inward or outward current ∼50 ms after flash onset unless the membrane potential was within a few mV of ECl. We clamped RGCs slightly positive to the reversal potential for excitatory postsynaptic conductances (∼0 mV) to compensate for the effect of uncompensated series resistance and dendritic axial resistance (see Murphy and Rieke, 2006). Whole-cell current-clamp recordings were performed with an internal solution containing 125 mm K Aspartate, 10 mm KCl, 1 mm MgCl2, 10 mm HEPES, 5 mm NMDG-HEDTA, 0.5 mm CaCl2, 4 mm Mg-ATP, 0.5 Tris-GTP, and ∼1 mm QX-314 (pH ∼7.2 with KOH, ∼280 mOsm). The dendrites of neighboring OffT and OffS RGCs were visualized via confocal laser scanning microscopy by including fluorophores (Alexa488, Alexa555) in the pipette solution.
Dynamic clamp experiments were performed as described previously (Murphy and Rieke, 2006) with one exception: in OffT RGCs, the light-evoked conductance mediated by gap junctions was mimicked by injecting a voltage-independent current waveform (rather than modulating the amount of current injection on the basis of the difference between the membrane potential and the reversal potential for the underlying conductance).
Signals were amplified with two Axoclamp 200B amplifiers or one Multiclamp 700B (Molecular Devices), low-pass filtered at 3 kHz, and sampled at 10 kHz (ITC-18 interface, Instrutech Corporation).
Data analysis.
All analyses were performed using procedures written in MATLAB (The MathWorks). The rate of AP generation [recorded in the cell-attached (extracellular) or whole-cell (intracellular) configuration] was determined by binning APs into 5–10 ms bins and then computing the average number of APs in a bin across trials.
As before (Chichilnisky and Rieke, 2005), we used a two-interval forced-choice procedure to estimate the sensitivity and temporal precision with which activity in individual RGCs encoded information about light flashes. For each trial, the activity preceding and following a 10 ms flash was represented as a discretized function of time. Next, a discriminant function was created from the difference between the mean response of a cell in the absence and presence of a flash (Fig. 2). We compared the inner product between the discriminant function and the activity before or after a flash on each trial; trials in which the correlation between the activity after the flash and the discriminant was greatest indicated that this classification scheme correctly identified the presence of a flash on the basis of RGC activity. To facilitate this comparison, the mean firing rate of a cell across trials was subtracted from the data collected on a single trial—in this way, the inner product between the discriminant and the activity on a single trial would increase when both functions decreased or increased from the mean level. We restricted the analysis to temporal windows that lacked the burst of APs in OffT RGCs by determining the last point in time (following the flash) at which AP generation was suppressed >2 SDs below the mean rate in darkness; the postflash window stretched from the time of the flash to this point, while the preflash window was an equivalent duration from flash onset back in time.
Figure 2.

Differences in the pattern of light-evoked APs underlies difference in flash sensitivity between OffT and OffS RGCs. A, Raster plots of APs in neighboring OffS (top) and OffT (bottom) RGCs in response to a family of brief increases in light from darkness. Black dashed vertical line indicates the time at which the flash was delivered. B, Two-interval forced-choice procedure for estimating sensitivity. For each flash strength, the discriminant represented the difference between the average response of a cell on all but one trial in the ∼600 ms before and after the flash. For each trial, we computed the correlation between the discriminant and the pattern of APs (1) in the 600 ms before (black filled bar in top right panel of A) and (2) the 600 ms after (open bar in top right panel of A) the flash was delivered; dashed horizontal lines indicate zero on vertical axis. Cases in which the correlation of the discriminant with the postflash pattern of APs was higher (shown as gray lines) were classified as a response; at this flash strength, the classifier failed in only a few cases (shown as black lines). The fraction of correctly identified flash trials (Fc) is the number of trials classified as a response divided by the number of total trials on which a flash was delivered. This panel displays only a subset of the temporal window over which the discriminant was constructed and compared to data on individual trials. C1, Fc as a function of flash strength; each point represents the average of data obtained simultaneously from 8–11 pairs of OffT (open circles) and OffS (closed circles) RGCs. C2, Same analysis as in C1, with the temporal window for analysis of APs shortened to ∼200 ms before and after the flash; window for analysis indicated by filled and open red bars above the bottom right panel of A. C3, Direct comparison of the sensitivity functions for OffS (top) and OffT (bottom) RGCs computed on the basis of APs recorded over long (600 ms) or short (∼150–200 ms) temporal windows centered around the flash.
The amplitude of analog intracellular responses elicited by voltage steps (e.g., Fig. 3) or light stimuli was quantified as the peak inward or outward current (or membrane potential) deflection following the stimulus. The light-evoked response of OffT RGCs at the chloride reversal potential exhibited a decrease and then increase in a standing inward current; because the increase in the inward component more strongly corresponded with the pattern of APs elicited in the same cells by the same stimuli, we quantified the amplitude of these intracellular responses as the average peak inward current.
Figure 3.

T-type voltage-gated Ca2+ currents in OffT RGCs are not necessary for light-evoked bursts of APs. A1, Currents elicited by hyperpolarizing voltage steps (to values between −70 and −100 mV) in OffT RGCs from WT mice. Inset, Voltage dependence and Ni2+ sensitivity of inward current following voltage steps in OffT RGCs. The inward current was reversibly inhibited by low concentrations of Ni2+ (50 μm; n = 3 cells with >50% recovery after wash). A2, Flash-evoked change in membrane potential of OffT RGCs under control conditions (solid line) and in the presence of mibefradil (dashed line); the flash strength in both cases was ∼0.1 Rh*/rod. Mibefradil did not significantly effect the light-evoked hyperpolarization (inset, left columns) but abolished the subsequent depolarization (inset, right columns); the Na+ channel antagonist QX-314 (1 mm) was present in the internal solution under both conditions. B1, Currents elicited by hyperpolarizing voltage steps in OffT RGCs from mice lacking CaV3.1. B2, Light-evoked changes in the rate of AP generation, and subthreshold membrane potential trajectory (inset), of an OffT RGC from a CaV3.1−/− mouse. Flash time in panels A2 and B2 indicated by arrow.
All data are presented as mean ± SEM; statistical significance was evaluated with paired Student's t test and, when more than two sets of data were compared, ANOVA.
Results
Three types of experiment explored functional differences between parallel retinal circuits. First, we characterized the changes in AP generation elicited in two types of Off RGC by weak, brief increases in light intensity from darkness and the accuracy with which the response of each cell type encoded such stimuli. Second, we examined whether intrinsic properties of the RGCs shaped their distinct responses to the same stimuli. Third, we examined the contribution of light-evoked synaptic input to distinctions in the RGC outputs. We found that neither conventional chemical synaptic input to the two Off RGCs, nor obvious intrinsic properties of the two cells, could account for their distinct outputs. The two RGCs, however, received very different light-evoked electrical synaptic input, and that input could account for the cells' distinct outputs.
Functional differences in the activity of OffS and OffT RGCs
Examining the distinct functional properties of parallel circuits in the CNS, and identifying the mechanisms that underlie these differences, requires reliable identification of the cells and circuits in question. We focused our experiments on two specific classes of mouse Off RGCs—Off transient (OffT) and Off sustained (OffS) (Pang et al., 2003; Murphy and Rieke, 2006; Margolis and Detwiler, 2007). These two types of Off RGC were readily distinguished from other RGCs by the large (15–20 μm) size and characteristic contour of their somata.
We distinguished OffS and OffT RGCs from each other by their responses to brief (10 ms) increases in light intensity from darkness. Light flashes decreased the rate of AP generation in both types of Off RGC (Fig. 1B). Following the decrease, OffT RGCs generated a high-frequency burst of APs, while AP generation in OffS RGCs attained a peak rate of AP generation only marginally higher than that observed in darkness (Fig. 1B,C). Spontaneous AP generation in darkness by OffT and OffS RGCs also differed; OffT RGCs exhibited a significantly lower frequency of AP generation than OffS RGCs (22 ± 2 vs 38 ± 3 APs/s; n = 11; p < 0.001) as well as a broader distribution of interspike intervals (data not shown; Margolis and Detwiler, 2007). These functional distinctions were apparent between neighboring OffT and OffS RGCs recorded simultaneously in a given preparation as well as across different preparations (Fig. 1C).
Functional differences in OffT and OffS RGCs were mirrored by anatomical distinctions. For example, the dendrites of OffS RGCs ramified closer to the inner nuclear layer than the dendrites of OffT RGCs (Margolis and Detwiler, 2007; data not shown). Moreover, the somas of OffS and OffT RGCs were frequently near one another (and occasionally adjacent), and the dendrites of neighboring OffT and OffS RGCs could overlap considerably (Fig. 1D). RGCs from the same class typically form a regularly spaced mosaic, and their dendrites generally do not overlap extensively (for review, see Wässle and Boycott, 1991; Field and Chichilnisky, 2007). Thus, both functional and anatomical data indicate that OffT and OffS cells are distinct RGC classes and represent distinct outputs of the retina. The resemblance of the functional and anatomical properties of OffT/OffS RGCs in mouse to those of α/δ Off RGCs in guinea pig (Manookin et al., 2008) suggests that this distinction is a common feature of mammalian retina.
Patterns of APs in OffT RGCs encode more information about the presence of flash strengths near detection threshold
Do differences in the functional properties of OffT and OffS RGCs affect the encoding of information about light stimuli near detection threshold? To answer this question, we simultaneously recorded the pattern of APs in neighboring OffS and OffT RGCs in darkness and following light flashes of varying strength. Flashes that generated <1 photoisomerization of rhodopsin (Rh*) in a pool of 1000 rod photoreceptors did not elicit a detectable change in the pattern of APs in either OffT or OffS RGCs (Fig. 2A, left column); stronger flashes elicited clear, but distinct, changes in the pattern of AP generation in the two RGC types (Fig. 2A, center, right columns).
To estimate the accuracy with which patterns of APs in OffT and OffS RGCs encoded information about the presence of brief light flashes, we used a two-interval forced-choice procedure. For each cell and flash strength, we computed a discriminant from the difference between the average response (across all but one trial) in equal-duration windows before and after the flash. We then calculated the correlation between the discriminant and the pattern of APs before and after the flash on the one trial that did not contribute to the discriminant; correctly identified trials were those in which the correlation of the discriminant with the pattern of APs after the flash was greater than its correlation with the pattern of APs before the flash. Repeating the procedure across trials estimated the fraction correct (Fc) for a given flash strength. This procedure provides an efficient, and under some circumstances ideal, procedure for estimating whether a flash has or has not occurred based on single examples of the neural response (Duda et al., 2000).
The fraction correct at the lowest flash strength was near that expected from chance (0.5; Fig. 2C1). Fc increased as the flash strength increased in both OffS and OffT RGCs; however, Fc computed from APs recorded in OffT RGCs (Fig. 2C1, open circles) was systematically higher than that computed from APs recorded simultaneously in neighboring OffS RGCs (Fig. 2C1, closed circles; p < 0.0005, ANOVA). Similar results were obtained for window durations of 400–1000 ms (data not shown) and using an alternative discrimination procedure based on a spike-distance metric (Chichilnisky and Rieke, 2005).
Several features distinguish the pattern of APs in OffS and OffT RGCs, and each of these features, alone or in combination, could influence the sensitivity with which APs in a given neuron encode information about the presence of light stimuli. One distinguishing characteristic of OffT RGC responses to dim flashes is the burst of APs that follows light-evoked decreases in firing rate. To what extent does this burst of APs influence the salience of OffT responses? To answer this question, we applied the two-interval forced-choice paradigm to data collected in the 150 ms window preceding and following a flash; this temporal window excludes the light-evoked burst of APs in OffT RGCs, thereby excluding the burst of APs as a source of information for estimating whether a flash has occurred or not.
Excluding the burst of APs in OffT RGCs inverted the relationship between Fc and flash strength in OffS and OffT RGCs—i.e., for a given flash strength, Fc was equal or higher in OffS RGCs (Fig. 2C2). This change reflected a decrease in Fc of OffT RGCs at several flash strengths, as computing Fc on the basis of data from long (1 s) and short (∼150 ms) temporal windows had little effect on data obtained from OffS RGCs (Fig. 2C3). The increased sensitivity of OffS cells in this case likely reflects the rarity of 100–200 ms gaps between APs in these cells in the absence of light input due to their high rate of spontaneous AP generation. Differences in the sensitivity with which patterns of APs in OffT and OffS RGCs provided information about the presence of light stimuli were mirrored by differences in the precision with which the timing of stimuli could be inferred—i.e., the burst of APs in OffT RGCs enabled better estimates of stimulus timing (data not shown). Together, these data suggest that light-evoked bursts of APs in OffT RGCs increase the sensitivity of the responses of these cells to light stimuli near detection threshold.
The distinct light-evoked output of OffT RGCs does not require intrinsic mechanisms that facilitate rebound depolarizations following somatic hyperpolarization
The distinct pattern of APs elicited in OffT and OffS RGCs by dim light stimuli could reflect intrinsic differences in the characteristics of the RGCs, differences in the synaptic input they receive, or both. To begin distinguishing among these possibilities we first examined the intrinsic properties of OffT and OffS RGCs.
OffT RGCs, like neurons in the thalamus, inferior olive, and deep cerebellar nuclei, exhibit a rebound depolarization and burst of APs following strong hyperpolarization. In many of these neurons, deinactivation of low-threshold voltage-activated conductances mediated by “T-type” Ca2+ channels is implicated in the rate and/or amplitude of depolarization following membrane hyperpolarization (for review, see Llinás, 1988). Consistent with previous results (Margolis and Detwiler, 2007; van Wyk et al., 2009; Margolis et al., 2010), we found that OffT (but not OffS) RGCs exhibited a large, 1–2 nA inward current following somatic hyperpolarization to membrane potentials <−80 mV (Fig. 3A). Bath application of antagonists with a higher affinity for T-type channels than high-threshold voltage-activated Ca2+ channels reduced the amplitude of the inward current by >80%: Ni2+ (50 μm; Fig. 3A, inset), mibefradil (5–10 μm; data not shown), and NNC-55 (10–20 μm; data not shown). Ni2+, but not mibefradil or NNC-55, also affected the light-evoked inhibitory synaptic input RGCs received; therefore, we did not use it to study modulation of RGC excitability by light stimuli. Mibefradil (Fig. 3A2) and NNC-55 (data not shown) abolished the light-evoked rebound depolarization in OffT RGCs without altering the degree to which the same stimulus hyperpolarized the soma (Fig. 3A2, inset).
The presence of T-type channels in OffT RGCs, and the effect of antagonists of T-type channels on the membrane potential trajectory of OffT RGCs following brief flashes, is consistent with a role for T-type channels in the distinct response of OffT RGCs to flash strengths near detection threshold. However, the light stimuli we presented did not hyperpolarize the soma of OffT RGCs to membrane potentials at which T-type channels typically deinactivate; moreover, the effect of bath-applied antagonists could be due to actions on RGCs and/or any neuron presynaptic to them—e.g., bipolar cells (Pan et al., 2001) or amacrine cells. To establish the degree to which T-type channels in RGCs versus those in other locations contributed to the pattern of APs in OffT RGCs, we sought a manipulation that abolished T-type channels in OffT RGCs; transgenic mice lacking CaV3.1 (α1 g; Anderson et al., 2005), a gene that codes for one of the three types of α subunits that exhibit properties of T-type Ca2+ channels (for review, see Perez-Reyes, 2003), provided such an opportunity.
The amplitude of the inward current that followed strong somatic hyperpolarization was reduced >20-fold in OffT RGCs from CaV3.1−/− mice compared to WT animals (Fig. 3B1; 0.08 ± 0.02 nA vs 2.0 ± 0.4 nA; n = 6/3). Moreover, OffT RGCs from CaV3.1−/− animals exhibited little or no rebound depolarization following somatic hyperpolarization elicited by current injection (data not shown). The same neurons did, however, exhibit robust rebound depolarizations in response to the same flash strengths that produced rebound depolarizations in RGCs from WT animals (Fig. 3B2, inset). Further, as in OffT RGCs from WT mice, light stimuli that elicited strong rebound depolarizations produced high-frequency bursts of APs in OffT RGCs from CaV3.1−/− mice (Fig. 3B2; average peak = 240 ± 30 APs/s; n = 6). Collectively, these results demonstrate that the presence of T-type Ca2+ channels in OffT RGCs is not necessary for the distinct responses of OffS and OffT RGCs to weak light inputs. These results also indicate that the effects of T-type channel antagonists on light-evoked responses reflect an action on neurons presynaptic to OffT RGCs.
Differences in inhibitory synaptic transmission contribute minimally to differences in the distinct patterns of light-evoked activity in OffS and OffT RGCs
We next explored to what extent differences in light-evoked synaptic input might underlie differences in the output of OffT and OffS RGCs; anatomical results suggest that such differences could arise downstream of the AII amacrine cell as a result of differences, for example, in the probability or strength with which activity in AII amacrine cells decreases excitability in Off RGCs directly via glycinergic input to RGC dendrites or indirectly by modulating glutamatergic synaptic input to OffT and OffS RGCs (Fig. 1A).
We started by characterizing inhibitory synaptic inputs. Flash strengths near detection threshold produced large (>500 pA) currents measured at the reversal potential for mixed cationic currents (ECat; 0–10 mV) in both OffS and OffT RGCs (Fig. 4A). IPSCs measured at ECat in OffT RGCs were significantly larger over a range of flash strengths (ANOVA; p < 0.001). However, flash strengths that elicited similar amplitude currents at ECat in OffT and OffS RGCs elicited dramatically different patterns of APs [see response of OffT and OffS RGCs to flash strengths producing 0.002 and 0.004 Rh*/rod in Fig. 1B, for example; the increase in firing rate above baseline elicited by these flash strengths was 86 ± 3 AP/s and 37 ± 1 APs/s in OffT and OffS RGCs, respectively (n = 8)].
Figure 4.

Differences in light-evoked inhibitory synaptic input, or the somatic hyperpolarization caused by such input, are insufficient to explain differences in the output of OffS and OffT RGCs. A, Peak amplitude of postsynaptic currents measured in OffS (filled circles) and OffT (open circles) RGCs at the reversal potential for EPSCs mediated by ionotropic glutamate receptors (ECat ∼0 mV) as a function of flash strength. Gray dashed lines indicate 0 on the vertical axis. B, Changes in the rate of AP generation elicited by dynamic clamp injection of the measured light-evoked inhibitory postsynaptic conductance (B1) and by three different flash strengths near detection threshold (B2; flash onset indicated by dashed vertical line) in the same OffT RGC. Raw data in B1 represent responses to 10 presentations of the same inhibitory synaptic conductance waveform; traces in B2 show responses to 10 successive presentations of a stimulus producing ∼0.01 Rh*/rod—i.e., the strongest flash delivered in this experiment. Injection of the light-evoked inhibitory postsynaptic conductance hyperpolarized the soma of OffT RGCs slightly more than light stimuli but did not trigger a burst of spikes. C, Effect of applying the glycine receptor antagonist strychnine (10 μm) on responses measured in the cell-attached recording configuration. The plot below shows the average firing rate produced by a family of flash strengths in the absence and presence of strychnine; flash families produced 0.004–0.064 Rh*/rod under control conditions and 0.016–0.256 Rh*/rod in the presence of strychnine. Black and gray traces above represent five consecutive responses to the strongest flash presented under control conditions (black) and in the presence of strychnine (gray), respectively.
The results of Figure 4A suggest that differences in the amplitude of inhibitory synaptic input were unlikely to underlie the distinct responses of OffT and OffS RGCs. To test this further, we converted the measured postsynaptic currents to conductances and used the dynamic clamp technique to mimic the actions of these conductances at the RGC soma. Dynamic clamp injection of currents corresponding to light-evoked inhibitory postsynaptic conductances suppressed AP generation in both OffS (data not shown; n =) and OffT (Fig. 4B1) RGCs. These conductances elicited somatic hyperpolarizations similar to those produced in the same cells by light stimuli (Fig. 4B1,B2, top), but, unlike light stimuli, failed to elicit the characteristic rebound burst of APs (Fig. 4B1,B2, bottom; n = 8).
The above experiments leave open two possible mechanisms by which the inhibitory output of AII amacrine cells could contribute to differences in the OffT and OffS light responses: (1) dendritic conductances could influence the response of RGCs to light-evoked inhibitory postsynaptic conductances; or (2) AII output could modulate signaling in OFF cone bipolar cells and circuits that they contribute to. To test whether either mechanism was necessary to elicit the distinct patterns of APs in OffT and OffS RGCs, we suppressed activity of glycine receptors with 10 μm strychnine. Strychnine at these concentrations blocks the vast majority of inhibitory synaptic input to OffT and OffS RGCs (Murphy and Rieke, 2006) but had a surprisingly small effect on light-evoked patterns of APs (Fig. 4C; n = 4). Strychnine increased the firing rate in darkness, increased by a factor of ∼4 the flash strength necessary to elicit a burst of APs of a given peak frequency, and unveiled a burst of APs ∼100 ms after flash onset that was absent under control conditions; strychnine did not, however, abolish the ability of flash strengths near detection threshold to elicit bursts of APs or, for that matter, abolish the pause in AP generation that preceded the burst of APs in OffT RGCs under control conditions. Picrotoxin, an antagonist of synaptic input mediated by GABAA and GABAC receptors, had similar effects (data not shown).
Together, the results in Figures 3 and 4 suggest that neither differences in inhibitory synaptic input, nor differences in intrinsic properties activated by somatic hyperpolarizations to approximately −75 mV, contribute significantly to the distinct response of OffS and OffT RGCs to flash strengths near detection threshold.
Excitatory synaptic input mediated by ionotropic glutamate receptors is not necessary to produce distinct patterns of APs in OffS and OffT RGCs
Light-evoked currents measured near the reversal potential for inhibitory synaptic input mediated by GABA/glycine receptors (ECl) were significantly smaller than those measured at ECat. However, the inward (depolarizing) current measured in OffT cells at ECl, and its absence in OffS cells, was correlated with the differences in the pattern of light-evoked APs (Fig. 5A). Further, the inward current in OffT RGCs, like the AP burst, was abolished by T-type channel antagonists (mibefradil and NNC-55; data not shown).
Figure 5.
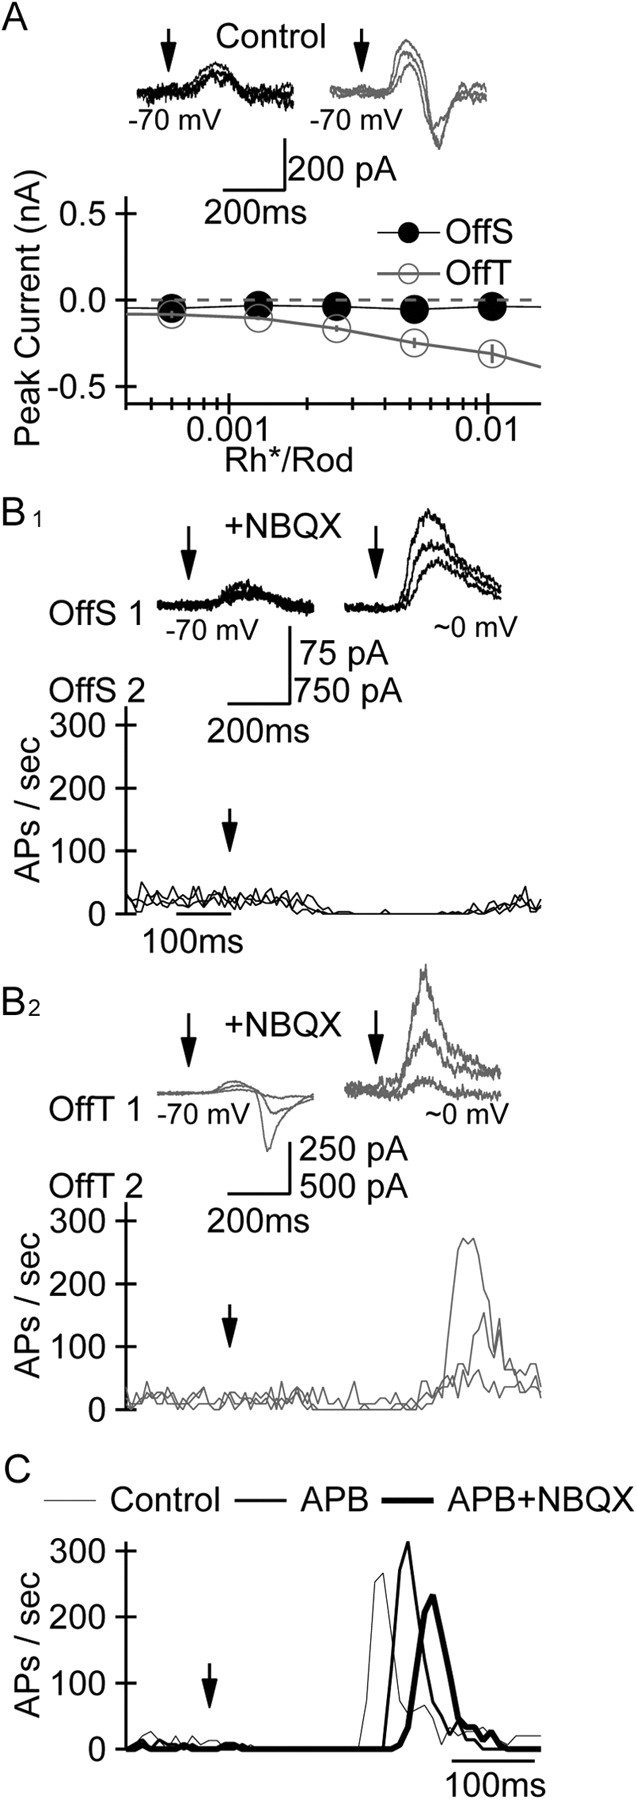
The distinct pattern of synaptic input measured at the chloride reversal potential and AP generation in OffS and OffT RGCs does not require ionotropic glutamate receptor-mediated signaling. A, Peak amplitude of postsynaptic currents measured simultaneously in OffS (black traces; filled circles) and OffT (gray traces; open circles) RGCs at the reversal potential for IPSCs mediated by GABA/glycine receptors (ECl ≈ −70 mV) as a function of flash strength. B, Simultaneous recording from pairs of neighboring OffS (B1) or OffT (B2) RGCs. Light-evoked synaptic currents were measured in one RGC (top row; Vm = −70 and 10 mV in the left and right panels, respectively) and light-evoked changes in AP generation (bottom row) in the other RGC in the presence of the AMPA/KA receptor antagonist NBQX (10 μm). The three flash strengths that elicited just-detectable responses in the presence of NBQX (0.2–0.8 Rh*/rod) were a factor of ∼50 greater than those under control conditions; time of flash indicated by filled arrows. Upper value on scale bar refers to data collected at ECl; lower value refers to data collected at ∼0 mV. C, Average firing rate of a representative OffT RGC under control conditions, in the presence of the mGluR6 agonist l-APB (10 μm) alone, and in the presence of l-APB and NBQX. Flash strengths producing similar peak firing rates in the presence of l-APB and l-APB+NBQX were ∼10-fold greater than under control conditions.
To test whether the depolarizing current measured at ECl in OffT cells was due to glutamatergic input, we exploited a unique feature of circuits in the mammalian retina—the ability to abolish excitatory synaptic input mediated by ionotropic glutamate receptors while sparing light-evoked inhibitory synaptic input from a subset of amacrine cells. This manipulation is enabled by an alternative pathway through which light-evoked signals in rods can propagate to Off RGCs via gap junctions and glycinergic and metabotropic glutamate receptor-mediated signaling [Fig. 1A; rods→cones→On cone bipolar→AII amacrine→Off RGC (Cohen and Miller, 1994; DeVries and Baylor, 1995; Cohen, 1998; Soucy et al., 1998; Manookin et al., 2008)]. To relate directly the patterns of synaptic input and AP generation in a given RGC type, we recorded simultaneously from pairs of nearby OffS or OffT RGCs. We used cell-attached (extracellular) recordings to measure the pattern of APs elicited by a family of flash strengths in one cell and whole-cell patch-clamp recordings in a neighboring cell to examine the synaptic currents elicited by the same stimuli in the same type of RGC.
Bath application of the AMPA/KA receptor antagonist NBQX (20 μm) decreased the rate of AP generation in Off RGCs and increased the flash strength necessary to elicit changes in AP generation by a factor of 10–50. NBQX did not, however, diminish the degree to which light stimuli elicited distinct postsynaptic currents and patterns of APs in OffS (Fig. 5B1) and OffT (Fig. 5B2) RGCs; application of the NMDA receptor antagonist d-APV (50 μm) had an even smaller effect, delaying slightly but not substantially decreasing the peak firing rate elicited in OffT RGCs by the same stimuli as under control conditions (data not shown; n = 5).
Like NBQX, the mGluR6 agonist l-APB (10–20 μm) increased the flash strength necessary to elicit modulation of AP generation in OffT RGCs by a factor of ∼10 but failed to abolish light-evoked postsynaptic currents and bursts of APs in OffT RGCs regardless of whether it was applied alone or in combination with NBQX (Fig. 5C). The lack of a more pronounced effect of NBQX and/or l-APB was not likely due to insufficient action of the drugs on AMPA/KA or mGluR6 receptors, as either drug eliminated light-evoked postsynaptic currents or changes in AP generation measured simultaneously in On RGCs (data not shown). Together, these results provide two surprising insights into signaling near detection threshold: (1) signals can propagate from photoreceptors to RGCs when both mGluR6 and AMPA/KA receptors are blocked, and (2) neither differences in synaptic input mediated by ionotropic glutamate receptors, nor the presence of such synaptic input, is required for the distinct responses of OffS and OffT RGCs to weak light inputs; we revisit these results in more detail in the Discussion section.
Light-evoked changes in electrical synaptic input underlie the rebound depolarization in OffT RGCs
The results of Figures 4 and 5 demonstrate that the unique light-evoked output of OffS and OffT RGCs is not readily explained by differences in inhibitory synaptic input or excitatory synaptic input mediated by ionotropic glutamate receptors. What, then, accounts for the distinct responses of OffS and OffT RGCs to flash strengths near detection threshold? The persistence of light-evoked currents measured at ECl in the presence of ionotropic glutamate receptor antagonists (Fig. 5B2), and the presence of both chemical and electrical synapses on RGC dendrites (for review, see Bloomfield and Völgyi, 2009), prompted us to test whether the light-evoked currents we measured in Off RGCs had characteristics expected for electrical synaptic input.
Electrical synaptic signaling occurs between cells that (1) are coupled by pores called gap junctions and (2) differ in their membrane potential (for review, see Connors and Long, 2004). Unlike chemical synaptic transmission, gap junction-mediated currents elicited in a RGC by a voltage change in a coupled cell will be similar across a wide range of RGC membrane potentials if the electrical synapse is not rectifying and changes in RGC membrane potential minimally impact the voltage change in the coupled cell. We exploited this unique characteristic to determine to what degree light-evoked synaptic input to OffT RGCs is mediated by electrical synaptic input. Specifically, we recorded light-evoked currents at ECl to minimize the driving force for chemical inhibitory synaptic input and asked how the amplitude of that light-evoked current depended on the absolute membrane potential of the RGC. If the current is mediated by chemical synaptic input, then its amplitude should decrease as the RGC is depolarized toward the reversal potential for the underlying (likely mixed cationic) conductance. Alternatively, if the current is mediated by electrical synaptic input, the light-evoked current should be largely insensitive to the absolute membrane potential of the RGC.
We tested these hypotheses in two complementary ways. In one set of experiments, we started by measuring the amplitude of currents elicited by light stimuli in an OffT RGC at the ECl dictated by our standard internal solution (Fig. 6A1; black traces). We then patched onto the same cell with a second pipette containing a Cl−-rich internal solution, dialyzed the cell, and adjusted the membrane potential to the new ECl (which reflected a mixture of the Cl− concentration in the two pipette solutions; ECl determined empirically as described in Materials and Methods). Introduction of the Cl−-rich internal solution had little or no effect on the amplitude of light-evoked currents measured at ECl (Fig. 6A1; red traces). This manipulation depolarized ECl by ≥30 mV and thus would be expected to halve the amplitude of excitatory synaptic inputs with a reversal potential near 0 mV. The amplitude of light-evoked currents measured at ECl before and after introduction of the Cl−-rich internal solution remained similar when experiments were performed in the presence of the NMDAR antagonist APV (25–50 μm; data not shown), ruling out the possibility that a decrease in the driving force for AMPA/KA receptor-mediated synaptic transmission (or any other conductance that reverses at depolarized membrane potentials) was compensated by voltage-dependent unmasking of NMDA receptor-mediated currents (Mayer et al., 1984; Nowak et al., 1984).
Figure 6.

The amplitude of light-evoked currents measured at ECl in OffT RGCs is insensitive to the absolute membrane potential and smaller in mice lacking Cx36. A1, Dual patch-clamp recordings from the same OffT RGC. After measuring the currents elicited by a family of dim light stimuli near ECl (approximately −70 mV; 0.005–0.02 Rh*/rod), we patched the same cell with another pipette containing a CsCl internal solution and reexamined currents elicited by the same light stimuli at the new ECl; in the case shown here, the new ECl was approximately −25 mV). The light-evoked inward current measured at ECl was largely independent of membrane potential. A2, Currents elicited at the reversal potential for Cl− in recordings using a CsCl internal solution alone; the traces and summary data are from experiments performed in the presence of NBQX (5 μm); flashes elicited 0.03–0.48 Rh*/rod. B, Currents elicited at ECl in OffT RGCs from WT and Cx36−/− animals; equal strength flash families elicited significantly larger inward currents in OffT RGCs from WT animals (p < 0.01). The ordinate for each inset panel is absolute peak inward current.
In complementary experiments, we asked whether the characteristic light-evoked current measured at ECl in OffT RGCs persisted when the internal solution set ECl at ∼0 mV—i.e., at a membrane potential at which there was little or no driving force for either anionic or mixed cationic postsynaptic conductances. Light flashes under these conditions continued to elicit a change in current with properties similar to that measured when ECl was −70 mV in the absence (data not shown) and presence (5 μm NBQX; Fig. 6A2) of ionotropic glutamate receptor antagonists. Collectively, these results are incompatible with the idea that flash strengths near detection threshold modulate excitatory synaptic input to OffT RGCs through a receptor-mediated ohmic conductance. Instead, the data are most consistent with the postsynaptic current measured at ECl in OffT RGCs (and the rebound depolarization recorded in current clamp) resulting from light-evoked changes in gap junction-mediated electrical synaptic input.
Gap junctions are comprised of a family of proteins called connexins (for review, see Goodenough et al., 1996). Anatomical evidence indicates that connexin 36 (Cx36) forms gap junctions throughout the retina, including homotypic junctions between Off RGCs of the same class as well as heterotypic junctions between Off RGCs and interneurons (Schubert et al., 2005; Völgyi et al., 2005). We therefore tested whether Cx36 was required for the current elicited in OffT RGCs by dim light stimuli.
Removal of Cx36 could influence retinal signaling in several locations. Indeed, inhibitory synaptic inputs elicited by dim flashes were ∼3× less sensitive in OffS and OffT RGCs from Cx36−/− mice compared to WT mice. Similarly, just-detectable flashes (measured from APs as in Fig. 2) were ∼2× brighter in OffS and OffT RGCs from Cx36−/− mice. However, light-evoked currents at ECl were slower and >20× less sensitive in OffT RGCs from mice lacking Cx36 (Fig. 6B). Moreover, currents at ECl in OffT RGCs from Cx36−/− mice were considerably smaller than those in response to similar flashes in WT cells held at 0 mV in the presence of NBQX (compare Fig. 6B with 6A2). Peak rates of AP generation for identical strength flashes were much lower in OffT RGCs from Cx36−/− mice (40 ± 10 vs 220 ± 20 APs/s above the baseline rate), although OffT RGCs in Cx36−/− animals could produce high-frequency bursts of APs in response to bright flashes (10- to 20-fold brighter than those required to produce comparable bursts in OffT RGCs from WT animals). The absence of robust light-evoked synaptic input at ECl in RGCs from Cx36−/− animals, and the unusual characteristics of synaptic input measured in WT animals, strongly suggests that the light-evoked current measured at ECl represents electrical synaptic input mediated by gap junctions.
To determine whether electrical synaptic input was sufficient to distinguish the output of OffT and OffS RGCs, we compared OffS and OffT responses to inputs mimicking those normally received by OffT RGCs in response to light stimuli near detection threshold. In particular, we compared the pattern of APs elicited by somatic injection of currents corresponding to measured light-evoked inhibitory postsynaptic conductances, the light-evoked currents measured in OffT RGCs at ECl, and the combination of the two. These experiments, like those in Figure 4, were performed in the absence of receptor antagonists so that both OffT and OffS RGCs experienced the tonic chemical and electrical synaptic input they normally would in darkness.
Somatic injection of the light-evoked current measured in OffT RGCs at ECl generated a robust burst of APs in both OffT and OffS RGCs (Fig. 7A1,B). The combination of this current and the light-evoked inhibitory postsynaptic conductance tended to increase slightly the peak rate of AP generation in both cell types, in part by making the timing of the burst more reproducible from trial to trial (Fig. 7A2,B, p < 0.045 for OffS and p < 0.01 for OffT). Most importantly, the combination of the depolarizing current from electrical synapses and the inhibitory synaptic input produced indistinguishable peak firing rates in the two cell types (p > 0.8), and the peak rate reached or exceeded that achieved following light flashes. Together, these results demonstrate that introducing into OffS RGCs the voltage-independent current measured at ECl in OffT RGCs is sufficient to induce a burst of APs. These results indicate that the distinct output of OffS and OffT RGCs can be explained by the distinct electrical synaptic input the RGCs receive.
Figure 7.

Light-evoked synaptic input to OffT RGCs is sufficient to elicit high-frequency bursts of APs in OffS RGCs. A, Five consecutive responses of a representative OffS (top row) and OffT (bottom row) RGC to three combinations of light-evoked synaptic input: A1, somatic injection of the light-evoked synaptic postsynaptic current measured at ECl in an OffT RGC (“E”); A2, somatic injection of the sum of the two light-evoked synaptic inputs introduced separately in A1 and A3 (“E+I”). A3, Somatic injection of the light-evoked inhibitory postsynaptic conductance measured in an OffT RGC (“I”). B, Average peak firing rate as a function of cell and input type.
Discussion
Anatomical and physiological properties of the rod bipolar pathway in mammalian retina are well suited to convey signals generated by the photoisomerization of individual rhodopsin molecules in a minute fraction of rod photoreceptors (for review, see Field et al., 2005). Characteristics of the responses of OffT RGCs to just-detectable flashes presented here, however, are difficult to reconcile with features of the rod bipolar circuitry described to date. In the sections below, we focus on aspects of light-evoked responses of OffT RGCs that were surprising given current understanding of the rod bipolar pathway and how these features contribute to the distinct output of parallel retinal circuits to flash strengths near absolute detection threshold.
Functional properties of specific classes of neurons throughout the CNS frequently reflect characteristics of the glutamatergic synaptic input the cells receive. The opposite polarity response of Off and On bipolar cells to increases in light intensity, for example, reflects the distinct expression and effect of ionotropic and metabotropic glutamate receptor activation (for review, see Nakanishi, 1995), and differences in the activity of distinct RGCs produced by signals traversing the rod bipolar pathway are frequently attributed to changes in the glutamatergic inputs that RGCs receive (for review, see Sharpe and Stockman, 1999; Bloomfield and Dacheux, 2001; Wässle, 2004). Differences in the characteristics of ionotropic glutamate receptors that mediate synaptic signaling between cone photoreceptors and different classes of Off cone bipolars likely contribute significantly to parallel processing under brighter (photopic) conditions (DeVries, 2000). Given the emphasis on glutamatergic signaling, we were surprised to find that the depolarizing currents elicited in OffT RGCs by flash strengths near detection threshold were neither blocked by ionotropic glutamate receptor antagonists nor altered dramatically by changing the driving force for excitatory postsynaptic conductances mediated by glutamate (or other) receptors generating nonselective cation conductances. The absence of significant light-modulated excitatory chemical synaptic transmission under these conditions could reflect one of (at least) two possibilities. First, AII amacrine cells may not form functional glycinergic contacts with the terminals of every class of Off cone bipolar cell (e.g., Tsukamoto et al., 2001); consistent with this idea, recent results indicate that light stimuli near detection threshold elicit little or no change in the membrane potential of the vast majority of Off cone bipolar cells sampled (Arman and Sampath, personal communication). Alternatively, or additionally, rectification at the Off cone bipolar to Off RGC synapse could render excitatory synaptic input to Off RGCs relatively insensitive to small increases in light intensity from darkness. Distinguishing between these possibilities will be important to understand how glutamatergic input to RGCs is recruited at higher light levels.
The same light stimuli that failed to elicit measurable glutamatergic synaptic input to OffT and OffS RGCs evoked strong inhibitory synaptic input. The peak amplitude of inhibitory synaptic input was larger in OffT RGCs relative to OffS RGCs across a range of flash strengths, but this difference is unlikely to account for the distinct output of the two cell types; flash strengths that produced similar inhibitory synaptic input produced dramatically different patterns of APs. Differences in the output of OffT and OffS RGCs were not obviously attributable to differences in the cells' intrinsic properties either. The hyperpolarization-activated conductance (Ih) can contribute to rebound depolarizations in RGCs (Tabata and Ishida, 1996; Lee et al., 2003; Mitra and Miller, 2007). But, like α and β cells in the cat retina (O'Brien et al., 2002), Ih was not apparent in the Off RGCs we examined. OffT, but not OffS, RGCs exhibited a large low voltage-activated Ca2+ conductance, but genetic deletion of the channels underlying this conductance had little, if any, effect on light-evoked synaptic input or AP generation. Indeed, results of our dynamic clamp experiments indicate that differences in the intrinsic properties of OffS and OffT RGCs are not necessary for the two cells to exhibit distinct outputs.
OffT cells are coupled reciprocally through electrical synapses composed of gap junctions containing Cx36 (data not shown; Schubert et al., 2005). In principle, network interactions among OffT cells mediated via such electrical synapses could produce the OffT AP burst. However, the burst of APs in OffT RGCs was insensitive to the deletion of CaV3.1 channels, but was sensitive to bath application of T-type channel antagonists. These observations suggest that the burst was generated by a cell expressing CaV3.2 or CaV3.3. The circuitry providing input to such a cell is constrained by several observations: (1) T-type channel antagonists had little effect on inhibitory inputs to OffT and OffS cells; (2) the depolarizing input to OffT cells was insensitive to block of AMPA and kainate receptors with NBQX, to block of NMDA receptors with APV, to block of mGluR6 receptors with l-APB, and to block of glycine and GABAA/GABAC receptors with strychnine and picrotoxin, respectively; and (3) OffT cells produced bursts of APs for flashes too dim to produce substantial signals in cone photoreceptors (Naarendorp et al., 2010).
The model most consistent with these observations is that OffT RGCs form electrical synapses with an interneuron that expresses CaV3.2 or CaV3.3. Indeed, histochemical data indicate that the Off RGCs with the largest cell bodies in mammalian retina are coupled to amacrine cells via gap junctions and that such coupling is abolished in mice lacking Cx36 (Schubert et al., 2005; Völgyi et al., 2005). The presence of T-type channels in such an amacrine cell could generate a strong rebound depolarization in that cell (and any cell to which it was coupled via gap junctions) following light-evoked hyperpolarization. While the existence of such an amacrine cell is the simplest interpretation consistent with our data, we cannot rule out other, more complex possibilities; indeed, the inability of mGluR6, AMPA/KA, or glycine receptor antagonists to abolish the light-evoked burst of APs in OffT RGCs makes it difficult to interpret the results in the context of conventional circuit and synaptic pathways. We are actively seeking to understand the precise circuits through which signals can propagate to ganglion cells in the presence and absence of canonical signaling pathways immediately downstream of photoreceptors. In the meantime, perhaps the strongest conclusion that our data support is that knowledge about the circuits governing responses to light stimuli near detection threshold is insufficient to explain the basis for responses of a subset of Off RGCs.
Footnotes
Support for this research was provided by the NIH (EY-11850) and HHMI. We thank Matt Anderson and Susumu Tonegawa for providing mice lacking CaV3.1, David Paul for mice lacking Connexin36, Kamran Khodakhah for mibefradil, Jon Cafaro and Petri Ala-Laurila for help with preliminary dynamic clamp experiments, and Paul Newman and Eric Martinson for technical assistance. We are grateful for helpful comments on the manuscript provided by Kevin Briggman, Alapakkam Sampath, Greg Field, and Felice Dunn.
References
- Anderson MP, Mochizuki T, Xie J, Fischler W, Manger JP, Talley EM, Scammell TE, Tonegawa S. Thalamic Cav3.1 T-type Ca2+ channel plays a crucial role in stabilizing sleep. Proc Natl Acad Sci U S A. 2005;102:1743–1748. doi: 10.1073/pnas.0409644102. [DOI] [PMC free article] [PubMed] [Google Scholar]
- Bloomfield SA, Dacheux RF. Rod vision: pathways and processing in the mammalian retina. Prog Retin Eye Res. 2001;20:351–384. doi: 10.1016/s1350-9462(00)00031-8. [DOI] [PubMed] [Google Scholar]
- Bloomfield SA, Völgyi B. The diverse functional roles and regulation of neuronal gap junctions in the retina. Nat Rev Neurosci. 2009;10:495–506. doi: 10.1038/nrn2636. [DOI] [PMC free article] [PubMed] [Google Scholar]
- Chichilnisky EJ, Rieke F. Detection sensitivity and temporal resolution of visual signals near absolute threshold in the salamander retina. J Neurosci. 2005;25:318–330. doi: 10.1523/JNEUROSCI.2339-04.2005. [DOI] [PMC free article] [PubMed] [Google Scholar]
- Cohen ED. Interactions of inhibition and excitation in the light-evoked currents of X type retinal ganglion cells. J Neurophysiol. 1998;80:2975–2990. doi: 10.1152/jn.1998.80.6.2975. [DOI] [PubMed] [Google Scholar]
- Cohen ED, Miller RF. The role of NMDA and non-NMDA excitatory amino acid receptors in the functional organization of primate retinal ganglion cells. Vis Neurosci. 1994;11:317–332. doi: 10.1017/s0952523800001668. [DOI] [PubMed] [Google Scholar]
- Connors BW, Long MA. Electrical synapses in the mammalian brain. Annu Rev Neurosci. 2004;27:393–418. doi: 10.1146/annurev.neuro.26.041002.131128. [DOI] [PubMed] [Google Scholar]
- Dacey DM, Packer OS. Colour coding in the primate retina: diverse cell types and cone-specific circuitry. Curr Opin Neurobiol. 2003;13:421–427. doi: 10.1016/s0959-4388(03)00103-x. [DOI] [PubMed] [Google Scholar]
- DeVries SH. Bipolar cells use kainate and AMPA receptors to filter visual information into separate channels. Neuron. 2000;28:847–856. doi: 10.1016/s0896-6273(00)00158-6. [DOI] [PubMed] [Google Scholar]
- DeVries SH, Baylor DA. An alternative pathway for signal flow from rod photoreceptors to ganglion cells in mammalian retina. Proc Natl Acad Sci U S A. 1995;92:10658–10662. doi: 10.1073/pnas.92.23.10658. [DOI] [PMC free article] [PubMed] [Google Scholar]
- Duda RO, Hart PE, Stork DG. Pattern classification. Ed 2. Hoboken, NJ: Wiley-Interscience; 2000. [Google Scholar]
- Field GD, Chichilnisky EJ. Information processing in the primate retina: circuitry and coding. Annu Rev Neurosci. 2007;30:1–30. doi: 10.1146/annurev.neuro.30.051606.094252. [DOI] [PubMed] [Google Scholar]
- Field GD, Sampath AP, Rieke F. Retinal processing near absolute threshold: from behavior to mechanism. Annu Rev Physiol. 2005;67:491–514. doi: 10.1146/annurev.physiol.67.031103.151256. [DOI] [PubMed] [Google Scholar]
- Goodenough DA, Goliger JA, Paul DL. Connexins, connexons, and intercellular communication. Annu Rev Biochem. 1996;65:475–502. doi: 10.1146/annurev.bi.65.070196.002355. [DOI] [PubMed] [Google Scholar]
- Lee SC, Hayashida Y, Ishida AT. Availability of low-threshold Ca2+ current in retinal ganglion cells. J Neurophysiol. 2003;90:3888–3901. doi: 10.1152/jn.00477.2003. [DOI] [PMC free article] [PubMed] [Google Scholar]
- Llinás RR. The intrinsic electrophysiological properties of mammalian neurons: insights into central nervous system function. Science. 1988;242:1654–1664. doi: 10.1126/science.3059497. [DOI] [PubMed] [Google Scholar]
- Manookin MB, Beaudoin DL, Ernst ZR, Flagel LJ, Demb JB. Disinhibition combines with excitation to extend the operating range of the OFF visual pathway in daylight. J Neurosci. 2008;28:4136–4150. doi: 10.1523/JNEUROSCI.4274-07.2008. [DOI] [PMC free article] [PubMed] [Google Scholar]
- Margolis DJ, Detwiler PB. Different mechanisms generate maintained activity in ON and OFF retinal ganglion cells. J Neurosci. 2007;27:5994–6005. doi: 10.1523/JNEUROSCI.0130-07.2007. [DOI] [PMC free article] [PubMed] [Google Scholar]
- Margolis DJ, Gartland AJ, Euler T, Detwiler PB. Dendritic calcium signaling in ON and OFF mouse retinal ganglion cells. J Neurosci. 2010;30:7127–7138. doi: 10.1523/JNEUROSCI.5694-09.2010. [DOI] [PMC free article] [PubMed] [Google Scholar]
- Masland RH. The fundamental plan of the retina. Nat Neurosci. 2001;4:877–886. doi: 10.1038/nn0901-877. [DOI] [PubMed] [Google Scholar]
- Mayer ML, Westbrook GL, Guthrie PB. Voltage-dependent block by Mg2+ of NMDA responses in spinal cord neurones. Nature. 1984;309:261–263. doi: 10.1038/309261a0. [DOI] [PubMed] [Google Scholar]
- Mitra P, Miller RF. Mechanism underlying rebound excitation in retinal ganglion cells. Vis Neurosci. 2007;24:709–731. doi: 10.1017/S0952523807070654. [DOI] [PubMed] [Google Scholar]
- Murphy GJ, Rieke F. Network variability limits stimulus-evoked spike timing precision in retinal ganglion cells. Neuron. 2006;52:511–524. doi: 10.1016/j.neuron.2006.09.014. [DOI] [PMC free article] [PubMed] [Google Scholar]
- Naarendorp F, Esdaille TM, Banden SM, Andrews-Labenski J, Gross OP, Pugh EN., Jr Dark light, rod saturation, and the absolute and incremental sensitivity of mouse cone vision. J Neurosci. 2010;30:12495–12507. doi: 10.1523/JNEUROSCI.2186-10.2010. [DOI] [PMC free article] [PubMed] [Google Scholar]
- Nakanishi S. Second-order neurones and receptor mechanisms in visual- and olfactory-information processing. Trends Neurosci. 1995;18:359–364. doi: 10.1016/0166-2236(95)93929-r. [DOI] [PubMed] [Google Scholar]
- Nowak L, Bregestovski P, Ascher P, Herbet A, Prochiantz A. Magnesium gates glutamate-activated channels in mouse central neurones. Nature. 1984;307:462–465. doi: 10.1038/307462a0. [DOI] [PubMed] [Google Scholar]
- O'Brien BJ, Isayama T, Richardson R, Berson DM. Intrinsic physiological properties of cat retinal ganglion cells. J Physiol. 2002;538:787–802. doi: 10.1113/jphysiol.2001.013009. [DOI] [PMC free article] [PubMed] [Google Scholar]
- Pan ZH, Hu HJ, Perring P, Andrade R. T-type Ca(2+) channels mediate neurotransmitter release in retinal bipolar cells. Neuron. 2001;32:89–98. doi: 10.1016/s0896-6273(01)00454-8. [DOI] [PubMed] [Google Scholar]
- Pang JJ, Gao F, Wu SM. Light-evoked excitatory and inhibitory synaptic inputs to ON and OFF alpha ganglion cells in the mouse retina. J Neurosci. 2003;23:6063–6073. doi: 10.1523/JNEUROSCI.23-14-06063.2003. [DOI] [PMC free article] [PubMed] [Google Scholar]
- Perez-Reyes E. Molecular physiology of low-voltage-activated t-type calcium channels. Physiol Rev. 2003;83:117–161. doi: 10.1152/physrev.00018.2002. [DOI] [PubMed] [Google Scholar]
- Schubert T, Degen J, Willecke K, Hormuzdi SG, Monyer H, Weiler R. Connexin36 mediates gap junctional coupling of alpha-ganglion cells in mouse retina. J Comp Neurol. 2005;485:191–201. doi: 10.1002/cne.20510. [DOI] [PubMed] [Google Scholar]
- Sharpe LT, Stockman A. Rod pathways: the importance of seeing nothing. Trends Neurosci. 1999;22:497–504. doi: 10.1016/s0166-2236(99)01458-7. [DOI] [PubMed] [Google Scholar]
- Soucy E, Wang Y, Nirenberg S, Nathans J, Meister M. A novel signaling pathway from rod photoreceptors to ganglion cells in mammalian retina. Neuron. 1998;21:481–493. doi: 10.1016/s0896-6273(00)80560-7. [DOI] [PubMed] [Google Scholar]
- Tabata T, Ishida AT. Transient and sustained depolarization of retinal ganglion cells by Ih. J Neurophysiol. 1996;75:1932–1943. doi: 10.1152/jn.1996.75.5.1932. [DOI] [PubMed] [Google Scholar]
- Troy JB, Shou T. The receptive fields of cat retinal ganglion cells in physiological and pathological states: where we are after half a century of research. Prog Retin Eye Res. 2002;21:263–302. doi: 10.1016/s1350-9462(02)00002-2. [DOI] [PubMed] [Google Scholar]
- Tsukamoto Y, Morigiwa K, Ueda M, Sterling P. Microcircuits for night vision in mouse retina. J Neurosci. 2001;21:8616–8623. doi: 10.1523/JNEUROSCI.21-21-08616.2001. [DOI] [PMC free article] [PubMed] [Google Scholar]
- van Wyk M, Wässle H, Taylor WR. Receptive field properties of ON- and OFF-ganglion cells in the mouse retina. Vis Neurosci. 2009;26:297–308. doi: 10.1017/S0952523809990137. [DOI] [PMC free article] [PubMed] [Google Scholar]
- Völgyi B, Abrams J, Paul DL, Bloomfield SA. Morphology and tracer coupling pattern of alpha ganglion cells in the mouse retina. J Comp Neurol. 2005;492:66–77. doi: 10.1002/cne.20700. [DOI] [PMC free article] [PubMed] [Google Scholar]
- Wässle H. Parallel processing in the mammalian retina. Nat Rev Neurosci. 2004;5:747–757. doi: 10.1038/nrn1497. [DOI] [PubMed] [Google Scholar]
- Wässle H, Boycott BB. Functional architecture of the mammalian retina. Physiol Rev. 1991;71:447–480. doi: 10.1152/physrev.1991.71.2.447. [DOI] [PubMed] [Google Scholar]