The gap between practice costs and practice revenue will continue to narrow, and as this occurs, community oncology practices will find it difficult to maintain their current business models.
Abstract
Oncology Metrics, a division of Altos Solutions, has been conducting organized surveys of practicing oncologists since 2005. In this article, we present data that represent trends in community oncology practice over a 6-year period, 2005 to 2010, and make projections on the basis of these data. Over the next 3 years, operating margins will continue to decrease, gains in business and clinical operating efficiencies will slow, and labor costs will rise. The cost of drugs provided to patients is also increasing while the amount above cost that is being reimbursed continues a slow decline. The gap between practice costs and practice revenue will continue to narrow, and as this occurs, community oncology practices will find it difficult to maintain their current business models.
Introduction
Oncology Metrics, a division of Altos Solutions, has been conducting organized surveys of practicing oncologists since 2005. The first two such surveys were conducted on behalf of a client; in 2007, we introduced the National Practice Benchmark (NPB), which we have conducted annually since then. In these surveys, medical oncologists, practice administrators, and other key staff members from practices across the country are invited by e-mail to participate through an online survey tool. Each NPB survey requests data for the most recently completed 12-month accounting period, generally the calendar year. Practices are not required to complete all questions, and data from incomplete surveys are included in the final survey results.
We report all submitted responses to the qualitative information collected in the survey. These include practice demographics and operational issues. We screen the data submitted for the quantitative sections to ensure consistency of data by any single contributor and a level of plausibility among all contributors. Each practice that completes the quantitative section receives a small incentive reward and a copy of the completed benchmarking report.
Trends
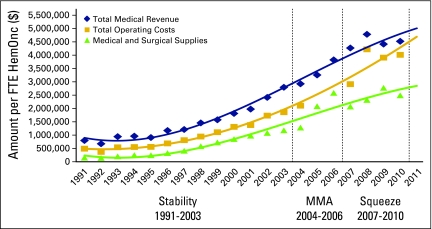
Each of the reports from 2005 to 20101–6 is a snapshot of the economic conditions affecting the oncology practices participating in the survey for that year. Each report tells a story about individual adaptation to a changing economic environment. (For the most recent benchmark data, please see the Barr and Towle article in the upcoming November JOP supplement.) Data from these years and data from earlier surveys by the Medical Group Management Association (MGMA) are presented in Figure 1.7–9 We present the data in three periods. The period between 1991 and 2003 is characterized by predictable growth and economic stability. The 2004 through 2006 period is the time of adaption to the Medicare Modernization Act of 2003. Finally, 2007 through 2010 shows, for the first time, two instances in which the amount spent on treatment drugs per full-time equivalent hematology-oncology physician (FTE HemOnc) declines and operating margins shrink.
Figure 1.
Oncology Metrics trend tracking by per full-time equivalent hematology-oncology physician (FTE HemOnc). MMA, Medicare Prescription Drug, Improvement, and Modernization Act of 2003.
Stability
In the 2005-2010 period, each year brought a steady increase in the difference between the cost of running the practice (total operating costs, including the cost of drugs, indicated by the gold line in Figure 1) and the revenue produced from operations (total medical revenue; blue line). This increase represents the pool of funds available for physician compensation and investments in practice infrastructure. The divergence of the gold and blue lines denotes increasing bottom-line resources at the practice for each physician during this period.
Medicare Modernization
On December 8, 2003, President George W. Bush signed into law the Medicare Prescription Drug, Improvement, and Modernization Act of 2003. Included in the regulations was the abandonment of the average wholesale price (AWP) as the reference used to set the amount that Medicare paid for drugs, shown as the green line in Figure 1 (medical and surgical supplies). AWP was poorly related to the actually price paid for drugs and favored an environment of ever-increasing drug costs and margins. Beginning in 2004, Medicare has reimbursed drugs at 6% above the average sales price (ASP). Unlike AWP, ASP reflects the prices actually paid for drugs used in oncology. Even with the change to ASP, 2005 brought a dramatic increase in both the amount of money spent on drugs and the total revenue coming into practices. This increase continued in 2006.
The Squeeze
It took clinical regulation to reset the bar on oncology drug costs. On May 9, 2007, the US Food and Drug Administration issued a public health advisory outlining new safety information about erythropoietic stimulating agents (ESAs). This included a new black box warning advising physicians to adjust the ESA dose to maintain the lowest hemoglobin level needed to avoid the need for a blood transfusion. At approximately the same time, requirements for reimbursement reporting associated with ESAs for Medicare and private insurance became more stringent. The effect of these actions was to dramatically reduce the use of these agents, and that reduction is reflected in the drug spending for 2007, as seen in Figure 1.
The dramatic decrease in the amount of drug spending in 2007 was coupled with a reduction in the total operating cost, but the reduction in total medical revenue was delayed. After 2007, drug spending resumed its rate of growth, nearly matching the growth rates observed in 2005 and 2006. Only in 2009 and 2010 was there a decrease in total revenue, and in 2010, drug spending again decreased, for only the second time since 1991.
Looking Ahead
Projecting the future from these data is fraught with all the usual cautionary tales regarding data integrity, sample size, trending methodology, and a host of other limitations. Economic prediction, though never easy, is markedly easier in a steady-state economy; today we are making these predictions from and into very turbulent times. Still—with the warning of Yogi Berra, “It's tough to make predictions, especially about the future” and from any investment offering, “past performance is not predictive of future returns”—this is where we see oncology delivery in the community practice setting heading over the next 3 years: The present community-based cancer care business model faces decreasing margins on more expensive drugs, rising labor costs, stable production, and declining total revenue. A new business model is needed that can meet these challenges.
The following analysis is based on the 6 years from 2005 through 2010; the turbulent years when the impacts of lower drug margins were taking hold. We have used two different mathematical formulas to generate the trend lines and project into the future. First, we have used a second-order polynomial fit to the observed data where the data variability seemed to warrant the additional freedom to adapt the trend line to the observed data. Where the data did not require the additional degree of freedom, we elected to use a straight line least squares fit. These simple mathematical models were used to project 3 years into the future.
We want to acknowledge several limitations in the data used for this analysis. First, the underlying data were collected from different participants each year, and the collection tool was not consistent from year to year. The number of practices participating in each sample year also varied considerably. In addition, we work day-to-day with and among the same community practices that are the subject of this forecast, and that undoubtedly informed our predictions; a polite way to say that we are likely biased by these experiences. Clearly, there is a good deal of conjecture and opinion in the interpretation of these data, so please be cautious as you react to the forecast presented here.
Prediction 1: The Squeeze Persists
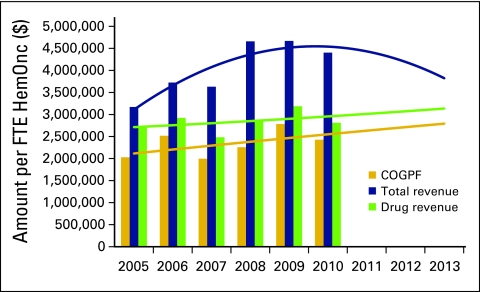
In Figure 1, the term “medical and surgical supplies” is from the MGMA nomenclature. In oncology, this reflects the cost of drugs (infused or injected rather than oral) purchased by the practice for use in treatment. In our surveys, we ask for the total amount paid for drugs in the calendar year reported minus any rebates that were received in the period and call this the cost of goods paid for (COGPF). Most of the practices that participated in the survey use cash-based accounting and so can report COGPF accurately. Although this is not the actual cost of the drugs used in the period, it is a reasonable surrogate. The reduction in reimbursement for the drugs provided in the community oncology clinic can be readily seen and projected using the polynomial fit, as shown in Figure 2.
Figure 2.
Drug cost (cost of goods paid for; COGPF), total revenue, and drug revenue per full-time equivalent hematology-oncology physician (FTE HemOnc).
In this figure we see that total revenue, represented by the blue trend line, is falling even as drug revenue is increasing slightly. In the same period, the cost of drugs is increasing at a faster pace than drug revenue. The effect of this is to lower the contribution to revenue made by drugs after subtracting the cost of those drugs.
Over the next 3 years we expect that these trends will continue and the margin on drugs will continue to decrease. Drug spending will continue to grow, and overall revenue will fall. Still, there will remain a small margin on drugs, and the provision of these drugs will continue to be a part of the business of successful oncology practices.
Prediction 2: Pace of Continued Efficiency Improvement Falters
Increased standardization of operations, both clinical and financial, go hand in hand with increased efficiency.10 We have seen significant changes in the National Practice Benchmark data that reflect increased practice efficiencies. Notable among these are a reduction in the amount of drug inventory on hand in the practice and more speedy collection of insurance payments. Both of these changes provided a one-time increase in available cash for practices as they reduced the operating capital required to run the business. However, neither of these changes fundamentally increased efficiency or added to clinical quality in a way that provides a durable lowering of operating cost. Operating efficiencies likely will continue to lower the cost of providing services but are unlikely to deliver the quick boost to bottom-line cash that accelerated collections or inventory reductions did in past years. We predict no additional activities that can significantly lower operating cash requirement for the next 3 years.
Prediction 3: Service Delivery Per Full-Time Equivalent Hematologist-Oncology Physician Peaks
We have seen a steady increase in the number of new patients per full-time equivalent hematology-oncology physician (FTE HemOnc) over the years. In 2003, MGMA reported 235 new patients per year as the median and 345 at the 75th percentile among the 34 reporting practices.11 More recently, the NPB data support 350 new patients per FTE HemOnc as the standard. Clearly, the work output in the surveyed practices has increased. We have also reported widespread use of nonphysician practitioners, and this further increases the capacity of the practices.
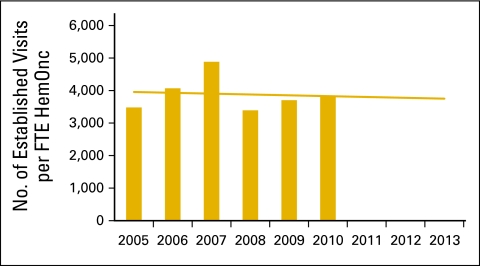
Although historically we have reported the number of new patients per FTE HemOnc as a primary measure of work output, effective January 1, 2010, Medicare no longer recognizes consultation codes for Medicare Part B fee-for-service payment. Counting these codes is no longer a reliable way to count new patients entering the practice. Reflecting this development, Figure 3 reports the number of established patient visits per FTE HemOnc as a measure of work output and shows that output was fairly steady over the period. Physicians did the same amount of clinical work through the 6-year study period, and the least squares linear fit suggests that this may remain about the same or perhaps decline slightly through 2013.
Figure 3.
Number of established patient visits per full-time equivalent hematology-oncology physician (FTE HemOnc).
Unlike faster collection or inventory reduction, these increases in work output, particularly as demonstrated by the growth in new patient volume from 2003 to 2007, have led to durable gains in revenue. However, looking at the gains made in the most recent 5 years, we believe that practices have come about as far as is possible in the ability provide more service without increasing the number of FTE HemOncs required to provide these services.
Prediction 4: Labor Cost to Increase Faster Than Revenue
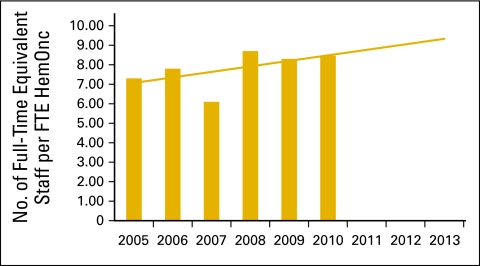
Figure 4 uses a least squares fit to project the trends in staffing associated with keeping oncology practices running. This is expressed in terms of full-time equivalent staff per FTE HemOnc.
Figure 4.
Full time equivalent staff per full-time equivalent hematology-oncology physician (FTE HemOnc).
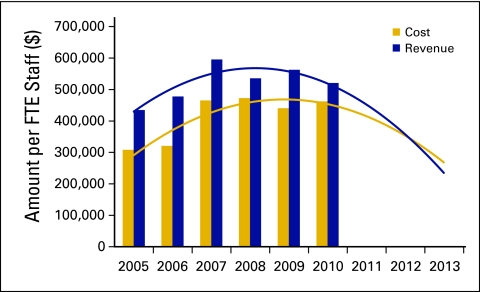
In a viable business environment, staff is added to meet production demand and production demand is driven by revenue-producing sales. Figure 5 presents total practice cost, defined as all cash expenses in the period including COGPF and physician compensation, and total practice revenue, defined as both medical and nonmedical revenue collected in the period, per FTE staff. The upward slope of the trend of total cost per FTE staff is less than the upward slope of the trend of revenue per FTE staff. When that is the case, the trend lines diverge and the area between the lines increases: costs are increasing slower than revenue and the business is expanding. Indeed, that was the experience in oncology during the “stable” years.
Figure 5.
Total practice cost and total revenue per full-time equivalent (FTE) staff.
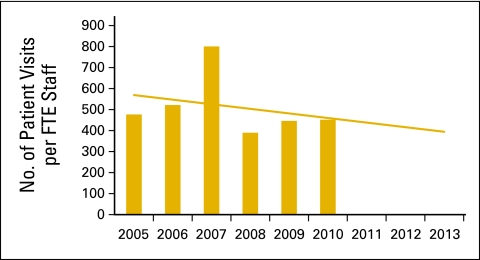
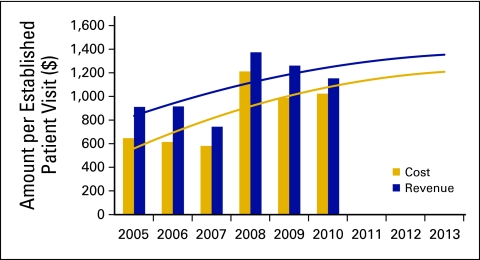
In Figure 5, however, we see this upward trend shift. Total practice cost and total practice revenue per FTE staff are convergent rather than divergent, with total cost growing faster than total revenue. Further analysis reveals that the increasing number of staff as reported in Figure 4 is not associated with increased clinical work demand. Figure 6 shows that the number of patient visits per FTE staff is decreasing. That means that staff are not being hired to support additional clinical work but for other activities such as regulatory compliance, patient financial counseling, information technology support, and many others that do not directly provide care to patients. Further support for this conclusion is seen in Figure 7, showing the cost and revenue trends per patient visit. To avoid business failure, staff costs must be reduced while revenue is sustained in 2011 and 2012.
Figure 6.
Patient visits per full-time equivalent (FTE) staff.
Figure 7.
Total practice cost and revenue per established patient visit.
Summary
In the next 3 years, operating margins will continue to decrease, gains in business and clinical operating efficiencies will slow, and labor costs will rise. The costs of practice operations are increasing, but these increasing costs are not being driven by increased revenue-generating clinical workloads. In addition, the cost of drugs provided to patients is increasing while the amount above cost that is being reimbursed continues a slow decline.
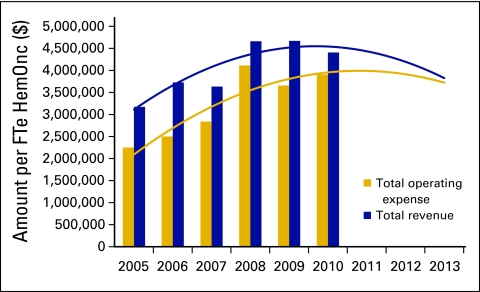
The cost reductions and production gains that were evidenced in 2005, 2006, and 2007 do not seem to be sustainable into the future. Practices have reached the limit at which increasing operating cost can be offset by gains in efficiency and/or production. Figure 8 shows the trends in total operating expense (total costs less physician compensation) and total practice revenue over the past 6 years and projects into the next 3 years. As the gap between cost and revenue narrows, the chance of business failure for this type of clinic operation increases.
Figure 8.
Total operating expense and total revenue per full-time equivalent hematology-oncology physician (FTE HemOnc).
Conclusion
As the economic model for community practice transitions from one that relied on the profit margin from drugs, the question becomes what is the next economic model that will continue to effectively deliver the majority of patient care. The potential to better match patients to therapy promised by new diagnostics and sophisticated tumor typing at the molecular and genetic levels is exciting. These advances may result in cost savings to the system. Clearly, appropriate use of these new tools will demand more physician time, not less. This will increase the workload and decrease revenue at the practice level. Although the benefits of new diagnostic and treatment tools are desired by everyone involved in cancer care—patients, providers, and payers—they cannot be delivered in the existing community oncology economic business model.
Authors' Disclosures of Potential Conflicts of Interest
Although all authors completed the disclosure declaration, the following author(s) indicated a financial or other interest that is relevant to the subject matter under consideration in this article. Certain relationships marked with a “U” are those for which no compensation was received; those relationships marked with a “C” were compensated. For a detailed description of the disclosure categories, or for more information about ASCO's conflict of interest policy, please refer to the Author Disclosure Declaration and the Disclosures of Potential Conflicts of Interest section in Information for Contributors.
Employment or Leadership Position: Thomas R. Barr, Oncology Metrics, a division of Altos Solutions (C) Elaine L. Towle, Oncology Metrics, a division of Altos Solutions (C) Consultant or Advisory Role: None Stock Ownership: None Honoraria: None Research Funding: None Expert Testimony: None Other Remuneration: None
Author Contributions
Conception and design: Thomas R. Barr, Elaine L. Towle
Administrative support: Thomas R. Barr, Elaine L. Towle
Collection and assembly of data: Thomas R. Barr, Elaine L. Towle
Data analysis and interpretation: Thomas R. Barr, Elaine L. Towle
Manuscript writing: Thomas R. Barr, Elaine L. Towle
Final approval of manuscript: Thomas R. Barr, Elaine L. Towle
References
- 1.Barr TR, Towle EL. National Oncology Practice Benchmark: An annual assessment of financial and operational parameters—2010 report on 2009 data. J Oncol Pract. 2011;7(suppl):2s–15s. doi: 10.1200/JOP.2011.000223. [DOI] [PMC free article] [PubMed] [Google Scholar]
- 2.Akscin J, Barr TR, Towle EL. Benchmarking practice operations: Results from a survey of office-based oncology practices. J Oncol Pract. 2007;3:9–12. doi: 10.1200/JOP.0712504. [DOI] [PMC free article] [PubMed] [Google Scholar]
- 3.Akscin J, Barr TR, Towle EL. Key practice indicators in office-based oncology practices: 2007 report on 2006 data. J Oncol Pract. 2007;3:200–203. doi: 10.1200/JOP.0743001. [DOI] [PMC free article] [PubMed] [Google Scholar]
- 4.Barr TR, Towle EL, Jordan WM. The 2007 national practice benchmark: Results of a national survey of oncology practices. J Oncol Pract. 2008;4:178–183. doi: 10.1200/JOP.0843501. [DOI] [PMC free article] [PubMed] [Google Scholar]
- 5.Towle EL, Barr TR. 2009 national practice benchmark: Report on 2008 data. J Oncol Pract. 2009;5:223–227. doi: 10.1200/JOP.091017. [DOI] [PMC free article] [PubMed] [Google Scholar]
- 6.Towle EL, Barr TR. National practice benchmark: 2010 report on 2009 data. J Oncol Pract. 2010;6:228–231. doi: 10.1200/JOP.000121. [DOI] [PMC free article] [PubMed] [Google Scholar]
- 7.Medical Group Management Association. Englewood, CO: Medical Group Management Association; 2001. Cost Survey for Hematology/Oncology Practices: 2001 Report Based on 2000 Data. [Google Scholar]
- 8.Medical Group Management Association. Englewood, CO: Medical Group Management Association; 2003. Cost Survey for Hematology/Oncology Practices: 2003 Report Based on 2002 Data. [Google Scholar]
- 9.Medical Group Management Association. Englewood, CO: Medical Group Management Association; 2004. Cost Survey for Hematology/Oncology Practices: 2004 Report Based on 2003 Data. [Google Scholar]
- 10.Barr TR. Practice efficiency and practice quality: Flip sides of the same coin. J Oncol Pract. 2008;4:90–93. doi: 10.1200/JOP.0826501. [DOI] [PMC free article] [PubMed] [Google Scholar]
- 11.Medical Group Management Association. Englewood, CO: Medical Group Management Association; 2003. Cost Survey for Hematology/Oncology Practices: 2003 Report Based on 2002 Data. [Google Scholar]


