

Abstract
The incidence of insulin resistance has increased dramatically over the past several years, and we and others have proposed that this increase may at least in part be attributable to increased dietary fructose consumption. However, a major limitation to the study of diet‐induced insulin resistance is the lack of relevant animal models. Numerous studies, mostly in rodents, have demonstrated that diets high in fructose induce insulin resistance; however, important metabolic differences exist between rodents and primates. Thus, the results of metabolic studies performed in primates are substantively more translatable to human physiology, underscoring the importance of establishing nonhuman primate models of common metabolic conditions. In this report, we demonstrate that a high‐fructose diet in rhesus monkeys produces insulin resistance and many features of the metabolic syndrome, including central obesity, dyslipidemia, and inflammation within a short period of time; moreover, a subset of monkeys developed type 2 diabetes. Given the rapidity with which the metabolic changes occur, and the ability to control for many factors that cannot be controlled for in humans, fructose feeding in rhesus monkeys represents a practical and efficient model system in which to investigate the pathogenesis, prevention, and treatment of diet‐induced insulin resistance and its related comorbidities. Clin Trans Sci 2011; Volume 4: 243–252
Keywords: rhesus monkey, fructose, insulin resistance, metabolic syndrome, type 2 diabetes
Introduction
The metabolic syndrome represents a combination of physical and biochemical findings including central adiposity, hypertension, dyslipidemia, inflammation, and impaired glucose tolerance that predispose affected individuals to atherosclerotic cardiovascular disease (ASCVD) and type 2 diabetes mellitus (T2DM). 1 , 2 , 3 , 4 , 5 , 6 Insulin resistance is the key metabolic feature of the metabolic syndrome, 3 , 4 , 5 , 6 and in addition to ASCVD and T2DM is considered to play a major role in the pathogenesis of hepatic steatosis, polycystic ovary disease, and certain forms of cancer. 7 One in three to four adults in the United States currently has metabolic syndrome, and over 90% of individuals with diabetes are insulin resistant; thus, insulin resistance and its related metabolic disturbances are a significant cause of morbidity and mortality.
The incidence and prevalence of insulin resistance and metabolic syndrome in the United States has increased dramatically over the past several years, 5 , 6 , 8 and we and others have proposed that this increase may in part be attributable to increased consumption of fructose derived from dietary sugars, principally sucrose and high‐fructose corn syrup (HFCS). 9 , 10 , 11 Fructose intake in countries adopting a Western diet has increased markedly over the past three decades. In the United States alone, yearly per capita caloric sweetener consumption is estimated to have risen approximately 20% since 1970, 12 coinciding with the obesity epidemic, and recent self‐reported food intake data from the National Health and Nutrition Examination Survey (NHANES) suggest that approximately 15% of the US population consumes ≥25% of energy from added sugars. 13 Sugar‐sweetened beverages (SSBs) in particular are the largest source of added sugars in the Western diet, accounting for more than 10% of energy intake; 14 their consumption increased by approximately 135% between 1977 and 2001, 15 contributing to an increase in the consumption of all caloric sweeteners of approximately 83 kcal/person/day. 16 Importantly, increased fructose consumption from sucrose (50% fructose) or HFCS (42–55% fructose), particularly in the form of SSBs, has also been implicated in promoting weight gain, visceral adiposity, dyslipidemia, and insulin resistance/glucose intolerance 9 , 10 , 11 , 17 , 18 , 19 —all components of the metabolic syndrome.
A major limitation to the study of the metabolic syndrome and T2DM in humans, and particularly the pathogenesis of these disorders and their related metabolic abnormalities, is the lack of relevant animal models with which to rigorously investigate the progression and biological mechanisms of the disease processes. Numerous animal studies, mostly conducted in rodents, have shown that diets high in fructose produce metabolic perturbations associated with the metabolic syndrome and T2DM. 10 , 20 However, important metabolic differences exist between rodents and primates, particularly with respect to lipoprotein metabolism, the major site of lipogenesis (liver vs. adipose), and the physiology of thermogenesis. Therefore, the results of metabolic studies performed in primates are substantively more applicable to human physiology and medicine than those from rodent studies, underscoring the importance of developing standardized nonhuman primate models of insulin resistance for the study of metabolic syndrome and T2DM.
Many characteristics of the rhesus monkey (Macaca mulatta) make the species ideal for this purpose. They are relatively large animals, are easy to maintain in captivity, and have a lifespan of approximately 25 years, making them suitable for long‐term dietary and disease prevention and intervention studies. Furthermore, compared with rodents, they exhibit greater similarity to human physiology and susceptibility to metabolic diseases, 21 and have been shown to develop insulin resistance, dyslipidemia, hypertension, and T2DM with adult‐onset obesity. 22 , 23 In addition, the rhesus monkey genome has been sequenced, 21 , 24 enabling comparative genetic studies with humans. The human and rhesus monkey genomes are approximately 93% similar, and the two species are believed to have shared a common ancestor approximately 25 million years ago. 21 In contrast, and again underscoring the importance of nonhuman primates in biomedical research, rodents are believed to have separated from humans greater than 70 million years ago. 25 , 26 Although the chimpanzee and human genomes, which diverged approximately 6 million year ago, are approximately 98% identical, most of the differences in both the rhesus monkey and chimpanzee genomes are on the level of gene rearrangements rather than single gene mutations, preserving the closeness of their phenotype with humans and validating the use of the rhesus monkey as a primate model in which to study human diseases.
Through our collaborations with the California National Primate Research Center (CNPRC), our laboratory has previously used rhesus monkeys to successfully study complex human metabolic traits. 27 , 28 , 29 , 30 , 31 Importantly, the results derived from those studies have paralleled the results of later studies performed in humans, 32 , 33 reinforcing the utility of the rhesus monkey as an animal model for investigating the physiology of human metabolism and the pathophysiology of metabolic derangements. Moreover, studies performed in rhesus monkeys have been instrumental in enhancing our understanding of the autonomic regulation of glucagon secretion in response to insulin‐induced hypoglycemia, 34 the autonomic response to meal‐induced insulin secretion, 29 the pharmacokinetics of leptin, 35 the autonomic effects of leptin, 36 comparing the endocrine and metabolic effects of glucose and fructose, 30 , 31 and investigating new therapeutic strategies for the treatment of insulin resistance. 37
We recently reported that consumption of fructose‐sweetened beverages at 25% of daily energy requirements in older, overweight/obese men and women increases visceral adipose deposition and de novo lipogenesis, produces dyslipidemia, and decreases glucose tolerance/insulin sensitivity. 19 Since the commonly consumed dietary sugars, sucrose and HFCS, consist of 50% and 42–55% fructose, respectively, these results provide a potential mechanistic link between sugar consumption and metabolic disease. Accordingly, we have been conducting studies evaluating the long‐term metabolic effects of fructose consumption in rhesus monkeys in parallel with our clinical research in humans. Specifically, we hypothesized that rhesus monkeys consuming fructose‐sweetened beverages for 1 year would develop components of the metabolic syndrome, including insulin resistance and dyslipidemia. Furthermore, given the long‐term time course of the intervention, we hypothesized that a subset of the animals might develop overt T2DM.
Materials and Methods
Animals
The rhesus monkeys used for this study were provided by the California National Primate Research Center (CNPRC) and maintained at the CNPRC at the University of California, Davis. Protocols for all the animal studies were approved by the University of California, Davis Institutional Animal Care and Use Committee and conducted in accordance with the Department of Agriculture Animal Welfare Act and the National Institutes of Health’s Guide for the Care and Use of Laboratory Animals. A total of 29 adult male rhesus monkeys, age 12–20 years (body weight 16.3 ± 0.4 kg) were studied. At baseline, all monkeys had fasting plasma glucose concentrations <100 mg/dL, fasting insulin concentrations <100 μU/mL, fasting plasma TG concentrations <100 mg/dL, and a percent body fat >20%.
Diet and energy intake measurements
A commercial monkey chow diet (Lab Diets 5047, Advance Protocol Old World Primate; PMI, St. Louis, MO, USA) was provided ad libitum to all the monkeys. This is a grain‐based standard primate diet that provides 30% energy as protein, 11% energy as fat, and 59% energy as carbohydrate. In addition, all monkeys were provided 500 mL/day of a fruit‐flavored (Kool‐Aid, Kraft Foods, Northfield, IL, USA) 15% fructose‐sweetened beverage (75 g of fructose). Beverage intake was recorded daily and food intake was recorded for 1 week at baseline, and then for 1‐week periods at 3‐month intervals during the 12‐month‐study period.
Energy expenditure
Metabolic rate measurements were performed at the CNPRC Exposure Facility. The system consisted of two airtight 32″h × 27″d × 24″w chambers. Positive airflow into the chambers was regulated with a mass flow controller and was set at a rate of 21 mL/min. A reference line and sample lines to the two chambers were connected to a multiplexer to allow for serial sampling of the three lines. A flow controller with a negative flow rate of 100 mL/min pulled the sample through the multiplexer, then through a CO2 analyzer (AEI Technologies, Pittsburgh, PA, USA), drierite column, and O2 analyzer (AEI Technologies). The multiplexer switched between the three lines at 10‐minute intervals, thereby allowing a measurement to be taken from each chamber at 30‐minute intervals. Each 10‐minute interval consisted of three CO2 and O2 readings which were averaged and recorded using a data acquisition system and LabView software (National Instruments, Austin, TX, USA). Energy expenditure was then calculated using the Weir equation. 38 Monkeys were put into the chambers between 7 and 9 AM along with their fructose beverage plus ad libitum food and water, left in the chambers overnight and returned to their home cages the following morning. They rested for a day and then were put back in the metabolic chambers for another measurement. This was repeated for a total of four metabolic rate measurements for each animal. The mean of the four measurements was calculated for the final data set. The AUC was calculated using the trapezoidal method.
Body weight and body adiposity
Animal body weight was determined monthly. At baseline, 6 months, and 12 months, percent and total body fat were determined by dual‐energy x‐ray absorptiometry (DEXA), a sensitive technique for measuring body fat, 39 which has been previously validated for the determination of body composition in monkeys. 40
Intravenous glucose tolerance tests (IVGTTs)
At baseline, 6 months, and then 12 months, IVGTTs were performed. For each test, the animals were anesthetized with ketamine (10 mg/kg IM) and an intravenous (IV) catheter was inserted in each arm vein. Supplemental ketamine was given as an IV infusion at a rate of 0.25–1.0 mg/kg/min, and the infusion rate adjusted to maintain a stable plane of anesthesia as assessed by monitoring blood pressure, heart rate, respiratory rate, and muscle tone. Three baseline samples (3 mL) were collected from one catheter at –10, –5, and 0 minutes. Subsequently, 600 mg/kg of 50% dextrose was administered via the contralateral catheter. Additional 3 mL blood samples were collected at 1, 3, 5, 10, 15, 20, 30, 40, and 60 minutes. The AUC for glucose and insulin during the IVGTTs was calculated using the trapezoidal method, and glucose tolerance was estimated by the area above baseline under the glucose curve from 0 to 60 minutes. An index of insulin sensitivity was calculated by dividing the slope of the glucose disappearance between 5 and 20 minutes (when it is quite linear) by the area under the insulin curve as described previously. 37 We have also demonstrated that measuring deuterated glucose disposal (a technique that has been validated with hyperinsulinemic euglycemic clamps in humans), we obtain results that are highly correlated (r 2= 0.84, p < 0.001) with the insulin sensitivity index calculated with the slope of the glucose disappearance.
Glucose, insulin, and HOMA‐IR
Plasma insulin concentrations were measured using an RIA (Millipore, St. Charles, MO, USA), and plasma glucose levels were measured with a YSI Glucose Analyzer (Yellow Springs, OH, USA). The HOMA‐IR was calculated using the following equation: ([fasting glucose (mmol/L) × fasting insulin (μU/mL)]/22.5). 41
Lipid and lipoproteins
Total cholesterol, HDL‐C, LDL‐C, TG, apoA1, apoB, and apoC3 concentrations were determined using a Polychem Chemistry Analyzer (PolyMedCo, Inc. Cortlandt Manor, NY, USA). Oxidized LDL‐C levels were measured with a commercially available ELISA (Mercodia, Inc., Winston Salem, NC, USA).
Adipocyte hormones
Plasma total adiponectin was measured using an RIA (Millipore), and HMW adiponectin oligomer concentrations were measured by ELISA (Alpco, Salem, NH, USA). Plasma leptin concentrations were measured by RIA (Linco Research Inc., St. Charles, MO, USA).
Proinflammatory markers
Plasma CRP levels were measured using a Polychem Chemistry Analyzer (PolyMedCo, Inc.), and plasma MCP‐1 and PAI‐1 concentrations were measured by ELISA (R&D Systems, Minneapolis, MN, USA).
Statistical analysis
Values are presented as the mean ± SEM. In the monkeys that developed metabolic syndrome but not T2DM (n= 25), a linear mixed model was used to assess the longitudinal trend of the data. This model incorporates random intercepts for each of the monkeys to account for repeated measures, and time was regarded as a multilevel categorical variable. Prior to the analyses, the distributions of each outcome variable were assessed for normality; for those outcome variables with skewed distributions, log transformations were applied to meet the normality assumptions of the linear mixed model. For all outcome variables, the magnitudes of change between baseline and each follow‐up measurement was calculated, along with corresponding 95% confidence intervals and p values. For each outcome requiring a transformation, the estimated differences between time points were back transformed to represent the geometric means with corresponding 95% confidence intervals and p values. Percent differences (Δ%) from baseline to 6 and 12 months for each outcome variable were calculated using arithmetic or geometric means from the linear mixed models, with p values corresponding to the difference in model‐based means at each time point from baseline. All trend analyses were performed using the statistical software R 2.10.0 (http://www.r‐project.org). In addition, the Pearson’s correlation coefficient (r) between the HOMA‐IR and ISI values at each time point was calculated using the Stata data analysis and statistical software package (StataCorp LP, College Station, TX, USA). Given that the number of monkeys that developed diabetes throughout the course of the study was small (n= 4), only descriptive statistics are presented for the outcome variables in these animals, and the percent differences (Δ%) from baseline to 6 and 12 months for each outcome variable were calculated using raw means.
Results
Study cohort. During the course of the 12‐month study, every monkey (n= 29) developed components of the metabolic syndrome (principally increased body adiposity, insulin resistance, and dyslipidemia); four monkeys (∼15% of the study cohort) developed frank T2DM (defined by a fasting blood glucose concentration ≥126 mg/dL).
Body weight, body fat, energy intake, and energy expenditure. In the monkeys that did not develop diabetes, body weight increased from 16.4 ± 0.4 kg at baseline to 17.9 ± 0.6 kg at 12 months (+9%, p≤ 0.001, Figure 1A ). In addition, fat mass increased by +29% at 6 months, (p < 0.001) and +34% at 12 months (p≤ 0.001) ( Figure 1B ), as did percent body fat (+16% at 6 months, p≤ 0.001; +15% at 12 months, p≤ 0.001). Average daily energy intake increased by 26 kcal/day during the study period ( Figure 1C ), whereas average daily energy expenditure decreased (−13% at 6 months, p≤ 0.001; − 10% at 12 months, p≤ 0.01) ( Figure 1D ). In particular, the animals showed a progressive decrease in fat oxidation throughout the study period (23.0 ± 2.4 mg/min/kg × 21 hr at baseline vs. 22.5 ± 1.3 mg/min/kg × 21 hr at 6 months vs. 20.3 ± 1.7 mg/min/kg × 21 hr at 12 months). Although all the monkeys initially gained weight on the high‐fructose diet, the monkeys that subsequently developed diabetes lost weight after they became hyperglycemic and glycosuric, and had no net overall change of body weight (15.8 ± 0.3 kg at baseline vs. 15.6 ± 0.5 kg at 12 months).
Figure 1.
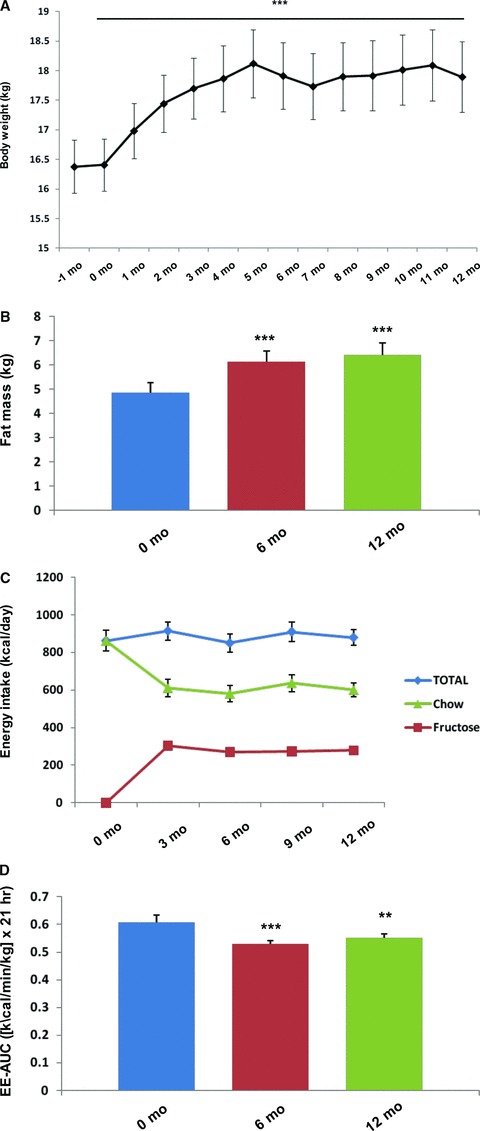
The effect of a high‐fructose diet on (A) body weight, (B) fat mass, (C) energy intake, and (D) energy expenditure in rhesus monkeys with diet‐induced metabolic syndrome. *p≤ 0.05, **p≤ 0.01, ***p≤ 0.001 versus baseline by linear mixed model. Error bars show SEM.
Fasting glucose and insulin concentrations, glucose tolerance, and insulin sensitivity.
In the majority of the monkeys studied, exposure to the high‐fructose diet did not result in overt diabetes and fasting glucose concentrations did not change (72 ± 2 mg/dL at baseline and 12 months). However, fasting insulin concentrations increased dramatically (+121% at 6 months, p≤ 0.001; +95% at 12 months, p≤ 0.001), indicative of β‐cell compensation for insulin resistance ( Table 1 ). Furthermore, the area under the curve (AUC) for both glucose and insulin concentrations during intravenous glucose tolerance testing in the nondiabetic animals increased (AUC glucose: +18% at 6 months, p≤ 0.001; +20% at 12 months, p≤ 0.001; AUC insulin: +76% at 6 months, p≤ 0.001; +70% at 12 months, p≤ 0.001) (Figure 2A and B), and the calculated insulin sensitivity index (ISI) decreased (−31% at 6 months, p≤ 0.01; −41% at 12 months, p≤ 0.001). In addition, the calculated homeostasis model of insulin resistance (HOMA‐IR) values and ISI values were significantly correlated at each time point (r= 0.60 at baseline, p≤ 0.01; r= 0.55 at 6 months, p≤ 0.05; r= 0.68 at 12 months, p≤ 0.001) throughout the study. In the monkeys that developed diabetes, fasting glucose concentrations increased (79 ± 3 mg/dL at baseline vs. 171 ± 7 mg/dL at 12 months), whereas the increases of fasting insulin concentrations were insufficient to prevent hyperglycemia, suggesting inadequate β‐cell compensation. The AUC for glucose levels during intravenous glucose tolerance testing also progressively increased from baseline during the study period, suggesting worsening glucose disposal (Figure 2C). As expected, the AUC for insulin concentrations in the diabetic animals dramatically decreased due to progressive β‐cell insufficiency (Figure 2D).
Table 1.
The effects of a high‐fructose diet on fasting glucose and insulin concentrations, glucose tolerance, and insulin sensitivity during an intravenous glucose tolerance test in rhesus monkeys.
| Monkeys with metabolic syndrome | Monkeys with diabetes | |||||||
|---|---|---|---|---|---|---|---|---|
| Measurement | n | Time | Result | Δ% | n | Time | Result | Δ% |
| Glucose (mg/dL) | 25 | Baseline | 72 ± 2 | 4 | Baseline | 79 ± 3 | ||
| 6 months | 73 ± 2 | – | 6 months | 114 ± 13 | +44% | |||
| 12 months | 72 ± 2 | – | 12 months | 171 ± 7 | +116% | |||
| Insulin (μU/mL) | 25 | Baseline | 54 ± 8 | 4 | Baseline | 133 ± 58 | ||
| 6 months | 148 ± 29 | +121%c | 6 months | 252 ± 149 | +89% | |||
| 12 months | 121 ± 26 | +95%c | 12 months | 184 ± 117 | +38% | |||
| AUC glucose | 19 | Baseline | 9,339 ± 566 | 2 | Baseline | 12,890 ± 587 | ||
| 6 months | 10,991 ± 573 | +18%c | 6 months | 13,078 ± 1276 | +2% | |||
| 12 months | 11,172 ± 397 | +20%c | 12 months | 13,352 ± 2,555 | +4% | |||
| AUC insulin | 19 | Baseline | 16,239 ± 3,241 | 2 | Baseline | 7,337 ± 1080 | ||
| 6 months | 33,953 ± 10,322 | +76%c | 6 months | 1,690 ± 1,220 | −77% | |||
| 12 months | 28,053 ± 6,840 | +70%c | 12 months | 673 ± 322 | −91% | |||
| Insulin sensitivity | 19 | Baseline | 0.69 ± 0.11 | |||||
| Index | 6 months | 0.48 ± 0.08 | −31%b | |||||
| 12 months | 0.41 ± 0.09 | −41%c | ||||||
Mean ± SEM.
ap ≤ 0.05; bp ≤ 0.01; cp ≤ 0.001.
Abbreviations: AUC, area under the curve.
Figure 2.
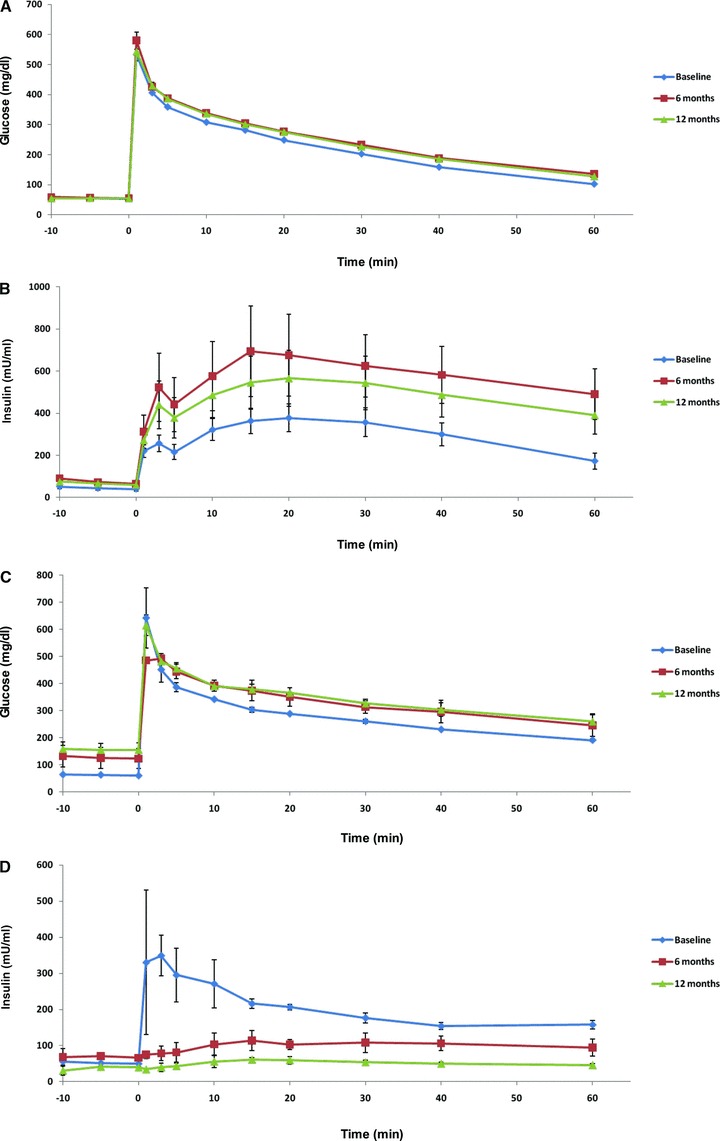
The glucose (A) and insulin (B) responses during intravenous glucose tolerance testing in rhesus monkeys with diet‐induced metabolic syndrome, and the glucose (C) and insulin (D) responses during intravenous glucose tolerance testing in rhesus monkeys with diet‐induced diabetes. Error bars show SEM.
Fasting lipid and lipoprotein concentrations. In the normoglycemic, insulin resistant monkeys, fasting triglyceride (TG) concentrations increased (+61% at 6 months, p≤ 0.001; +87% at 12 months, p≤ 0.001) and fasting high‐density lipoprotein cholesterol (HDL‐C) levels decreased (−13% at 6 months, p≤ 0.01; − 14% at 12 months, p≤ 0.01) during the course of the study ( Table 2 ). Fasting total cholesterol (TC) concentrations did not change, nor did fasting low‐density lipoprotein cholesterol (LDL‐C) or oxidized LDL‐C (oxLDL‐C) levels. Furthermore, fasting apolipoprotein B (ApoB) concentrations did not change during the study period. However, fasting apolipoprotein A1 (ApoA1) levels decreased (−9% at 6 months, p≤ 0.01; 25% at 12 months, p≤ 0.05) and fasting apolipoprotein C3 (ApoC3) levels increased (+14% at 12 months, p≤ 0.01). In the monkeys that developed diabetes, fasting TC concentrations, LDL‐C concentrations, oxLDL‐C concentrations, TG concentrations, and ApoC3 concentrations all increased over the course of the study, while fasting HDL‐C levels and ApoA1 concentrations decreased.
Table 2.
The effects of a high‐fructose diet on fasting lipid and lipoprotein concentrations in rhesus monkeys.
| Monkeys with metabolic syndrome | Monkeys with diabetes | |||||||
|---|---|---|---|---|---|---|---|---|
| Measurement | n | Time | Result | Δ% | n | Time | Result | Δ% |
| Cholesterol (mg/dL) | 25 | Baseline | 163 ± 6 | 4 | Baseline | 153 ± 11 | ||
| 6 months | 154 ± 7 | −6% | 6 months | 154 ± 8 | – | |||
| 12 months | 159 ± 8 | −4% | 12 months | 232 ± 48 | +52% | |||
| LDL‐C (mg/dL) | 19 | Baseline | 74 ± 4 | 2 | Baseline | 70 ± 4 | ||
| 6 months | 66 ± 5 | −14% | 6 months | 70 ± 6 | – | |||
| 12 months | 78 ± 7 | +3% | 12 months | 101 ± 2 | +44% | |||
| OxLDL‐C (U/l) | 25 | Baseline | 24.1 ± 1.8 | 4 | Baseline | 25.1 ± 1.4 | ||
| 6 months | 23.5 ± 1.7 | −2% | 6 months | 31.6 ± 3.0 | +26% | |||
| 12 months | 26.3 ± 2.4 | +6% | 12 months | 54.4 ± 9.0 | +117% | |||
| HDL‐C (mg/dL) | 25 | Baseline | 72 ± 3 | 4 | Baseline | 65 ± 12 | ||
| 6 months | 62 ± 4 | −13%b | 6 months | 45 ± 7 | −31% | |||
| 12 months | 62 ± 4 | −14%b | 12 months | 39 ± 5 | −40% | |||
| TG (mg/dL) | 25 | Baseline | 79 ± 9 | 4 | Baseline | 94 ± 23 | ||
| 6 months | 134 ± 18 | +61%c | 6 months | 322 ± 82 | +243% | |||
| 12 months | 155 ± 19 | +87%c | 12 months | 680 ± 239 | +623% | |||
| Apo A1 (mg/dL) | 19 | Baseline | 134 ± 3 | 2 | Baseline | 111 ± 3 | ||
| 6 months | 122 ± 4 | −9%b | 6 months | 94 ± 4 | −15% | |||
| 12 months | 126 ± 3 | −5%a | 12 months | 73 ± 13 | −34% | |||
| Apo B (mg/dL) | 19 | Baseline | 46.8 ± 2.6 | 2 | Baseline | 48.2 ± 1.8 | ||
| 6 months | 43.4 ± 2.9 | −7% | 6 months | 47.0 ± 6.0 | −2% | |||
| 12 months | 47.7 ± 3.4 | +2% | 12 months | 64.0 ± 1.5 | +33% | |||
| Apo C3 (mg/dL) | 23 | Baseline | 4.74 ± 0.19 | 4 | Baseline | 5.03 ± 0.41 | ||
| 6 months | 5.17 ± 0.37 | +4% | 6 months | 7.40 ± 0.23 | +47% | |||
| 12 months | 5.46 ± 0.28 | +14%b | 12 months | 10.15 ± 1.81 | +102% | |||
Mean ± SEM.
ap ≤ 0.05; bp ≤ 0.01; cp ≤ 0.001.
Abbreviations: LDL‐C, low‐density lipoprotein cholesterol; oxLDL‐C, oxidized low‐density lipoprotein cholesterol; HDL‐C, high‐density lipoprotein cholesterol; TG, triglycerides; Apo, apolipoprotein.
Adipocyte hormones. In the normoglycemic monkeys with metabolic syndrome, fasting plasma leptin concentrations increased over the course of the study (+40% at 6 months, p≤ 0.001; +42% at 12 months, p≤ 0.001) in parallel with the increases of body weight and adiposity ( Table 3 ). Alternatively, both fasting total adiponectin levels (−27% at 6 months, p≤ 0.001; − 28% at 12 months, p≤ 0.001) and fasting high molecular weight (HMW) adiponectin levels (−44% at 6 months, p≤ 0.001; − 47% at 12 months, p≤ 0.001) decreased in parallel with the monkeys’ decreased insulin sensitivity. The ratio of HMW to total adiponectin decreased as well (−16% at 6 months, p≤ 0.01; 220% at 12 months, p≤ 0.001). In the diabetic monkeys, fasting plasma leptin concentrations initially increased while the animals were gaining weight; however, once the animals became hyperglycemic, glucosuric, and began to lose weight, fasting plasma leptin levels declined. Furthermore, like in the insulin resistant monkeys, both fasting total and HMW adiponectin levels, as well as the HMW/total adiponectin ratio, decreased in the diabetic animals.
Table 3.
The effects of a high‐fructose diet on adipocyte hormones in rhesus monkeys.
| Monkeys with metabolic syndrome | Monkeys with diabetes | |||||||
|---|---|---|---|---|---|---|---|---|
| Measurement | n | Time | Result | Δ% | n | Time | Result | Δ% |
| Total adiponectin (μg/mL) | 23 | Baseline | 7.12 ± 0.95 | 4 | Baseline | 5.44 ± 0.97 | ||
| 6 months | 5.06 ± 0.74 | −27%c | 6 months | 4.47 ± 0.02 | −18% | |||
| 12 months | 5.05 ± 0.64 | −28%c | 12 months | 3.17 ± 1.00 | −42% | |||
| HMW adiponectin (μg/mL) | 25 | Baseline | 2.25 ± 0.34 | 4 | Baseline | 1.63 ± 0.51 | ||
| 6 months | 1.31 ± 0.22 | −44%c | 6 months | 0.88 ± 0.35 | −46% | |||
| 12 months | 1.23 ± 0.19 | −47%c | 12 months | 0.96 ± 0.38 | −41% | |||
| HMW/Total adiponectin | 25 | Baseline | 0.281 ± 0.016 | 4 | Baseline | 0.270 ± 0.060 | ||
| 6 months | 0.237 ± 0.017 | −16%b | 6 months | 0.320 ± 0.036 | +18% | |||
| 12 months | 0.224 ± 0.015 | −20%c | 12 months | 0.252 ± 0.058 | −7% | |||
| Leptin (ng/mL) | 25 | Baseline | 8.96 ± 0.89 | 4 | Baseline | 9.75 ± 1.53 | ||
| 6 months | 12.53 ± 1.05 | +40%c | 6 months | 11.74 ± 2.42 | +20% | |||
| 12 months | 12.77 ± 0.86 | +42%c | 12 months | 9.10 ± 2.32 | −7% | |||
Mean ± SEM.
ap ≤ 0.05; bp ≤ 0.01; cp ≤ 0.001.
Abbreviations: HMW, high molecular weight.
Fasting proinflammatory marker concentrations. In the nondiabetic monkeys with metabolic syndrome, plasma C‐reactive protein (CRP) concentrations increased (+77% at 6 months, p≤ 0.001; +71% at 12 months, p≤ 0.001) ( Table 4 ). Although fasting monocyte chemotactic protein‐1 (MCP‐1) and plasminogen activator inhibitor‐1 (PAI‐1) levels also increased, the results were only significant for MCP‐1 (+36% at 6 months, p≤ 0.001). In the diabetic monkeys, CRP and MCP‐1 concentrations increased, whereas PAI‐1 levels decreased.
Table 4.
The effects of a high‐fructose diet on proinfl ammatory markers in rhesus monkeys.
| Monkeys with metabolic syndrome | Monkeys with diabetes | |||||||
|---|---|---|---|---|---|---|---|---|
| Measurement | n | Time | Result | Δ% | n | Time | Result | Δ% |
| CRP (mg/L) | 19 | Baseline | 1.63 ± 0.26 | 2 | Baseline | 1.49 ± 0.21 | ||
| 6 months | 2.60 ± 0.26 | +77%c | 6 months | 2.21 ± 0.71 | +48% | |||
| 12 months | 2.59 ± 0.27 | +71%c | 12 months | 1.98 ± 0.28 | +33% | |||
| MCP‐1 (pg/mL) | 23 | Baseline | 232 ± 20 | 4 | Baseline | 340 ± 141 | ||
| 6 months | 314 ± 27 | +36%c | 6 months | 450 ± 168 | +32% | |||
| 12 months | 289 ± 33 | +14% | 12 months | 451 ± 172 | +33% | |||
| PAI‐1 (ng/mL) | 19 | Baseline | 2.56 ± 0.55 | 2 | Baseline | 2.20 ± 0.36 | ||
| 6 months | 3.60 ± 0.62 | +45% | 6 months | 1.38 ± 1.01 | −37% | |||
| 12 months | 3.36 ± 0.78 | +17% | 12 months | 1.84 ± 1.28 | −16% | |||
Mean ± SEM.
ap ≤ 0.05; b≤ 0.01; cp ≤ 0.001.
Abbreviations: CRP, C‐reactive protein; MCP‐1, monocyte chemotactic protein‐1; PAI‐1, plasminogen activator inhibitor‐1.
Discussion
In this novel study, we demonstrate that fructose‐sweetened beverages are well tolerated by rhesus monkeys and that within a 6‐ to 12‐month period of time, consumption of a high‐fructose diet in monkeys produces many of the features of metabolic syndrome in humans, including central obesity, insulin resistance, inflammation, and dyslipidemia. In a subset of animals, the high‐fructose diet also results in overt T2DM. Thus, this rhesus monkey model of diet‐induced obesity, insulin resistance, and dyslipidemia is directly translatable to metabolic syndrome in humans. In addition, due to the rapidity with which the metabolic changes occur, this model presents a practical system with which to study the pathogenesis, prevention, and treatment of metabolic syndrome and T2DM and can serve as a means to evaluate these processes in long‐term studies with assured compliance in a manner that cannot practically be performed in humans.
Importantly, this diet‐induced nonhuman primate model will be useful in several active areas of investigation directly applicable to humans. First, since the genome of the rhesus macaque is known, 21 , 24 this model permits comparative studies with humans and the direct linkage of genotype with phenotype (insulin deficient and hyperglycemic vs. insulin sufficient and normoglycemic), and thus can provide important insight into the genes involved in the susceptibility for β‐cell failure and the development of T2DM versus metabolic syndrome. Given the serious clinical implications of diabetes and the increased risk for both macro‐ and microvascular complications in diabetic subjects, a further understanding of genetic factors contributing to diabetes is needed. This model offers a valuable opportunity to perform these types of genotype‐phenotype studies in a controlled fashion, and can lead to a better understanding of how genetic variability influences the development of insulin resistance and its treatment.
Second, the model permits the time‐ and cost‐effective study of new treatment strategies for insulin resistance‐associated metabolic disorders. Due to the high prevalence of insulin resistance and insulin resistance‐related conditions, and the estimate that diabetes will affect more than 324 million people worldwide by the year 2025, 42 many new and investigational agents are currently being generated to improve insulin sensitivity and prevent the onset of diabetes. 43 These compounds include insulin receptor tyrosine kinase and insulin mimetics, protein tyrosine phosphatase‐1B (PTP‐1B) inhibitors, glycogen synthase kinase‐3 (GSK3β) inhibitors, and inhibitors of Inhibitor KappaB Kinase (IKKβ). 43 Although many of these agents have been studied in vitro and in cultured mammalian cells, only a few have been studied in animals; and, those agents that have been evaluated in animals have mostly been in rodent models.
As proof of principle, our laboratory recently demonstrated the utility of this rhesus monkey model of diet‐induced metabolic syndrome in the evaluation of new pharmaceutical agents by investigating the effects of one of these novel agents, an antisense oligonucleotide (ASO) directed against PTP‐1B (ISIS 113715), in these animals. 37 Specifically, we demonstrated that treatment of obese, nondiabetic, insulin resistant rhesus monkeys with 20 mg/kg ISIS 113715 for 4 weeks reduced fasting plasma insulin concentrations by approximately 50%, reduced insulin responses during an intravenous glucose tolerance test by approximately 25%, and increased total and HMW adiponectin concentrations by approximately 70–100%. This therapeutic approach targeting PTP‐1B is currently in Phase 2 clinical trials in humans. Studies such as these thus reinforce the importance of establishing and having access to a well‐characterized nonhuman primate model of metabolic syndrome, and demonstrate the novel information that can be gained by producing insulin resistant monkeys with metabolic syndrome such that new approaches developed to improve insulin sensitivity and prevent/treat obesity, dyslipidemia, and T2DM in humans can be efficiently and effectively evaluated in targeted preclinical studies.
The model has some potential limitations. The first is the amount of fructose (∼30% of energy) provided to the animals. However, recent data suggest that approximately 15% of the US population consumes ≥25% of energy from added sugars. 13 Two recent reviews have suggested that long‐term sugar intakes as high as 25–50% of energy have no adverse effects with respect to components of the metabolic syndrome 44 and that fructose consumption up to 140 grams per day does not result in biologically relevant increases of fasting or postprandial TGs in healthy, normal weight humans. 45 However, these conclusions appear to be incorrect based on evidence from a number of studies and other reviews. 19 , 46 , 47 Another potential limitation is the lack of a “control” group not consuming fructose. However, we have previously conducted studies in humans designed to compare the metabolic effects of consuming fructose‐ versus glucose‐sweetened beverages for 10 weeks. 19 Rather, the objective of this study was to create a nonhuman primate model of diet‐induced insulin resistance and dyslipidemia (and not to compare the metabolic effects of fructose vs. glucose in the animals). Furthermore, although rhesus monkeys can spontaneously develop features of the metabolic syndrome, studies suggest heterogeneity in the rate of progression and timing of expression. 48 In our study, all animals developed features of the metabolic syndrome, usually within 6 months. Although it is possible that some of the animals may have developed metabolic syndrome spontaneously over time on a standard diet, the ingestion of a high‐fructose diet consistently and quickly resulted in the development of metabolic syndrome components. Finally, only males were used in the study because the CNPRC reserves female monkeys for breeding purposes. There may be some differences between the metabolic responses to a high‐fructose diet in male and female monkeys. However, based on our previous study in which we compared the long‐term metabolic consequences of consuming sugar‐sweetened beverages in men and women, 19 we would expect to also see reduced insulin sensitivity and altered lipid profiles in female monkeys.
Importantly, major advantages of using this novel rhesus monkey model of diet‐induced metabolic disease include the ability to (i) longitudinally perform repeated procedures (such as skeletal muscle, hepatic, and intraabdominal fat biopsies), and (ii) directly study the central nervous system and the neuroendocrine regulation of metabolism and weight homeostasis in a manner that cannot be performed in humans. Furthermore, use of this model ensures long‐term compliance with dietary and pharmaceutical interventions, minimizing the confounding variables that invariably exist in long‐term human studies.
Conclusions
Given the current trends in sugar consumption and the increasing incidence and prevalence of metabolic disorders and diabetes in the United States and worldwide, the development of a novel nonhuman primate animal model of diet‐induced metabolic syndrome and T2DM has important implications for translational research. We have successfully demonstrated that, like in humans, consumption of a high‐fructose diet in rhesus monkeys produces many of components of the metabolic syndrome; the adverse metabolic changes also occur rapidly (within 6 to 12 months), making the model practical for both prevention and treatment studies. Moreover, a subset of monkeys on a high‐fructose diet develop overt T2DM, permitting the ability to perform genotype‐phenotype studies in a controlled fashion evaluating the genetic factors involved in β‐cell failure. Thus, fructose‐fed rhesus monkeys represent a useful and efficient model system in which to systematically investigate the pathogenesis, prevention, and treatment of obesity, insulin resistance, dyslipidemia, and T2DM, and the model has significant translational potential to improve the understanding and treatment of metabolic disorders in humans.
Competing Interests
None.
Funding
This work was supported with funding from NIH grants R21 AT250099 and R21 AT003645 and the American Diabetes Association. The project also received support from the UC Davis Clinical and Translational Science Center (Grant Number UL1 RR024146). Dr. Havel’s laboratory also receives support from NIH grants R01 HL091333 and RC1 DK‐087307.
Acknowledgments
We thank Vanessa Bakula, Marinelle Nunez, Brian Tarkington, Jon Ramsey, Sarah Davis, and the staff of the California National Primate Research Center for their technical and logistical contributions to the study.
Author contributions: A.A.B. designed, drafted, and finished the final manuscript, and with P.J.H. designed the study and supervised data collection and analysis. J.L.G. supervised sample collections from the CNPRC and with K.L.S. and B.P.C. performed the assays. W.W. and B.R.S. supervised the statistical analyses. All authors edited the manuscript and approved the final version.
references
- 1. Reaven GM. Role of insulin resistance in human disease. Diabetes 1988; 37: 1595–1607. [DOI] [PubMed] [Google Scholar]
- 2. Reaven GM. Insulin resistance/compensatory hyperinsulinemia, essential hypertension, and cardiovascular disease. J Clin Endocrinol Metab 2003; 88: 2399–2403. [DOI] [PubMed] [Google Scholar]
- 3. Reaven GM. The metabolic syndrome or the insulin resistance syndrome? Different names, different concepts, and different goals. Endocrinol Metab Clin North Am 2004; 33: 283–303. [DOI] [PubMed] [Google Scholar]
- 4. Reaven GM. Compensatory hyperinsulinemia and the development of an atherogenic lipoprotein profile: the price paid to maintain glucose homeostasis in insulin‐resistant individuals. Endocrinol Metab Clin North Am 2005; 34: 49–62. [DOI] [PubMed] [Google Scholar]
- 5. Eckel RH, Grundy SM, Zimmet PZ. The metabolic syndrome. Lancet 2005; 365: 1415–1428. [DOI] [PubMed] [Google Scholar]
- 6. Cornier MA, Dabelea D, Hernandez TL, Lindstrom RC, Steig AJ, Stob NR, Van Pelt RE, Wang H, Eckel RH. The metabolic syndrome. Endocr Rev 2008; 29: 777–822. [DOI] [PMC free article] [PubMed] [Google Scholar]
- 7. Reaven GM. Why Syndrome X? From Harold Himsworth to the insulin resistance syndrome. Cell Metab 2005; 1: 9–14. [DOI] [PubMed] [Google Scholar]
- 8. Grundy SM. Metabolic syndrome pandemic. Arterioscler Thromb Vasc Biol 2008; 28: 629–636. [DOI] [PubMed] [Google Scholar]
- 9. Bray GA, Nielsen SJ, Popkin BM. Consumption of high‐fructose corn syrup in beverages may play a role in the epidemic of obesity. Am J Clin Nutr 2004; 79: 537–543. [DOI] [PubMed] [Google Scholar]
- 10. Havel PJ. Dietary fructose: implications for dysregulation of energy homeostasis and lipid/carbohydrate metabolism. Nutr Rev 2005; 63: 133–157. [DOI] [PubMed] [Google Scholar]
- 11. Malik VS, Popkin BM, Bray GA, Despres JP, Hu FB. Sugar‐sweetened beverages, obesity, type 2 diabetes mellitus, and cardiovascular disease risk. Circulation 2010; 121: 1356–1364. [DOI] [PMC free article] [PubMed] [Google Scholar]
- 12. Wells HF, Buzby, JC . A report from the Economic Research Service: Dietary assessment of major trends in U.S. food consumption, 1970–2005 (Economic Information Bulletin Number 33, United States Department of Agriculture, Washington , DC , 2008). [http://www.ers.usda.gov] [Google Scholar]
- 13. Marriott BP, Olsho L, Hadden L, Connor P. Intake of added sugars and selected nutrients in the United States, National Health and Nutrition Examination Survey (NHANES) 2003–2006. Crit Rev Food Sci Nutr 2010; 50: 228–258. [DOI] [PubMed] [Google Scholar]
- 14. Popkin BM, Armstrong LE, Bray GM, Caballero B, Frei B, Willett WC. A new proposed guidance system for beverage consumption in the United States. Am J Clin Nutr 2006; 83: 529–542. [DOI] [PubMed] [Google Scholar]
- 15. Nielsen SJ, Popkin BM. Changes in beverage intake between 1977 and 2001. Am J Prev Med 2004; 27: 205–210. [DOI] [PubMed] [Google Scholar]
- 16. Popkin BM, Nielsen SJ. The sweetening of the world’s diet. Obes Res 2003; 11: 1325–1332. [DOI] [PubMed] [Google Scholar]
- 17. Malik VS, Schulze MB, Hu FB. Intake of sugar‐sweetened beverages and weight gain: a systematic review. Am J Clin Nutr 2006; 84: 274–288. [DOI] [PMC free article] [PubMed] [Google Scholar]
- 18. Stanhope KL, Havel PJ. Fructose consumption: potential mechanisms for its effects to increase visceral adiposity and induce dyslipidemia and insulin resistance. Curr Opin Lipidol 2008; 19: 16–24. [DOI] [PMC free article] [PubMed] [Google Scholar]
- 19. Stanhope KL, Schwarz JM, Keim NL, Griffen SC, Bremer AA, Graham JL, Hatcher B, Cox CL, Dyachenko A, Zhang W. Consuming fructose‐sweetened, not glucose‐sweetened, beverages increases visceral adiposity and lipids and decreases insulin sensitivity in overweight/obese humans. J Clin Invest 2009; 119: 1322–1334. [DOI] [PMC free article] [PubMed] [Google Scholar]
- 20. Elliott SS, Keim NL, Stern JS, Teff K, Havel PJ. Fructose, weight gain, and the insulin resistance syndrome. Am J Clin Nutr 2002; 76: 911–922. [DOI] [PubMed] [Google Scholar]
- 21. Gibbs RA, Rogers J, Katze MG, Bumgarner R, Weinstock GM, Mardis ER, Remington KA, Strausberg RL, Venter JC, Wilson RK. Evolutionary and biomedical insights from the rhesus macaque genome. Science 2007; 316: 222–234. [DOI] [PubMed] [Google Scholar]
- 22. Bodkin NL, Nicolson M, Ortmeyer HK, Hansen BC. Hyperleptinemia: relationship to adiposity and insulin resistance in the spontaneously obese rhesus monkey. Horm Metab Res 1996; 28: 674–678. [DOI] [PubMed] [Google Scholar]
- 23. Hansen BC, Bodkin NL. Primary prevention of diabetes mellitus by prevention of obesity in monkeys. Diabetes 1993; 42: 1809–1814. [DOI] [PubMed] [Google Scholar]
- 24. Pennisi E. Boom time for monkey research. Science 2007; 316: 216–218. [DOI] [PubMed] [Google Scholar]
- 25. Gibbs RA, Weinstock GM, Metzker ML, Muzny DM, Sodergren EJ, Scherer S, Scott G, Steffen D, Worley KC, Burch PE. Genome sequence of the Brown Norway rat yields insights into mammalian evolution. Nature 2004; 428: 493–521. [DOI] [PubMed] [Google Scholar]
- 26. Kumar S, Hedges SB. A molecular timescale for vertebrate evolution. Nature 1998; 392: 917–920. [DOI] [PubMed] [Google Scholar]
- 27. Havel PJ, Valverde C. Autonomic mediation of glucagon secretion during insulin‐induced hypoglycemia in rhesus monkeys. Diabetes 1996; 45: 960–966. [DOI] [PubMed] [Google Scholar]
- 28. Ahren B, Havel PJ. Leptin increases circulating glucose, insulin and glucagon via sympathetic neural activation in fasted mice. Int J Obes Relat Metab Disord 1999; 23: 660–665. [DOI] [PubMed] [Google Scholar]
- 29. D’Alessio DA, Kieffer TJ, Taborsky GJ, Jr ., Havel PJ. Activation of the parasympathetic nervous system is necessary for normal meal‐induced insulin secretion in rhesus macaques. J Clin Endocrinol Metab 2001; 86: 1253–1259. [DOI] [PubMed] [Google Scholar]
- 30. Adams SH, Stanhope KL, Grant RW, Cummings BP, Havel PJ. Metabolic and endocrine profiles in response to systemic infusion of fructose and glucose in rhesus macaques. Endocrinology 2008; 149: 3002–3008. [DOI] [PMC free article] [PubMed] [Google Scholar]
- 31. Stanhope KL, Havel PJ. Endocrine and metabolic effects of consuming beverages sweetened with fructose, glucose, sucrose, or high‐fructose corn syrup. Am J Clin Nutr 2008; 88: 1733S–1737S. [DOI] [PMC free article] [PubMed] [Google Scholar]
- 32. Havel PJ, Ahren B. Activation of autonomic nerves and the adrenal medulla contributes to increased glucagon secretion during moderate insulin‐induced hypoglycemia in women. Diabetes 1997; 46: 801–807. [DOI] [PubMed] [Google Scholar]
- 33. Ahren B, Holst JJ. The cephalic insulin response to meal ingestion in humans is dependent on both cholinergic and noncholinergic mechanisms and is important for postprandial glycemia. Diabetes 2001; 50: 1030–1038. [DOI] [PubMed] [Google Scholar]
- 34. Taborsky GJ, Jr ., Ahren B, Havel PJ. Autonomic mediation of glucagon secretion during hypoglycemia: implications for impaired alpha‐cell responses in type 1 diabetes. Diabetes 1998; 47: 995–1005. [DOI] [PubMed] [Google Scholar]
- 35. Ahren B, Baldwin RM, Havel PJ. Pharmacokinetics of human leptin in mice and rhesus monkeys. Int J Obes Relat Metab Disord 2000; 24: 1579–1585. [DOI] [PubMed] [Google Scholar]
- 36. Tang‐Christensen M, Havel PJ, Jacobs RR, Larsen PJ, Cameron JL. Central administration of leptin inhibits food intake and activates the sympathetic nervous system in rhesus macaques. J Clin Endocrinol Metab 1999; 84: 711–717. [DOI] [PubMed] [Google Scholar]
- 37. Swarbrick MM, Havel PJ, Levin AA, Bremer AA, Stanhope KL, Butler M, Booten SL, Graham JL, McKay RA, Murray SF. Inhibition of protein tyrosine phosphatase‐1B with antisense oligonucleotides improves insulin sensitivity and increases adiponectin concentrations in monkeys. Endocrinology 2009; 150: 1670–1679. [DOI] [PMC free article] [PubMed] [Google Scholar]
- 38. Weir JB. New methods for calculating metabolic rate with special reference to protein metabolism. J Physiol 1949; 109: 1–9. [DOI] [PMC free article] [PubMed] [Google Scholar]
- 39. Ley CJ, Lees B, Stevenson JC. Sex‐ and menopause‐associated changes in body‐fat distribution. Am J Clin Nutr 1992; 55: 950–954. [DOI] [PubMed] [Google Scholar]
- 40. Narita H, Ohkubo F, Yoshida T, Cho F, Yoshikawa Y. Measuring bone mineral content and soft tissue mass in living the cynomolgus monkey. Jikken Dobutsu 1994; 43: 261–265. [DOI] [PubMed] [Google Scholar]
- 41. Matthews DR, Hosker JP, Rudenski AS, Naylor BA, Treacher DF, Turner RC. Homeostasis model assessment: insulin resistance and beta‐cell function from fasting plasma glucose and insulin concentrations in man. Diabetologia 1985; 28: 412–419. [DOI] [PubMed] [Google Scholar]
- 42. Zimmet P, Shaw J, Alberti KG. Preventing Type 2 diabetes and the dysmetabolic syndrome in the real world: a realistic view. Diabet Med 2003; 20: 693–702. [DOI] [PubMed] [Google Scholar]
- 43. Mohler ML, He Y, Wu Z, Hwang DJ, Miller DD. Recent and emerging anti‐diabetes targets. Med Res Rev 2009; 29: 125–195. [DOI] [PubMed] [Google Scholar]
- 44. Ruxton CH, Gardner EJ, McNulty HM. Is sugar consumption detrimental to health? A review of the evidence 1995–2006. Crit Rev Food Sci Nutr 2010; 50: 1–19. [DOI] [PubMed] [Google Scholar]
- 45. Dolan LC, Potter SM, Burdock GA. Evidence‐based review on the effect of normal dietary consumption of fructose on development of hyperlipidemia and obesity in healthy, normal weight individuals. Crit Rev Food Sci Nutr 2010; 50: 53–84. [DOI] [PubMed] [Google Scholar]
- 46. Tappy L, Le KA, Tran C, Paquot N. Fructose and metabolic diseases: new findings, new questions. Nutrition 2010; 26: 1044–1049. [DOI] [PubMed] [Google Scholar]
- 47. Stanhope KL, Havel PJ. Fructose consumption: recent results and their potential implications. Ann N Y Acad Sci 2010; 1190: 15–24. [DOI] [PMC free article] [PubMed] [Google Scholar]
- 48. Hansen BC. Pathophysiology of obesity‐associated type II diabetes (NIDDM): implications from longitudinal studies of non‐human primates. Nutrition 1989; 5: 48–50. [PubMed] [Google Scholar]