

Abstract
Introduction
Late presentation to HIV clinical care increases individual risk of (multiple) clinical events and death, and decreases successful response to highly active antiretroviral therapy (HAART). In Brazil, provision of HAART free of charge to all HIV-infected individuals could lead to increased testing and linkage to care.
Methods
We assessed the immune status of 2,555 patients who newly presented for HIV clinical care between 1997 and 2009 at the Johns Hopkins Clinical Cohort, in Baltimore, USA and at the Instituto de Pesquisa Clinica Evandro Chagas Clinical Cohort, in Rio de Janeiro, Brazil. The mean change in the CD4 cell count per year was estimated using multivariate linear regression models.
Results
Overall, from 1997 to 2009, 56% and 54% of the patients presented for HIV clinical care with CD4 count ≤ 350 cells/mm3 in Baltimore and Rio de Janeiro, respectively. On average, 75% of the patients presented with viral load > 10,000 copies/mL. In Rio de Janeiro only, the overall adjusted per year increase in the mean CD4 cell count was statistically significant [5 cells/mm3 (95% CI 1, 10 cells/mm3)].
Discussion
We found that, over years, the majority of patients presented late, that is, with a CD4 count < 350 cells/mm3. Our findings indicate that, despite the availability of HAART for more than a decade, and mass media campaigns stimulating HIV testing in both countries, the proportion of patients who start therapy at an advanced stage of the disease is still high.
Keywords: HIV/AIDS, late diagnosis/presentation, immunodeficiency, care
Introduction
Globally, the efforts to encourage HIV testing, the broadening of access to care and the improvements in HIV therapy could have positively impacted whether patients presented for clinical care earlier in the course of their HIV infection. In contrast, for the majority of patients, the CD4 cell count at initiation of highly active antiretroviral therapy (HAART) has been lower than the recommended by treatment guidelines. Data from a large multicenter cohort from the United States and Canada indicate that, although the observed mean CD4 count at presentation for care has increased since 1997, most patients continue to first present for care with a CD4 count < 350 cells/mm3 1. Studies from Europe have shown that late presentation for care may reach up to 45% of the patients 2, 3. In fact, a consensus definition of late presentation, CD4 count < 350 cells/mm3, was recently discussed and proposed 4.
Late presentation for HIV clinical care is largely due to delayed diagnosis 5. Late diagnosis of HIV infection has a number of negative consequences. Individuals who present at an advanced stage of immunosuppression are at high risk of clinical events and death, are more likely to present with multiple illnesses within a short time period and to show a poorer response to HAART 6. Moreover, patients who remain unaware of their serostatus are unable to reduce their risk of onward transmission, either by adopting risk reduction behaviors 7 or by initiating HAART to lower their plasma HIV viral load 8.
In Brazil, the Ministry of Health’s program of providing highly active antiretroviral therapy (HAART) free of charge to all HIV-infected individuals could serve to stimulate testing and link to care. A study based on data from the SISCEL (The Laboratory Exam Control System that monitors laboratory procedures related to CD4 and CD8 cell counts and viral load quantification in Brazil) showed that when patients sought clinical care their median initial CD4 count was 326 cells/mm3, and more than 50% of the patients were already in a disease stage in which ARV therapy initiation would be recommended 9.
In the present study we assessed the immune status of patients who newly presented for HIV clinical care at the Johns Hopkins Clinical Cohort, in Baltimore, USA and at the Instituto de Pesquisa Clinica Evandro Chagas Clinical Cohort, in Rio de Janeiro, Brazil. Since objective was to evaluate whether patients presented for care earlier in the course of their HIV infection over time, our study period included 13 years, from 1997 to 2009, thus allowing adequate assessment temporal trends. Also, our study included data from Rio de Janeiro and Baltimore thus allowing a comparative evaluation of presentation for care in two distinct cities.
Methods
Description of the clinical cohorts
The Johns Hopkins AIDS Service provides care for a large proportion of HIV-infected patients in Baltimore. An observational, longitudinal, clinical database has been maintained on patients receiving primary HIV care since 1990. In this longitudinal database, data are updated regularly using clinic and inpatient clinical documentation (from the Johns Hopkins AIDS Service and elsewhere), laboratory testing results, and pharmacy records. Prescription of antiretroviral therapy (drug, dates of use, and dose) is documented by the medical provider and support staff in the clinical records. Trained abstractors record all this information onto standardized forms for processing. Details of the methodology have been previously described 10.
The IPEC AIDS Service has provided care to HIV-infected patients in Rio de Janeiro since 1986. An observational, longitudinal, clinical database has been maintained on patients receiving primary HIV care in the clinic since 1998. The data collection process was patterned after the process established at the Johns Hopkins AIDS Service. Longitudinal data are updated regularly using clinic and inpatient clinical documentation, laboratory testing results, and pharmacy records. Prescription of antiretroviral therapy (drug, dates of use, and dose) is documented by the medical provider and support staff in the clinical records. Trained abstractors record all this information onto standardized forms for processing.
Inclusion criteria and variables of interest
We analyzed data on HIV-infected adults who first presented for clinical care during the period from January 1997 through December 2009 for the Johns Hopkins and the IPEC clinical cohorts. First presentation for HIV clinical care was defined as the date at which the first CD4 count was reported. Both cohorts have procedures to determine medical histories at first presentation for clinical care. HIV-related diagnosis, laboratory results, and treatments prior to enrollment are routinely recorded.
Several exclusion criteria were used to eliminate patients who might have been receiving HIV clinical care prior to their first recorded CD4 count. First, patients who were receiving antiretroviral therapy prior to the date of the first CD4 count were excluded. Second, patients who had an AIDS-defining diagnosis recorded > 3 months prior to the first CD4 count were excluded. The 3 months threshold was established to differentiate those who were presenting an AIDS-defining diagnosis at the time of presentation to clinical care from those who may have been seeking care elsewhere.
The outcome of interest was the first CD4 cell count. Other variables of interest obtained at the time of first presentation for clinical care included date of birth, gender, race/ethnicity, self-reported HIV risk group, HIV viral load, and self-reported date of HIV diagnosis. Race/ethnicity is based on patient self-report in Baltimore and on provider report in Rio de Janeiro. Race/ethnicity was categorized as white and non-white (including black, Latino and other). HIV risk group was categorized as MSM, heterosexual, IDU, and other. If there was both an IDU and a sexual risk category reported concurrently, the participant was categorized as IDU. For this analysis, we considered the HIV viral load measurements taken within 3 months of the first CD4 count.
Statistical analysis
Given the compatible variable formatting, we combined data from Baltimore and Rio de Janeiro into a single database. Statistical comparison of demographic and clinical characteristics across calendar dates was accessed by the Cuzick test for trend for continuous variables (age, number of days to presentation, CD4 count, and HIV viral load) and the Cochran-Armitage test for trend for categorical variables (site, sex, race/ethnicity, HIV risk group, AIDS-defining infection (ADI) at presentation). Multivariate linear regression models were used to describe the time trend in the CD4 cell count at first presentation to clinical care using a linear variable for calendar year. The models were adjusted for demographic, behavioral, and clinical characteristics. Interactions between calendar year and age, sex, race/ethnicity and HIV risk group were evaluated. Analyses were done using R-software (version 2.10) or SAS (version 9, SAS Institute).
Results
A total of 2,555 patients first presented for HIV clinical care in Baltimore (1,100 patients) and in Rio de Janeiro (1,455 patients), during the period from 1997 and 2009. In both cities, over time, the median age at presentation for care significantly increased from 37 years in 1997 to 41 years in 2009 in Baltimore (p < 0.01, Table 1), and from 32 years in 1997 to 35 years in 2009 in Rio de Janeiro (p = 0.05, Table 1). In Baltimore, the proportion of patients by gender and by race/ethnicity did not significantly change over time (p = 0.23 and p = 0.56, respectively). In contrast, in Rio de Janeiro, the proportion of females and of non-whites significantly fluctuated over time (p < 0.01 and p < 0.01, respectively). In Baltimore, except for the years 1997-8, heterosexual sex was the most frequent risk group category with a significant increase in the percentage of patients reporting heterosexual sex (p > 0.01). Also in this city, there was a decrease in the percentage of patients reporting injection drug use (from 38% to 27%, p = 0.02). In Rio de Janeiro, heterosexual sex was also the risk group most frequently reported while the percentage of patients reporting IDU was minimal. In Rio de Janeiro, the proportion of patients presenting for care with an ADI significantly increased over the years (p < 0.01). For all years in both cities, except 1997 in Baltimore, the median time between HIV diagnosis and presentation for care was always less than one year (Table 1).
Table 1.
Characteristics of patients at first presentation for HIV clinical care by year for the Johns Hopkins and the IPEC clinical cohorts.
| Characteristic | Overall | 1997 | 1998 | 1999 | 2000 | 2001 | 2002 | 2003 | 2004 | 2005 | 2006 | 2007 | 2008 | 2009 |
|---|---|---|---|---|---|---|---|---|---|---|---|---|---|---|
| Baltimore | ||||||||||||||
|
| ||||||||||||||
| Age years a median (IQR) | 38 (32-45) | 37 (32-42) | 39 (34-43) | 38 (32-45) | 36 (30-42) | 38 (33-44) | 39 (33-46) | 37 (33-43) | 39 (31-44) | 39 (32-44) | 44 (35-49) | 42 (32-50) | 42 (31-49) | 41 (34-48) |
|
| ||||||||||||||
| Sex | ||||||||||||||
| Female | 374 (34) | 49 (29) | 36 (31) | 27 (31) | 40(39) | 42 (33) | 32 (38) | 34(42) | 19 (33) | 14 (41) | 16 (36) | 23(31) | 19(32) | 23 (39) |
| Male | 726 (66) | 121 (71) | 80 (69) | 60 (69) | 62 (61) | 87 (67) | 52 (62) | 47 (58) | 39 (67) | 20 (59) | 29 (64) | 52 (69) | 41 (68) | 36 (61) |
|
| ||||||||||||||
| Race/ethnicity | ||||||||||||||
| White | 232 (21) | 31 (18) | 25 (22) | 23 (26) | 24 (23) | 30 (23) | 17 (20) | 20 (25) | 10 (17) | 7 (21) | 6 (13) | 14 (19) | 17 (28) | 8 (14) |
| Non-white | 868 (79) | 139 (82) | 91 (78) | 64 (74) | 78 (77) | 99 (77) | 67 (80) | 61 (75) | 48 (83) | 27 (79) | 39 (87) | 61 (81) | 43 (72) | 51 (86) |
|
| ||||||||||||||
| HIV risk group | ||||||||||||||
| MSM | 276 (25) | 44 (26) | 30 (26) | 19 (22) | 18 (18) | 29 (22) | 21 (25) | 20 (25) | 15 (26) | 0 (26) | 12 (27) | 27 (36) | 18 (30) | 14 (24) |
| Heterosexual a | 427 (39) | 50 (29) | 31 (27) | 34 (39) | 51 (50) | 48 (37) | 37 (44) | 36 (44) | 23 (40) | 19 (56) | 18 (40) | 28 (37) | 27 (45) | 25 (42) |
| IDU b | 324 (29) | 65 (38) | 46 (40) | 28 (32) | 26 (25) | 38 (29) | 21 (25) | 22 (27) | 18 (31) | 4 (12) | 10 (22) | 17 (23) | 13 (22) | 16 (27) |
| Other/Unknown | 73 (7) | 11 (6) | 9 (8) | 6 (7) | 7 (7) | 14 (11) | 5 (6) | 3(4) | 2 (3) | 2 (6) | 5 (11) | 3 (4) | 2 (3) | 4 (7) |
|
| ||||||||||||||
| ADI at presentation | ||||||||||||||
| No | 813 (74) | 126 (74) | 75 (65) | 62 (71) | 79 (77) | 95 (74) | 59 (70) | 67 (83) | 48 (83) | 20 (59) | 35 (78) | 51 (68) | 49 (82) | 47 (80) |
| Yes | 287 (26) | 44 (26) | 41 (35) | 25 (29) | 23 (23) | 34 (26) | 25 (30) | 14 (17) | 10 (17) | 14 (41) | 10 (22) | 24 (32) | 11 (18) | 12 (20) |
|
| ||||||||||||||
| Days since diagnosis b median (IQR) | 120 (41-1115) | 372 (41-1548) | 224 (47-1325) | 242 (56-1692) | 71 (36-622) | 92 (42-665) | 76 (41-499) | 124 (69-874) | 143 (57-1373) | 71 (28-806) | 91 (27-671) | 111 (35-976) | 123 (31-1809) | 74 (31-513) |
|
| ||||||||||||||
| Viral load | ||||||||||||||
| Log10(copies/mL) median (IQR) | 4.6 (3.9-5.2) | 4.5 (3.8-5.0) | 4.7 (4.2-5.4) | 4.5 (3.9-5.2) | 4.5 (3.5-5.2) | 4.6 (4.0-5.3) | 4.5 (4.1-5.2) | 4.7 (4.0-5.3) | 4.5 (3.9-4.9) | 5.0 (4.3-5.3) | 4.9 (4.0-5.4) | 4.8 (4.2-5.1) | 4.2 (3.5-4.7) | 4.4 (3.5-5.0) |
|
| ||||||||||||||
| CD4 cells/mm3 median (IQR) | 314 (99-512) | 362 (153-576) | 262 (41-465) | 311 (109-508) | 256 (103-522) | 288 (118-531) | 272 (86-483) | 293 (105-508) | 326 (134-425) | 219 (65-379) | 198 (65-497) | 280 (67-479) | 414 (244-630) | 386 (210-582) |
|
| ||||||||||||||
| Rio de Janeiro | ||||||||||||||
|
| ||||||||||||||
| Age years median (IQR) | 34 (28-41) | 32 (25-36) | 31 (26-36) | 34 (27-38) | 34 (29-43) | 35 (28-40) | 35 (28-41) | 34 (28-43) | 38 (29-45) | 34 (28-40) | 33 (27-41) | 35 (28-42) | 33 (28-42) | 35 (28-43) |
|
| ||||||||||||||
| Sex a | ||||||||||||||
| Female | 506 (35) | 20 (71) | 23 (54) | 33 (45) | 36 (41) | 35 (38) | 24 (39) | 11 (26) | 24 (41) | 37 (28) | 68 (31) | 62 (26) | 84 (34) | 49 (36) |
| Male | 949 (65) | 8 (29) | 20 (46) | 41 (55) | 51 (59) | 57 (62) | 37 (61) | 31 (74) | 34 (59) | 95 (72) | 151 (69) | 173 (74) | 165 (66) | 86 (64) |
|
| ||||||||||||||
| Race/ethnicity a | ||||||||||||||
| White | 800 (55) | 13 (46) | 22 (51) | 44 (60) | 61 (70) | 60 (65) | 37 (61) | 21 (50) | 38 (66) | 81 (61) | 132 (60) | 140 (60) | 93 (37) | 58 (43) |
| Non-white | 655 (45) | 15 (54) | 21 (49) | 30 (40) | 26 (30) | 32 (35) | 24 (39) | 21 (50) | 20 (34) | 51 (39) | 87 (40) | 95 (40) | 156 (63) | 77 (57) |
|
| ||||||||||||||
| HIV risk group | ||||||||||||||
| MSM | 485 (33) | 3 (11) | 10 (23) | 22 (30) | 28 (32) | 30 (33) | 17 (28) | 18 (43) | 18 (31) | 48 (36) | 81 (37) | 90 (38) | 78 (31) | 42 (31) |
| Heterosexual | 745 (51) | 18 (64) | 24 (56) | 37 (50) | 45 (52) | 50 (54) | 37 (61) | 19 (45) | 29 (50) | 57 (43) | 113 (52) | 117 (50) | 135 (54) | 64 (47) |
| IDU | 14 (1) | 1 (4) | 1 (2) | 0 (0) | 2 (2) | 0 (0) | 1 (2) | 0(0) | 0(0) | 1 (1) | 1 (1) | 2 (1) | 5 (2) | 0(0) |
| Other/Unknown | 211 (15) | 6 (21) | 8 (19) | 15 (20) | 12 (14) | 12 (13) | 6 (10) | 5 (12) | 11 (19) | 26 (20) | 24 (11) | 26 (11) | 31 (12) | 29 (22) |
|
| ||||||||||||||
| ADI at presentation a | ||||||||||||||
| No | 1091 (75) | 22 (79) | 36 (84) | 53 (72) | 70 (81) | 76 (83) | 43 (71) | 35 (83) | 46 (79) | 107 (81) | 182 (83) | 175 (75) | 164 (66) | 82 (61) |
| Yes | 364 (25) | 6 (21) | 7 (16) | 21 (28) | 17 (19) | 16 (17) | 18 (29) | 7 (17) | 12 (21) | 25 (19) | 37 (17) | 60 (25) | 85 (34) | 53 (39) |
|
| ||||||||||||||
| Days since diagnosis median (IQR) | 100 (39-290) | 67 (36-130) | 64 (18-184) | 77 (26-203) | 117 (45-288) | 104 (43-208) | 136 (62-437) | 190 (83-570) | 126 (49-351) | 140 (49-714) | 120 (53-338) | 121 (30-331) | 74 (31-260) | 58 (21-157) |
|
| ||||||||||||||
| Viral load | ||||||||||||||
| Log10(copies/mL) median (IQR) | 4.6 (4.0-5.0) | 4.6 (4.1-4.9) | 4.9 (4.5-5.5) | 4.5 (3.6-5.1) | 4.6 (3.9-5.3) | 4.7 (4.2-5.2) | 5.0 (4.5-5.5) | 4.3 (3.6-4.9) | 4.8 (4.4-5.3) | 4.5 (3.6-5.1) | 4.6 (4.4-5.2) | 4.7 (4.0-5.2) | 4.4 (4.0-5.0) | 4.7 (4.0-5.5) |
|
| ||||||||||||||
| CD4 cells/mm3 median (IQR) | 332 (142-529) | 338 (183-569) | 378 (203-628) | 305 (109-565) | 283 (157-471) | 262 (140-476) | 215 (108-422) | 277 (175-549) | 314 (157-479) | 347 (177-480) | 386 (230-549) | 335 (130-578) | 351 (135-546) | 293 (75-506) |
Data are number (percent) of patients, unless indicated. IQR: interquartile range, MSM: men who have sex with men, IDU: infection drug user
p < 0.01
p < 0.05
From 1997 to 2009, no trend in the median CD4 cell count at presentation for clinical care was observed for Baltimore or Rio de Janeiro (Figure 1). In Baltimore, although there is a decreasing trend up until 2006, an increase in the median CD4 cell count is observed from 2007 onwards (Figure 1). In Baltimore, the percentage of patients presenting with a CD4 count < 350 cells/mm3 reached 67% in 2005 and then decreased reaching its lowest value in 2008 (40%, Figure 2). Also in this city, in 2006, 24% and 53% of the patients presented with a CD4 count < 50 cells/mm3 and < 200 cells/mm3, respectively, while in 2008 the situation changed to only 7% and 20% of the patients presenting with a CD4 count of 50 cells/mm3 and < 200 cells/mm3, respectively (Figure 2). In Rio de Janeiro, the median CD4 cell count decreased reaching its lowest value in 2002, and then increased reaching its highest value in 2006 (Figure 1). Figure 2 shows that the percentage of patients presenting with a CD4 count < 50 cells/mm3, < 200 cells/mm3, and < 350 cells/mm3 increased up to, respectively, 16%, 46%, and 66% in 2002, and then decreased to the lowest values in 2006 (Figure 2). Viral load measurements at first presentation for clinical care were available for 84% of the patients. On average, 75% of the patients presented with viral load > 10,000 copies/mL (Figure 1).
Figure 1.
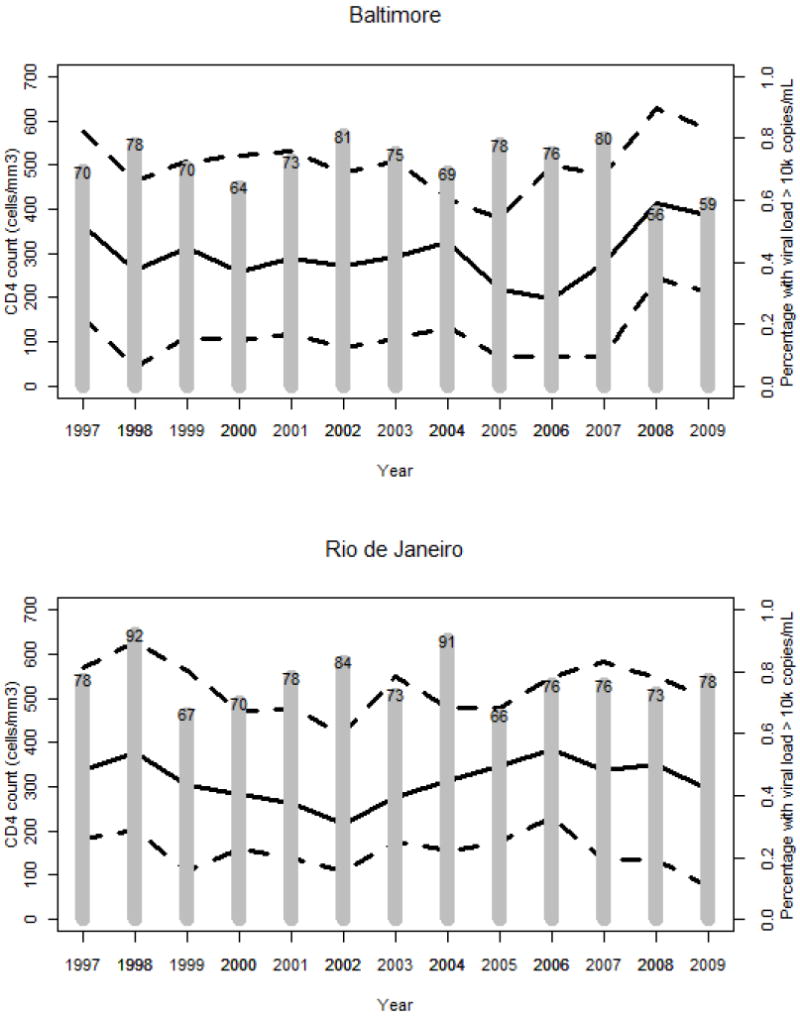
Median CD4 count (full line) and interquartile range (dashed lines) and the percentage of patients with viral load > 10,000 copies/mL at first presentation for human immunodeficiency virus clinical care in Baltimore (top) and Rio de Janeiro (bottom), 1997-2009.
Figure 2.
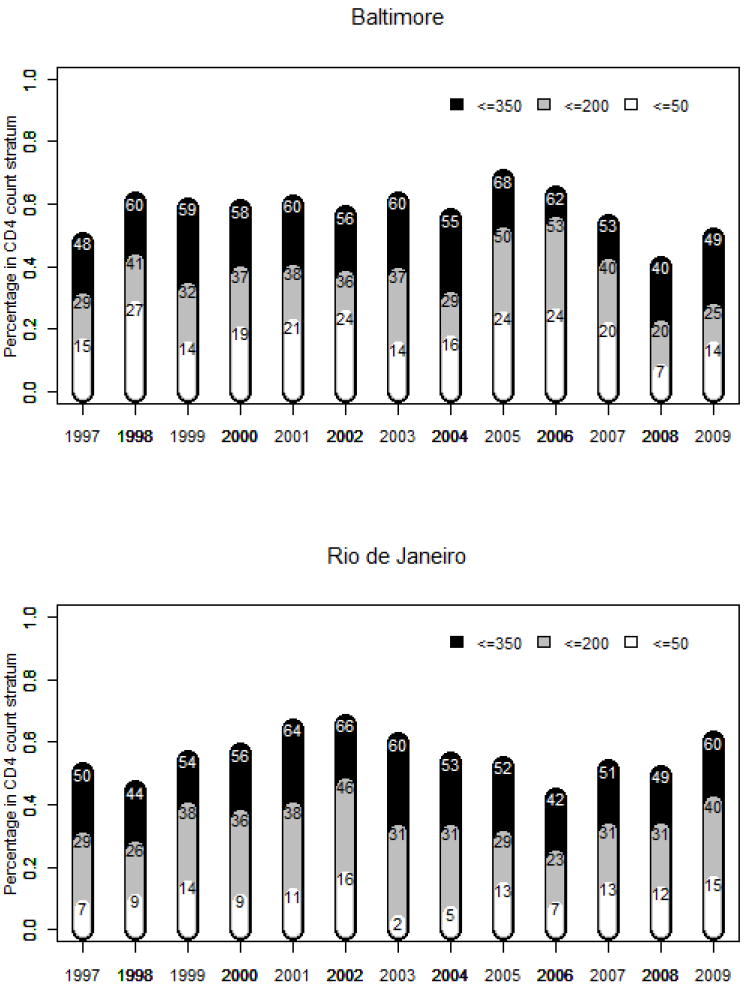
Percentage of patients in three CD4 count strata: ≤350 cells/mm3, ≤200 cells/mm3, and ≤50 cells/mm3 at first presentation for human immunodeficiency virus clinical care in Baltimore (top) and Rio de Janeiro (bottom), 1997-2009.
Table 2 displays the results from the overall and stratified multivariate models. In Baltimore, the observed mean CD4 count is practically the same for 1997 (417 cells/mm3) as it is for 2009 (419 cells/mm3), and the estimated per year change in the mean CD4 cell count is not significant (Table 2). Older patients presented with a mean CD4 cell count similar to those of younger individuals in 1997 and 2009; the estimated per year change in the mean CD4 count is not significant for either age group (Table 2). Although women had a higher observed mean CD4 count in 1997 and 2009 when compared to men, a non-significant decreasing trend is estimated for women while a non-significant increasing trend is estimated for men (Table 2). A non-significant increasing trend for the CD4 cell count at presentation is estimated for whites (per year change in the mean CD4 count: 7 cells/mm3, 95% CI -3, 18 cells/mm3). As expected, the CD4 count at presentation for care is much higher for those who do not present with an ADI (503 cells/mm3 in 1997 and 498 cells/mm3 in 2009) compared to those who present with an ADI (170 cells/mm3 in 1997 and 109 cells/mm3 in 2009). From the interactions tested in the multivariate model, there was significant interaction between the change in CD4 count per year and sex (p < 0.05).
Table 2.
Observed and estimated CD4 cell count at first presentation for HIV clinical care, 1997-2009.
| Observed mean (95% CI) CD4 count, cells/mm3
|
Estimated change in the mean (95% CI) CD4 count, cells/mm3, per year a | ||
|---|---|---|---|
| 1997 | 2009 | ||
| Baltimore | |||
|
| |||
| Overall b | 417 (6, 1067) | 419 (19, 927) | 1(-4, 6) |
|
| |||
| Stratified by age c | |||
| < 40 years | 415 (6, 1094) | 431 (19, 833) | 2 (-5, 8) |
| ≥ 40 years | 419 (16, 1010) | 411 (24, 1032) | 0 (-7, 7) |
|
| |||
| Stratified by sex d | |||
| Female | 590 (50, 1224) | 433 (113, 793) | -7 (-16, 2) |
| Male | 346 (5, 879) | 410 (16, 1027) | 5 (-5, 11) |
|
| |||
| Stratified by race/ethnicity e | |||
| White | 378 (27, 958) | 446 (53, 805) | 7 (-3, 18) |
| Non-white | 425 (6, 1049) | 415 (18, 965) | -1 (-6, 5) |
|
| |||
| Stratified by HIV risk group f | |||
| MSM | 345 (7, 643) | 366 (26, 700) | 5 (-3, 13) |
| Heterosexual | 482 (8, 1142) | 320 (17, 733) | -3 (-11, 5) |
| IDU | 421 (8, 1031) | 609 (77, 1312) | -1 (-11, 10) |
|
| |||
| Stratified by ADI at presentation b | |||
| No | 502 (68, 1107) | 498 (89, 984) | 0 (-5, 5) |
| Yes | 170 (5, 712) | 109 (5, 344) | -5 (-10, 6) |
|
| |||
| Rio de Janeiro | |||
|
| |||
| Overall b | 365 (37, 761) | 366 (22, 935) | 5 (1, 10)* |
|
| |||
| Stratified by age c | |||
| < 40 years | 363 (30, 649) | 375 (43, 862) | 6 (2, 11)* |
| ≥ 40 years | 373 (195, 735) | 350 (14, 1397) | 1 (-9, 10) |
|
| |||
| Stratified by sex d | |||
| Female | 401 (69, 838) | 394 (20, 1191) | 6 (-2, 13) |
| Male | 273 (19, 624) | 351 (29, 875) | 3 (-2, 9) |
|
| |||
| Stratified by race/ethnicity e | |||
| White | 214 (21, 469) | 427 (31, 963) | 10 (4, 16)** |
| Non-white | 495 (133, 934) | 320 (17, 922) | -1 (-7, 6) |
|
| |||
| Stratified by HIV risk group f | |||
| MSM | 269 (31, 584) | 342 (40, 747) | 0 (-9, 8) |
| Heterosexual | 417 (53, 877) | 367 (25, 893) | 4 (-2, 10) |
| IDU | 396 (396, 396) | - (-, -) | 5 (-40, 50) |
|
| |||
| Stratified by ADI at presentation b | |||
| No | 411 (71, 811) | 502 (74, 1097) | 9 (4, 14) ** |
| Yes | 195 (27, 415) | 156 (11, 640) | 5 (-1, 10) |
CI: confidence interval, MSM: men who have sex with men, IDU: injection drug user, ADI: AIDS defining illness.
Estimated change in CD4 count per year from 1997 to 2009 and 95% CI from linear regression models.
Model adjusted for age, sex, race/ethnicity and HIV risk group.
Model adjusted for sex, race/ethnicity, and HIV risk group.
Model adjusted for age, race/ethnicity and HIV risk group.
Model adjusted for age, sex, and HIV risk group.
Model adjusted for age, sex, and race/ethnicity.
p < 0.01
p < 0.05
In Rio de Janeiro, the observed mean CD4 cell count in 1997 is similar to that observed in 2009 (1997: 365 cells/mm3 and 2009: 366 cells/mm3, Table 2). The overall adjusted per year increase in the mean CD4 cell count is statistically significant [5 cells/mm3 (95% CI 1, 10 cells/mm3), p < 0.05, Table 2]. For individuals with < 40 years of age the mean CD4 cell count was estimated to significantly increase on a per year basis [< 40 years: 6 cells/mm3 (95% CI 2, 11 cells/mm3), Table 2]. Women had higher observed mean CD4 cell counts in 1997 and 2009 and higher per year increase in the mean CD4 cell count [women: 6 cells/mm3 per year (95% CI -2, 13 cells/mm3)]. The per year increase in the mean CD4 count among whites is of 10 cells/mm3 (95%CI 4, 16 cells/mm3). CD4 cell count pattern among heterosexuals and MSM is of an increase in the CD4 cell count with time, although the estimated changes are not statistically significant. As it was shown for Baltimore, the observed mean CD4 counts for those who presented with an ADI was much lower than that observed among those who did not present with an ADI (Table 2). The estimated mean increase in CD4 cell count per year was only significant for those who did not present with an ADI [9 cells/mm3 (95% CI 4, 14 cells/mm3)]. From the interactions tested in the multivariate model, there was significant interaction between the change in CD4 count per year and race/ethnicity (p < 0.05).
Discussion
We assessed the immune status of patients who newly presented for HIV clinical care from 1997 to 2009 at the Instituto de Pesquisa Clinica Evandro Chagas Clinical Cohort, in Rio de Janeiro, Brazil, and compared it to the Johns Hopkins Clinical Cohort, in Baltimore, USA. Our results show that, over 13 years, the majority of patients still presented late for care, that is, with a CD4 count < 350 cells/mm3. Our findings are in accordance with studies from the US and Canada, as well as from Brazil, that shown that the majority of patients continue to present late for care with immediate indication of HAART initiation 1, 9.
At the individual level, late presentation to clinical care is associated with increased morbidity and mortality, as well as increased cost to healthcare services 11. Indeed, low baseline CD4 cell count and presence of an AIDS defining and/or an AIDS associated symptom are the strongest prognostic markers for early mortality in both low and high income countries 12. The consequences and costs of late presentation for care are probably multiplied at the population level: individuals who are unaware of their serostatus may be a major source of new infections, and could represent the driving force of the epidemic 13. Overall, our results show that 75% of the patients presented with a VL higher than 10,000 copies, which indicates a high potential for HIV transmission.
Our results show that men present to care with lower CD4 cell counts when compared to women, a finding that is consistent with previous results 14. We suspect this can be attributed to the proportionately low utilization of health care facilities by men as compared to women as well as to the testing practices at antenatal care that favors earlier diagnosis among pregnant women 15, 16. For this analysis, women who started antiretroviral treatment during pregnancy at a prevention of mother to child transmission service and later on engaged into care at IPEC were excluded. Among women, competing subsistence needs and unmet needs for basic necessities such as child care are particular barriers. For some women, HIV infection may be a less immediate and pressing problem than other problems attendant to depression, drug use, sex trading, and a lack of adequate familial or social support 17. We also found that the epidemic among MSM remains unabated. Unfortunately, prevention for MSM remains a challenge. Efforts aiming to curb the epidemic in this population should include the expansion of HIV testing from the health service centered model towards a community centered strategy, linked to a prompt referral to the care system.
As expected, the mean CD4 at presentation for care is much lower for those presenting with an ADI. In Rio de Janeiro, a statistically significant increasing trend in the mean CD4 at presentation for care was estimated for those not presenting with an ADI. The same does not hold true for those with presenting with an ADI. Similarly, a statistically significant increasing trend in the mean CD4 at presentation for care was estimated for whites and not for non-whites. These results suggest that, in Rio de Janeiro, equity in HIV care and prevention may be compromised. In Baltimore, the results of the multivariate model also suggest that, over time, minorities might be presenting to care with a more deficient immune status. A non-significant decreasing trend in the mean CD4 cell count was estimated for non-whites and for those presenting with an ADI.
In Rio de Janeiro, late presentation for care must be considered in the context of the public Health Care System. With a population reaching 8 million inhabitants in the metropolitan area, the city struggles with a fragmented and inefficient health care system which directly impacts the capacity for HIV infection diagnosis. Differently from the majority of primary HIV care services in Rio de Janeiro, IPEC provides both outpatient and inpatient care, including specialty care and pharmacy assistance, and as such it may be the case that sicker patients self refer to our institution. In Baltimore, in contrast, the Johns Hopkins AIDS service serves a more disenfranchised population, with fewer insured patients and less opportunities for HIV testing. This population is probably presenting late for care due to the paucity of the health care systems that are available to them 18. It is also possible that socio-economic factors influenced by the changing political scenario during the study period as well as differences in health seeking behaviors between the populations could have a bearing on our results.
Our study has assessed the immune status of patients at presentation for care in two cities. Although both cities serve vulnerable populations, particular characteristics influence the impact of late presentation on morbidity and mortality, making the cities distinct. Rio de Janeiro still suffers from a high infectious diseases background where tuberculosis, in particular, is a major problem 19. In the present study, among those presenting with an ADI, 44% had tuberculosis at presentation for care in Rio de Janeiro. Management of tuberculosis in late presenters with CD4 cell count < 200cells/mm3 is a challenge due to increased risk of developing immune reconstitution inflammatory syndrome, additive drug toxicities and interactions resulting from antimycobacterial and ARV therapies. Thus, our results highlight that combined antiretrovirals as well as preventive isoniazid therapy are crucial in Rio de Janeiro. In both cities, we found that the interval between HIV diagnosis and presentation for care was always less than 1 year, thus strategies to promote earlier engagement of newly diagnosed patients into care are warranted.
Our results show that in both cities, despite the availability of HAART for more than a decade, and mass media campaigns stimulating HIV testing in both countries 20, the proportion of patients who start therapy at an advanced stage of the disease is still high. These results suggest that changes to the current treatment guidelines recommending earlier initiation of HAART will be of little impact on both prevention and treatment unless strategies to increase HIV testing and linkage to care with a special focus on vulnerable populations are implemented. In this regard, the myriad social and personal factors that function as determinants for health and health outcomes must be taken in consideration when designing strategies to promote early HIV diagnosis and linkage to care.
Acknowledgments
B. Grinsztejn acknowledges funding from the National Counsel of Technological and Scientific Development (CNPq) and the Research Funding Agency of the State of Rio de Janeiro (FAPERJ). R. Moore acknowledges funding from NIH DA00432, DA11602, and AA16893.
Footnotes
Conflict of interest Authors declare no conflict of interest.
References
- 1.Althoff KN, Gange SJ, Klein MB, et al. Late presentation for human immunodeficiency virus care in the United States and Canada. Clin Infect Dis. Jun 1;50(11):1512–1520. doi: 10.1086/652650. [DOI] [PMC free article] [PubMed] [Google Scholar]
- 2.Brannstrom J, Akerlund B, Arneborn M, Blaxhult A, Giesecke J. Patients unaware of their HIV infection until AIDS diagnosis in Sweden 1996-2002--a remaining problem in the highly active antiretroviral therapy era. Int J STD AIDS. 2005 Oct;16(10):702–706. doi: 10.1258/095646205774357262. [DOI] [PubMed] [Google Scholar]
- 3.Wolbers M, Bucher HC, Furrer H, et al. Delayed diagnosis of HIV infection and late initiation of antiretroviral therapy in the Swiss HIV Cohort Study. HIV Med. 2008 Jul;9(6):397–405. doi: 10.1111/j.1468-1293.2008.00566.x. [DOI] [PubMed] [Google Scholar]
- 4.Antinori A, Coenen T, Costagiola D, et al. Late presentation of HIV infection: a consensus definition. HIV Med. 2011 Jun 17; doi: 10.1111/j.1468-1293.2010.00857.x. [DOI] [PubMed] [Google Scholar]
- 5.Girardi E, Sabin CA, Monforte AD. Late diagnosis of HIV infection: epidemiological features, consequences and strategies to encourage earlier testing. J Acquir Immune Defic Syndr. 2007 Sep;46(Suppl 1):S3–8. doi: 10.1097/01.qai.0000286597.57066.2b. [DOI] [PubMed] [Google Scholar]
- 6.Phillips A, Pezzotti P. Short-term risk of AIDS according to current CD4 cell count and viral load in antiretroviral drug-naive individuals and those treated in the monotherapy era. AIDS. 2004 Jan 2;18(1):51–58. doi: 10.1097/00002030-200401020-00006. [DOI] [PubMed] [Google Scholar]
- 7.Marks G, Crepaz N, Senterfitt JW, Janssen RS. Meta-analysis of high-risk sexual behavior in persons aware and unaware they are infected with HIV in the United States: implications for HIV prevention programs. J Acquir Immune Defic Syndr. 2005 Aug 1;39(4):446–453. doi: 10.1097/01.qai.0000151079.33935.79. [DOI] [PubMed] [Google Scholar]
- 8.Donnell D, Baeten JM, Kiarie J, et al. Heterosexual HIV-1 transmission after initiation of antiretroviral therapy: a prospective cohort analysis. Lancet. Jun 12;375(9731):2092–2098. doi: 10.1016/S0140-6736(10)60705-2. [DOI] [PMC free article] [PubMed] [Google Scholar]
- 9.Souza PR, Jr, Szwarcwald CL, Castilho EA. Delay in introducing antiretroviral therapy in patients infected by HIV in Brazil, 2003-2006. Clinics (Sao Paulo) 2007 Oct;62(5):579–584. [PubMed] [Google Scholar]
- 10.Moore RD. Understanding the clinical and economic outcomes of HIV therapy: the Johns Hopkins HIV clinical practice cohort. J Acquir Immune Defic Syndr Hum Retrovirol. 1998;17(Suppl 1):S38–41. doi: 10.1097/00042560-199801001-00011. [DOI] [PubMed] [Google Scholar]
- 11.Krentz HB, Auld MC, Gill MJ. The high cost of medical care for patients who present late (CD4 <200 cells/microL) with HIV infection. HIV Med. 2004 Mar;5(2):93–98. doi: 10.1111/j.1468-1293.2004.00193.x. [DOI] [PubMed] [Google Scholar]
- 12.Lanoy E, May M, Mocroft A, et al. Prognosis of patients treated with cART from 36 months after initiation, according to current and previous CD4 cell count and plasma HIV-1 RNA measurements. AIDS. 2009 Oct 23;23(16):2199–2208. doi: 10.1097/QAD.0b013e3283305a00. [DOI] [PMC free article] [PubMed] [Google Scholar]
- 13.Marks G, Crepaz N, Janssen RS. Estimating sexual transmission of HIV from persons aware and unaware that they are infected with the virus in the USA. AIDS. 2006 Jun 26;20(10):1447–1450. doi: 10.1097/01.aids.0000233579.79714.8d. [DOI] [PubMed] [Google Scholar]
- 14.Keruly JC, Moore RD. Immune status at presentation to care did not improve among antiretroviral-naive persons from 1990 to 2006. Clin Infect Dis. 2007 Nov 15;45(10):1369–1374. doi: 10.1086/522759. [DOI] [PubMed] [Google Scholar]
- 15.Branson BM, Handsfield HH, Lampe MA, et al. Revised recommendations for HIV testing of adults, adolescents, and pregnant women in health-care settings. MMWR Recomm Rep. 2006 Sep 22;55(RR-14):1–17. quiz CE11-14. [PubMed] [Google Scholar]
- 16.Spensley A, Sripipatana T, Turner AN, Hoblitzelle C, Robinson J, Wilfert C. Preventing mother-to-child transmission of HIV in resource-limited settings: the Elizabeth Glaser Pediatric AIDS Foundation experience. Am J Public Health. 2009 Apr;99(4):631–637. doi: 10.2105/AJPH.2007.114421. [DOI] [PMC free article] [PubMed] [Google Scholar]
- 17.Hader SL, Smith DK, Moore JS, Holmberg SD. HIV infection in women in the United States: status at the Millennium. JAMA. 2001 Mar 7;285(9):1186–1192. doi: 10.1001/jama.285.9.1186. [DOI] [PubMed] [Google Scholar]
- 18.Goicoechea M, Smith DM. Universal HIV testing: is it enough? Clin Infect Dis. 2007 Nov 15;45(10):1375–1376. doi: 10.1086/522760. [DOI] [PubMed] [Google Scholar]
- 19.Grinsztejn B, Veloso VG, Friedman RK, et al. Early mortality and cause of deaths in patients using HAART in Brazil and the United States. AIDS. 2009 Oct 23;23(16):2107–2114. doi: 10.1097/QAD.0b013e32832ec494. [DOI] [PMC free article] [PubMed] [Google Scholar]
- 20.Qaseem A, Snow V, Shekelle P, Hopkins R, Jr, Owens DK. Screening for HIV in health care settings: a guidance statement from the American College of Physicians and HIV Medicine Association. Ann Intern Med. 2009 Jan 20;150(2):125–131. doi: 10.7326/0003-4819-150-2-200901200-00300. [DOI] [PubMed] [Google Scholar]