Abstract
Purpose: High intensity focused ultrasound (HIFU) in the abdomen can be sensitive to acoustic aberrations that can exist in the beam path of a single sonication. Having an accurate method to quickly visualize the transducer focus without damaging tissue could assist with executing the treatment plan accurately and predicting these changes and obstacles. By identifying these obstacles, MR acoustic radiation force imaging (MR-ARFI) provides a reliable method for visualizing the transducer focus quickly without damaging tissue and allows accurate execution of the treatment plan.
Methods: MR-ARFI was used to view the HIFU focus, using a gated spin echo flyback readout-segmented echo-planar imaging sequence. HIFU spots in a phantom and in the livers of five live pigs under general anesthesia were created with a 550 kHz extracorporeal phased array transducer initially localized with a phase-dithered MR-tracking sequence to locate microcoils embedded in the transducer. MR-ARFI spots were visualized, observing the change of focal displacement and ease of steering. Finally, MR-ARFI was implemented as the principle liver HIFU calibration system, and MR-ARFI measurements of the focal location relative to the thermal ablation location in breath-hold and breathing experiments were performed.
Results: Measuring focal displacement with MR-ARFI was achieved in the phantom and in vivo liver. In one in vivo experiment, where MR-ARFI images were acquired repeatedly at the same location with different powers, the displacement had a linear relationship with power [y = 0.04x + 0.83 μm (R2 = 0.96)]. In another experiment, the displacement images depicted the electronic steering of the focus inside the liver. With the new calibration system, the target focal location before thermal ablation was successfully verified. The entire calibration protocol delivered 20.2 J of energy to the animal (compared to greater than 800 J for a test thermal ablation). ARFI displacement maps were compared with thermal ablations during seven breath-hold ablations. The error was 0.83 ± 0.38 mm in the S∕I direction and 0.99 ± 0.45 mm in the L∕R direction. For six spots in breathing ablations, the mean error in the nonrespiration direction was 1.02 ± 0.89 mm.
Conclusions: MR-ARFI has the potential to improve free-breathing plan execution accuracy compared to current calibration and acoustic beam adjustment practices. Gating the acquisition allows for visualization of the focal spot over the course of respiratory motion, while also being insensitive to motion effects that can complicate a thermal test spot. That MR-ARFI measures a mechanical property at the focus also makes it insensitive to high perfusion, of particular importance to highly perfused organs such as the liver.
Keywords: MR guided high intensity focused ultrasound (MRgHIFU), MR acoustic radiation force imaging (MR-ARFI), liver ablation
INTRODUCTION
MR-guided high intensity focused ultrasound (HIFU) ablation has the potential for noninvasive treatment of pathologies throughout the body. Ultrasound energy is focused through soft tissue to a target, where energy deposition results in thermal ablation of the lesion. HIFU therapy has been successfully delivered to many tissue types, including the uterus,1 prostate,2 through the skull to brain,3, 4 and liver.5, 6 Because HIFU energy must pass through different tissues and interfaces to reach its focus, focal calibration is critical to ensuring a successful outcome. The current method of focal calibration involves heating the tissue a few degrees to verify the correct positioning of the focus. While the energy for the test spot is generally insufficient for immediate destruction of tissue, the deposited energy is still substantial, especially in well-perfused tissue, such as the liver.
In addition, poor calibration of the focus would result in erroneous delivery of the HIFU energy, potentially burning ribs or tissue near air interfaces. Further, the test spot approach to targeting uses cumulative heat deposition over several seconds; if a rib or air interface blocks the HIFU beam during a portion of the respiratory cycle; it would be difficult to discern that no energy is reaching the focus during part of the treatment. Given the complicated regional anatomy of abdominal organs, with layers of intervening fat, bone, and muscle, variable blood flow, nearby air interfaces, and respiratory motion, ablation of lesions in the abdominal organs depends on a method to quickly calibrate the HIFU focus with minimal heat deposition.
Acoustic radiation force imaging (ARFI) can be utilized to visualize focal locations without incurring thermal damage. As an ultrasound beam is transmitted through tissue, a momentum transfer occurs when the wave is absorbed or reflected, causing a force in the beam direction.7 As this force is proportional to intensity at a particular location, in HIFU, the radiation force will be strongest at the focus. ARFI imaging has been used to image mechanical tissue properties using ultrasound imaging,8 and recently, pulse sequences capable of detecting the micron displacements have been developed for MRI.9 In a typical MR Acoustic Radiation Force Imaging (MR-ARFI) pulse sequence, ARFI-encoding gradient pulses in the shape of identical unipolar9 or bipolar gradients10, 11 are employed on both sides of a spin echo 180° RF pulse, with ultrasound on for a specific portion of these gradients. Gradient recalled echo based ARFI pulse sequences have also been developed.12 In our implementation, the ultrasound power is on from the beginning of the second lobe of the first bipolar through the first lobe of the second bipolar. The displacement due to the radiation force can be encoded by these gradients and calculated from the phase change,
| (1) |
where dx is the displacement (in microns), dϕ is the change in phase, γ is the gyromagnetic ratio, G(t) are the gradients as a function of time along the displacement direction, and τUS is the time during which the ultrasound is on. For a simplified case of rectangular gradients, this integral simplifies to the displacement encoding gradient amplitude times its duration (the second lobe of the first bipolar plus the first lobe of the second bipolar). Additional phase from the slice select gradients of the 180° RF pulse would cancel. While this approximation assumes infinite slew rate gradients, neglecting finite slew rate effects results in less than a 5% error. MR-ARFI displacement maps are typically created by complex subtracting the combination of two images acquired with opposite polarity displacement encoding gradients in order to observe the phase difference. Just as with PRF thermometry, this subtraction could be performed in combination with referenceless techniques13, 14 or with referenceless processing after a single shot acquisition. Referenceless techniques will also help subtract any additional phases in the images, such as eddy current induced phase terms.10
Displacement from radiation force quickly occurs in several milliseconds and can dissipate just as quickly,9, 15 without a temperature rise, making it an ideal candidate for accurate treatment planning before an ablation. The liver tissue displacement rise time constant was found to be 6.2 ms,16 and thus 50% of the maximum displacement occurs after 4 ms. Given the acquisition can be performed rapidly and registered easily to provide planning information, and given the fact that liver tissue is generally not very stiff, and thus is easily displaced,17 MR-ARFI can fill the need for calibrating and planning ablations while minimizing tissue effects.
The purpose of this work was to develop an MR-ARFI technique for the liver and to demonstrate its capabilities in vivo. The first element of this work is the use of a readout-segmented spin echo flyback echo planar imaging (RS-EPI) sequence for acquiring MR-ARFI images. EPI imaging allows for rapid k-space collection, reducing the amount of ultrasound power and imaging time needed to acquire each ARFI image. Furthermore, while single shot EPI MR-ARFI sensitive sequences have been developed,18, 19 readout-segmentation provides flexibility in switching from a single shot sequence (the center RS-EPI shot) to a multishot sequence when higher resolution images are desired.20 A second element of this work is the real time reconstruction of MR-ARFI images and interaction provided by the real time system. These are used to calibrate the focal spot position within seconds.
The third element of this work is in vivo experimentation in which the capability of MR-ARFI to measure a focused ultrasound beam in the liver is demonstrated. The focus point was measured while steering it to various positions in the liver. Finally, by acquiring displacement maps before thermal ablations, we demonstrated the simplicity of in vivo focal calibration using this technique.
MATERIALS AND METHODS
General setup
Both phantom and animal experiments were performed during this study, with imaging performed with a Signa Excite 3.0T MRI scanner (GE Healthcare, Waukesha, WI) and HIFU performed with an extracorporeal ExAblate Conformal Bone System transducer (InSightec, Ltd., Tirat Carmel, Israel). The transducer is a flat, planar 1000 element phased array with a 550 kHz center frequency, with cold water circulation to mitigate heating at the skin. All animal experiments were approved by Stanford University’s animal care and use committee. Five healthy pigs were included in this study. Their breathing was “forced breathing,” breathing at a rate of 0.2 Hz.
MR-guided HIFU software
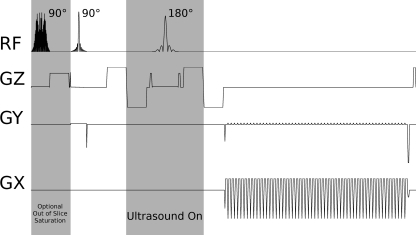
The MR-ARFI pulse sequence was a spin echo flyback RS-EPI sequence: 8 × 20 cm field of view, 1.40 × 1.40 mm acquired resolution, zero-filled to achieve a pixel size of 0.81 × 0.81 mm, TE = 74.5 ms, TR > 2000 ms, 70.2 ms echo train length (1.24 ms echo spacing), 65% partial k-space coverage, 6.8 mm slice thickness (FWHM of refocusing pulse slice profile), as shown in Fig. 1. The 90° and 180° excitation pulses were applied on perpendicular axes to achieve outer volume suppression in the phase encode direction. An entire bipolar ARFI-encoding gradient was 16 ms, yielding an estimated b-value of 78.10 This sequence provided speed and similarity to the MR thermometry sequence, with an identical readout trajectory. Identical trajectories provided identical geometric shifts due to off-resonance effects, allowing straightforward registration between MR-ARFI and thermometry. Additionally, with RS-EPI, the center shot could be reconstructed independently, yielding a fully sampled lower resolution image. Our system was capable of two acquisition protocols: a 3 shot and 3 NEX sequence (9 TRs), and a 1 shot and 1 NEX sequence (the central shot). Although both were available, the single shot EPI sequence was primarily utilized and is discussed in this manuscript. In one study, saturation bands on either side ±1.25 cm from the imaging slice were prescribed to reduce the contribution of flowing spins. The reconstruction consisted of acquiring one image with the bipolar ARFI encoding gradients as shown in Fig. 1, then subtracting a subsequently acquired image with inverted displacement encoding gradients. As a result, for these experiments, the actual scan time was two respiratory cycles for the gated protocols or 4 s (2 s per TR) for breath-hold scans.
Figure 1.
MR-ARFI RS-EPI Pulse Sequence. A small FOV is achieved by exciting perpendicular slices with the 90° and 180° RF pulses. Ultrasound is on during the second shaded period. Optional out of slice saturation slices at the beginning could be applied at the beginning to saturate signal from out of slice flow.
From the second lobe of the first bipolar ARFI encoding gradient through the first lobe of the second encoding gradient, a positive voltage signal is emitted that gated the HIFU system (Fig. 1). For technical reasons, the orientation of the encoding gradients was limited to the slice, readout, and phase encoding direction axes of the currently prescribed MRI slice. The optimum encoding direction for maximizing displacement visualization was determined by selecting the axis that was most aligned with the vector from the center of the transducer to the center of the current slice. This optimum encoding direction could be calculated in real time, whenever the slice orientation was adjusted.
All MRI imaging and HIFU ablation was controlled, reconstructed, and displayed within a custom-built real time MRI software environment, using rthawk (HeartVista, Inc, Palo Alto, CA), a flexible real time imaging platform.21 The MRI software divided treatment planning and treatment into multiple steps, including the following: transducer localization, MRI pulse sequence setup and MR thermometry baseline collection, treatment planning, and ablation. Additionally, respiratory signal values from a respiratory belt was continuously read and tagged to incoming images, as well as used for gated scans.
Transducer localization was performed with microcoils embedded in the transducer, using a phase dithering MR-tracking pulse sequence (four Hadamard encoded directions, with six phase dithers per direction).22 The locations of each tracking coil were then used to calculate the location and orientation of the transducer’s current face. For the transducer’s location utilized in these experiments (above the phantom or animal, facing down), the average discrepancy between the locations measured by the tracking coils and those determined from 250 kHz bandwidth MRI images was 0.54 mm.
The region where focusing would be possible (5–15 cm from the face, no greater than 30° angle from the normal at the center of the transducer) was then overlaid on large field of view scout images prescribed parallel and perpendicular to the transducer’s face. Image slice locations were then selected, and up to 30 thermometry, baseline images were collected throughout the animal’s respiratory cycle. In a later version of the software, the large FOV scout images were also captured throughout the cycle to serve as an underlay and guide for the smaller, reduced field of view data. Treatment planning was performed on either the large or small FOV images, determining the location to which the beam should be steered.
Additionally, the user could track motion by marking the pixel location of vessels and the diaphragm in each image with fiducials. After the initial marking, the locations of the fiducials in images corresponding to the other respiratory signal values were determined by tracking the pixel with the maximum signal in a neighborhood near the initially placed fiducial. Registering real time physiological monitoring information to these fiducial locations determined the steering of the ultrasound beam.
MR-ARFI was performed after the treatment planning stage. The user determined which respiratory location would be used to test the current target ablation location. When ready, the user activated the sequence, which collected data by gating to the selected respiratory signal value. The displacement information was overlaid on the magnitude data along with the predicted target location. The user could then adjust the steering based on this, and then repeat the MR-ARFI experiment to verify.
With treatment locations and image slices specified, ablation experiments could proceed. MR thermometry images were acquired with a multishot readout-segmented flyback EPI (RS-EPI) sequence (8 × 20 cm, 1.40 × 1.40 mm acquired resolution, zero-filled to achieve a pixel size of 0.81 × 0.81 mm, TE = 15.9 ms, TR = 117 ms, 65% partial k-space coverage, 4.7 mm slice thickness with a 1-2-1 water selective spatial spectral binomial pulse) that could alternate between single shot and multi shot modes (although only single shot is presented here).23 Temperature images were reconstructed with a multibaseline hybrid method,24 using L2 reconstruction for the referenceless portion.
Experiment #1: MR-ARFI and MR-thermometry in a phantom
To verify ablation and MR-ARFI location, a phantom (Deformable Liver Phantom for MR Ablation, Computerized Imaging Reference Systems, Inc, Norfolk, VA) was placed below the transducer in the magnet. The speed of sound, ultrasound attenuation, and elasticity of the phantom were 1533 m∕s, 0.48 dB∕cm∕MHz and 8.5 kPa, respectively. After determining the transducer location using the MR-tracking sequence and algorithm, a target was selected near the center of the phantom. A single shot MR-ARFI sequence was performed with 27.2 acoustic watts power through the center of the focus in both coronal and sagittal directions. Next, an ablation was performed (54 W acoustic for 1 min) at the same focus. Thermometry imaging was alternated between the same ARFI slice planes throughout the ablation. The focal center of the ablation was compared to that of the ARFI spots. All thermometry comparisons were performed in early ablation images (the maximum temperature was not greater than 5 °C above baseline), such that the temperature rise image is the most perfusion independent25 and also lacks shifts from PRF off-resonance shifting.26
Experiment #2: Demonstration of MR-ARFI control
The remainder of the experiments utilized healthy pigs under general anesthesia. The extracorporeal transducer was strapped to the abdomen, inferior to the sternum, allowing an acoustic window to the liver unobstructed by the ribs. After each procedure, the animal was euthanized.
The first pig experiments were designed to demonstrate the viability of MR-ARFI in the pig liver. Within a breath-hold, MR-ARFI images were prescribed with varying degrees of ultrasound power, with a maximum power of 148 W acoustic. Regions of interest (ROI) measurements in the focal region of the displacement maps were compared with those from an untreated area. Second, over the course of multiple breath-holds, the ARFI focus (at 148 W acoustic) was steered to various locations in the pig liver.
Experiment #3: Comparison with thermal ablation—In vivo and breath-hold
Within a single breath-hold, a focal spot was prescribed, MR-ARFI images of the focus were acquired, and immediately afterward the system began ablating at the prescribed location. The applied power was 148 acoustic watts for both displacement and displacement measurements. The ARFI focus location was then compared with the thermal ablation location in both directions.
Experiment #4: Focal calibration—In vivo, breathing
MR-ARFI was next used to calibrate focal targeting prior to ablation. Using our software, a target ablation location was selected in the liver that was treatable with our transducer. Prior to ablation, the MR-ARFI protocol (148–166 W acoustic) was run with the beam steered to the target coordinates during a scan gated for a particular respiratory signal value. The difference between the prescribed location and the actual location determined the additional phase required to slew the beam to the desired focal position. Repetition of the MR-ARFI protocol verified the calibration.
Experiment #5: ARFI comparison with thermal ablation—In vivo, breathing
Once calibrated, thermal ablations during respiration were performed. HIFU power was again applied at 166 W acoustic average power for variable durations, as long as a minute, and steered with respiration to a consistent location in the liver throughout the respiratory cycle. The ARFI focus location was then compared with the thermal ablation location in the nonrespiration direction.
RESULTS
Experiment #1: MR-ARFI and MR-thermometry in a phantom
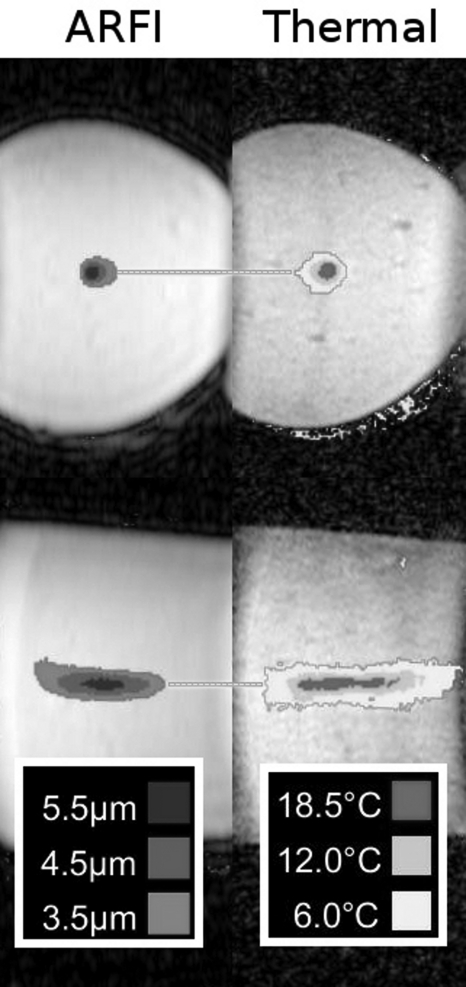
Figure 2 shows the comparison of MR-ARFI foci to the thermometry measurements. In the imaged slice perpendicular to the beam, the center ablation spot was shown as centered at (R7.8, S6.50), compared with the ARFI location of (R8.20, S6.65). The differences were 0.37 mm and 0.15 mm in the L∕R and S∕I directions, respectively. For the imaged slice parallel to the beam, the reference center was located at (P40.57, S7.89), compared with (P42.56, S7.91) for the maximum displacement location in the displacement image. The differences were 1.99 and 0.02 mm in the A∕P and S∕I directions, respectively.
Figure 2.
MR-ARFI (μm) vs thermal ablation (temperature rise) in a phantom. The horizontal lines highlight the alignment along the L∕R and S∕I directions, respectively, for these foci. For the images perpendicular to the ultrasound beam, the differences between foci were 0.37 and 0.15 mm in the L∕R and S∕I directions, respectively. For the images parallel to the beam, the difference were 1.99 and 0.02 mm in the A∕P and S∕I directions, respectively.
Experiment #2: Demonstration of MR-ARFI control in vivo
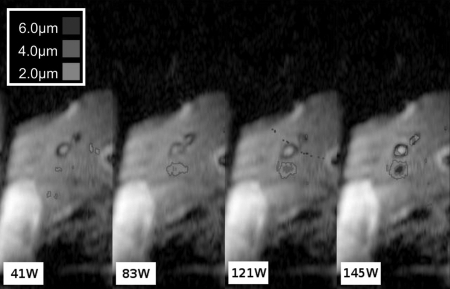
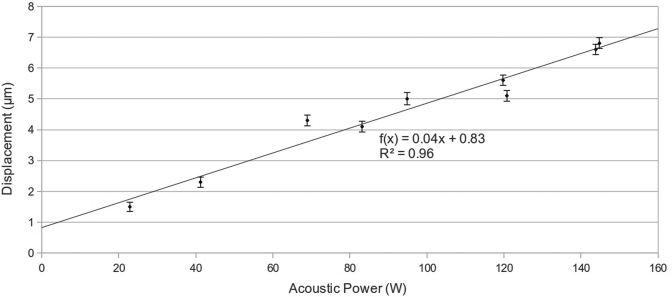
Ultrasound power was varied up to a maximum of 148 W acoustic. At each power level, the maximum displacements in the location of the ARFI focus were calculated, as was the standard deviation of the displacement by calculating the SNR of the magnitude images.27 The SNR for each image ranged from 22.1 to 28.6, with the displacement standard deviation ranging from 0.15 to 0.20 μm. Representative images from this experiment are shown in Fig. 3. The focus is easily visible on the rightmost, highest power image, and decreases in visibility with decreased power. A plot of the maximum displacement in the focal zone versus power is shown in Fig. 4, along with a linear fit to these points. The focal ROI fit is y = [0.0403 ± 0.00321]x + [0.8272 ± 0.327] μm (R2 = 0.96).
Figure 3.
Displacement images at various applied transducer powers. These images are a subset of the power to displacement curve presented in Fig. 4. These measurements were recorded at the same focus location throughout one breath-hold. The units are acoustic watts for the applied power. As the power increases, the displacement at the focus also increases.
Figure 4.
Plot of power versus displacement, including displacement information from images from Fig. 3. The displacements for each image were the maximum values at the focus. The error bars represent the displacement uncertainty calculated from the magnitude SNR of each image. The uncertainty ranged from 0.15 to 0.20 μm. A linear best-line fitted to the data. As power increases, the focal displacement increases linearly: y = [0.0403 ± 0.00321]x + [0.8272 ± 0.327] μm (R2 = 0.96).
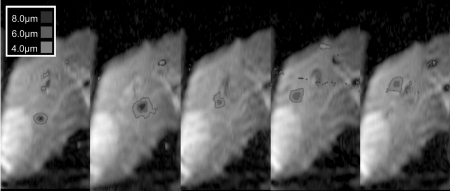
Figure 5 shows ARFI displacement images where the beam was steered to different locations in the liver. Images were acquired over the course of numerous breath-holds.
Figure 5.
Reduced field of view displacement maps demonstrating focal spot steering. The focal beam is focused to various locations within the liver. Each image was acquired in separate breath-holds.
Experiment #3: Comparison with thermal ablation—In vivo and breath-hold
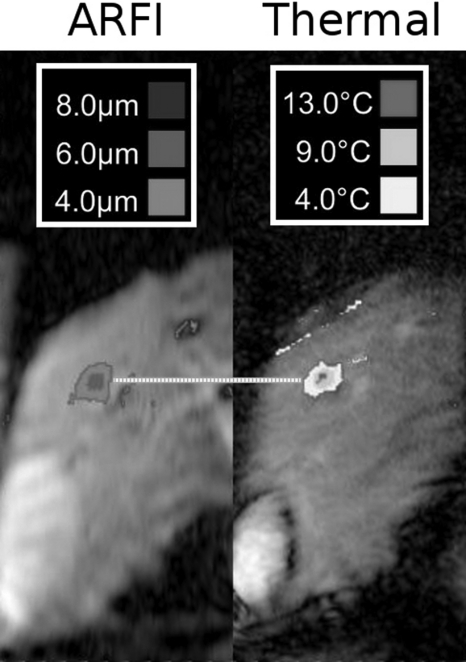
A representative radiation force image and the subsequent MRTI images from the same breath-hold are presented in Fig. 6. The combined time for the ARFI acquisition and ablation were limited to 60 s, due to the breath-hold. From these images, the location of the maximum of the ARFI focus was compared with the location of the maximum temperature rise in the thermometry data. These locations in both directions are displayed and compared in Table TABLE I.. Along the left∕right direction, the mean error was 0.99 mm; along the S∕I direction, the mean error was 0.83 mm.
Figure 6.
Representative images from breath-hold ablation experiments. During a single breath-hold, MR-ARFI was performed at a focus, immediately followed by a thermal ablation. The MR-ARFI image of the focus (left, in micrometer) was compared with the subsequent thermal ablation (right, measured as °C temperature rise). The horizontal line highlights that the foci align. The standard deviation of the discrepancy between displacement focus and thermal focus in the L∕R and S∕I directions for all seven breath-hold ARFI∕ablation comparisons was 0.83 and 0.99 mm, respectively (see Table TABLE I.).
Table 1.
Displacement and thermal foci locations in each breath-hold ablation along the left–right (L∕R) direction and superior–inferior (head–feet) (S∕I) direction. The values are positions relative to isocenter of the magnet. The error was less than a millimeter in either direction.
| 1 | 2 | 3 | 4 | 5 | 6 | 7 | |
|---|---|---|---|---|---|---|---|
| ARFI L∕R (mm) | 14.0 | 23.5 | 25.4 | 34.9 | 25.3 | 14.9 | 21.0 |
| Ablation L∕R (mm) | 15.4 | 24.9 | 26.2 | 34.2 | 25.9 | 13.5 | 20.5 |
| Error L∕R (mm) | −1.45 | −1.49 | −0.79 | 0.65 | −0.67 | 1.45 | 0.45 |
| ARFI S∕I (mm) | 45.8 | 42.5 | 56.1 | 36.3 | 26.1 | 35.8 | 32.9 |
| Ablation S∕I (mm) | 44.7 | 42.2 | 55.6 | 35.8 | 24.7 | 34.7 | 32.2 |
| Error S∕I (mm) | 1.07 | 0.33 | 0.56 | 0.53 | 1.37 | 1.14 | 0.79 |
| Mean Error S∕I (mm) | 0.83 | Mean Error L∕R (mm) | −0.26 | ||||
| Std Error S∕I (mm) | 0.38 | Std Error L∕R (mm) | 1.13 | ||||
| Mean |Error S∕I| (mm) | 0.83 | Mean |Error L∕R| (mm) | 0.99 | ||||
| Std |Error S∕I| (mm) | 0.38 | Std |Error L∕R| (mm) | 0.45 | ||||
Experiment #4: Focal calibration—In vivo, breathing
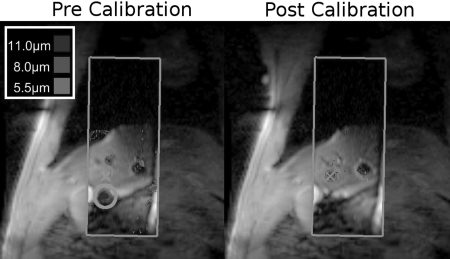
Figure 7 shows an example of utilizing ARFI-based HIFU steering during the gated collection mode. The ARFI images consist of the portion within the rectangular tiles in the center of the image; the image underlay is a larger FOV reference for the reduced FOV real time images. The prescribed ablation point is denoted by the crosshair on both the precalibration and postcalibration images. In the first image, the focus (circled) is inferior of the desired location. This difference is measured, and corrected phase terms are sent to the transducer. In the postcalibration image, the corrected focus is now demonstrated to be at the prescribed location.
Figure 7.
MR-ARFI for focal calibration. The initial precalibration image is acquired (left) during a gated scan. While the beam was intended to focus at the crosshairs, it instead was evident at the location of the circle. With a single click, the focus is corrected, and a verification image (right) shows the focus in the correct location. In both images, the ARFI image is outlined by the rectangular tile. The outer image is a large FOV anatomical reference image.
To compare the repeatability of the gating signal between MR-ARFI acquisitions, for seven different MR-ARFI image cases throughout the respiratory cycle, the location of the dome of the liver was marked for each image (with different ARFI-encoding gradients), and the maximum shift along the superior∕inferior direction was compared. Across the seven cases, the maximum S∕I shift was 1.67 ± 0.58 mm. In terms of image pixels, this corresponded to 2.07 ± 0.71 pixels.
Experiment #5: ARFI Comparison with thermal ablation—In vivo, breathing
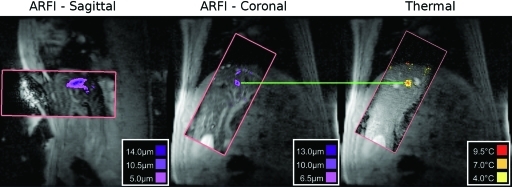
Figure 8 shows a representative MR-ARFI image with a single frame from the subsequent thermal ablation. As in Fig. 7, the ARFI and thermometry images are located inside the rectangular tiles positioned on the larger FOV image. In this frame, the ARFI and ablation foci are both similar distances from the marked fiducial markers. In this example, sagittal displacement maps were also acquired, although no thermometry was acquired in this orientation.
Figure 8.
Representative free breathing sagittal and coronal MR-ARFI gated verification images (prior to ablation) compared with an image from a free breathing thermal ablation. In all images, the ARFI image or thermometry image is only the part contained in the rectangular tile. The outer image is a large FOV anatomical reference image. In this example, the horizontal line highlights that the spots are aligned in the inferior∕superior direction. As discussed in Table TABLE II., the mean error during the six ablations, measured in the non respiration direction, was 1.03 mm.
Table TABLE II. shows the distances of 6 MR-ARFI spots and their corresponding ablation spot from the left of the image, as well as the average registration error between spots. Along the left∕right dimension, the standard deviation of error was less than 1 mm.
Table 2.
Distances from the left of an image to the center of steered, gated ARFI and corresponding steered, breathing ablation foci. The left∕right (L∕R) direction was orthogonal to the main axis of motion. The error in the nonmotion direction was approximately 1 mm, suggesting good alignment between the MR-ARFI and the thermal foci.
| 1 | 2 | 3 | 4 | 5 | 6 | |
|---|---|---|---|---|---|---|
| ARFI L∕R (mm) | 116.38 | 127.86 | 102.45 | 103.27 | 101.63 | 117.3 |
| Ablation L∕R (mm) | 115.56 | 127.86 | 103.27 | 100.81 | 103.27 | 117.7 |
| Error L∕R (mm) | 0.82 | 0.00 | −0.82 | 2.46 | −1.64 | −0.40 |
| Mean Error (mm) | 0.07 | |||||
| Std Error (mm) | 1.43 | |||||
| Mean |Error L∕R| (mm) | 1.02 | |||||
| Std |Error L∕R| (mm) | 0.89 |
DISCUSSION
In this work, we demonstrated MR-ARFI imaging of the in vivo liver. We first demonstrated the ARFI sequence functionality in a phantom, and then performed a series of experiments in breath-holds in the porcine model, including displacement versus power tests. Finally, we showed how straightforward it is to use MR-ARFI to visualize the beam as it is steered through the liver, thereby allowing prethermal ablation calibration.
The phantom experiments demonstrated that our real time system was properly integrated and that we could measure displacement and temperature. We demonstrated success in localizing both displacement and thermal foci in two dimensions in these conditions. The A∕P central location of the focus in the image parallel to the beam was off more than the other directions, but this error was still less than 2 mm, well smaller than the 18 mm length of the focal spot.19
We have successfully captured in vivo radiation force displacement images visualizing the focus of a HIFU transducer. As the ultrasound power demonstrated, we were correctly looking at an ARFI spot and could control the focal spot location as desired. When focused at the same spot, the displacement varied nearly linearly with acoustic power, with a near zero y-intercept. The slope and actual peak displacement could vary based on factors such as transducer coupling, the transducer’s inherent ability to focus at a location, and the tissues in the propagation path; this was also evident in the steering test, where different displacements were recorded based on the focus location. The near zero y-intercept suggests that, unlike thermal ablations, the ARFI sonication is relatively immune to the high perfusion common in the liver. Thus, potentially small peak powers delivered to the transducer can produce enough displacement contrast to visualize the focus; in Fig. 3, just 83 W acoustic power for 30.4 ms was enough to discern the focus amongst the background. This sensitivity, combined with the ease of steering that the ultrasound steering experiment demonstrated, shows how valuable a tool MR-ARFI could become for calibrating the focal spot location.
Our initial ARFI and thermal ablation experiments were either breath-holds or based on a single calibration point at a single value of the respiratory signal that we then extrapolated to all respiratory signal values. Given that we were not ablating through ribs; the primary error would be from aberration effects on the transducer focus from passing through many layers of tissue or transducer localization errors that could be fixed by applying this single constant correction across all respiratory signal values. Our future steps will include validating the calibration spot over the entire range of the respiratory cycle and demonstrating this complete match with thermal ablation. Additionally, although Fig. 8 demonstrated our ability to utilize our sequence parallel to the beam; we aim to further integrate this functionality into our calibration experiments.
With the single shot pulse sequence, simple MR-ARFI calibration required only four TRs to assess the focal location (two for a precalibration displacement image, two for a postcalibration verification). With ultrasound on for 30.4 ms of each TR, the amount of energy applied per calibration was 20.2 J at a duty cycle of 0.6%. This highlights a second advantage of calibration with displacement. A typical HIFU calibration test ablation delivers 40 W acoustic power for 20 s, resulting in 800 J of energy deposited at the treatment site, or 1600 J if verified. Compared to a typical HIFU ablation that delivers 4000 J, these test ablations are already as high as 40% of this energy compared with an MR-ARFI calibration (0.5%). While this might not be particularly important in the liver, if the dose is errantly applied elsewhere it could become significant, particularly, in tissues with less perfusion like ribs.28 These test spots are further complicated by perfusion and respiration. As mentioned previously, we are not measuring a thermal effect and are thus not sensitive to perfusion. Since the effect happens in milliseconds, our MR-ARFI calibration protocol can be completed without needing to compensate for respiratory motion. Instead, simple gating yields accurate, high contrast results. Given MR-ARFI’s ease of use and the fact that our final experiment demonstrates that thermal ablation occurred where the MR-ARFI image predicted, this protocol could be used very early in a HIFU session to predict treatment success.
Because of MR-ARFI’s high contrast focus at minimal power, additional calibration tools in addition to X, Y, and Z location can be developed. More complicated phasing techniques such as adaptive focusing could be utilized to optimize the focus in the liver to improve ablation outcomes.11 MR-ARFI also has the potential for providing feedback regarding turning on and off elements, which is particularly of importance when focusing through the ribs.28 For example, ARFI algorithms could be developed to minimize the number of active elements in the presence of ribs by seeing how the maximum displacement at a focus changes as elements are deactivated. The same principle could be applied to deactivating elements in poorly coupled areas of the transducer.
To utilize these more repetitive algorithms, our MR-ARFI protocol could also be reduced to a true single shot (with no opposite polarity displacement encoding gradients), where displacement is reconstructed from one of the images. With single shot imaging, there is a decreased SNR to visualize the focus. With a single shot MR-ARFI acquisition and the same or less deposited energy, the decrease in contrast could be compensated by increasing the power by a factor of √2. However, especially at a low frequency such as 550 kHz, there is a risk of exceeding the cavitation threshold when increasing the HIFU power.29 Additionally, the ARFI encoding gradient duration and timing could be optimized for liver tissue. For liver, the optimized encoding pulse width is 17.2 ms (the duration presented here is currently 16 ms).10 Also, as the displacement effect takes a several milliseconds to maximize,16 the ARFI-encoding gradient and HIFU synchronization could be offset to exploit this: the HIFU pulse could be activated a few milliseconds before the second lobe of the first bipolar gradient, and deactivated a few milliseconds before the second lobe of the second bipolar gradient.18
The SNR for the MR-ARFI technique was better or comparable to that of the MR-thermometry pulse sequence. While the SNR could suffer from the longer MR-ARFI echo time compared with the MR-thermometry sequence, the much longer TR and 90° flip angle excitations helped improve it. SNR calculations ranged from 12 to 24 for the MR-thermometry sequence, although SNR calculations for both sequences were largely dependent on the imaging slice’s location relative to the two imaging coils.
Despite the ease of visualizing the radiation force focus, these displacement values are not yet sufficient for more quantitative measurements of tissue elasticity. The transducer loses power intensity as the focus is steered around within the 30° range, but it is no worse than −3 dB at the shortest focal distance. Also, we are not determining the attenuation effects from tissue in the near field. Further studies will be focused on how best to utilize ARFI data for purposes in addition to localization, taking into account the above concerns, as well as effects from transducer coupling and ultrasound transmission path.
CONCLUSION
High intensity focused ultrasound ablations, particularly in the abdomen, can greatly benefit from utilizing MR-ARFI sequences to validate focal locations prior to treatment. We have implemented a sequence for MR-ARFI and tested it in an in vivo porcine model, creating multiple ARFI spots in the liver and visualizing them. As the current pulse sequence contains the same geometric distortions as our thermometry sequence, we demonstrated that MR-ARFI could be easily integrated with MR thermometry and thermal ablation to provide easy, accurate, and faster verification before treatments with minimal thermal dose.
ACKNOWLEDGMENTS
The authors would like to acknowledge Ron Watkins for RF coil construction, and Wendy Baumgardner and Pamela Hertz for their veterinary expertise and assistance. The authors also acknowledge Anne Sawyer for her assistance in preparing our in vivo scanning sessions. Finally, the authors acknowledge Alex Kavushansky, Tanya Zelikman, and Omer Brokman at InSightec, Ltd for assistance interacting and controlling the HIFU transducer.
The authors also acknowledge our funding sources: NIH R01 CA121163, NIH P41 RR009784, and the Richard M. Lucas Foundation.
References
- Chapman A. and ter Haar G., “Thermal ablation of uterine fibroids using MRguided focused ultrasound: a truly non-invasive treatment modality,” Eur. Radiol. 17, 2505–2511 (2007). 10.1007/s00330-007-0644-8 [DOI] [PubMed] [Google Scholar]
- Murat F. J. and Gelet A., “Current status of high-intensity focused ultrasound for prostate cancer: technology, clinical outcomes, and future,” Curr. Urol. Rep. 9, 113–121 (2008). 10.1007/s11934-008-0022-3 [DOI] [PubMed] [Google Scholar]
- Hynynen K., Clement G. T., McDannold N., Vykhodtseva N., King R., White P. J., Vitek S., and Jolesz F. A., “500-element ultrasound phased array system for noninvasive focal surgery of the brain: A preliminary rabbit study with ex vivo human skulls,” Magn. Reson. Med. 52, 100–107 (2004). 10.1002/mrm.v52:1 [DOI] [PubMed] [Google Scholar]
- Martin E., Jeanmonod D., Morel A., Zadicario E., and Werner B., “High-intensity focused ultrasound for noninvasive functional neurosurgery,” Ann. Neurol. 66, 858–861 (2009). 10.1002/ana.21801 [DOI] [PubMed] [Google Scholar]
- Gedroyc W. M., “New clinicial applications of magnetic resonance-guided focused ultrasound,” Top. Magn. Reson. Imaging 17, 189–194 (2006). 10.1097/RMR.0b013e318038f782 [DOI] [PubMed] [Google Scholar]
- Illing R. O., Kennedy J. E., Wu F., ter Haar G. R., Protheroe A. S., Friend P. J, Gleeson F. V., Cranston D. W., Phillips R. R., and Middleton M. R., “The safety and feasibility of extracorporeal high-intensity focused ultrasound (HIFU) for the treatment of liver and kidney tumours in a western population,” Br. J. Cancer 93, 890–895 (2005). 10.1038/sj.bjc.6602803 [DOI] [PMC free article] [PubMed] [Google Scholar]
- Torr G. R., “The acoustic radiation force,” Am. J. Phys. 52, 402–408 (1984). 10.1119/1.13625 [DOI] [Google Scholar]
- Nightingale K., Soo M. S., Nightingale R., and Trahey G., “Acoustic radiation force impulse imaging: In vivo demonstration of clinical feasibility,” Ultrasound Med. Biol. 28, 227–235 (2002). 10.1016/S0301-5629(01)00499-9 [DOI] [PubMed] [Google Scholar]
- McDannold N. and Maier S. E., “Magnetic resonance acoustic radiation force imaging,” Med. Phys. 35, 3748–3758 (2008). 10.1118/1.2956712 [DOI] [PMC free article] [PubMed] [Google Scholar]
- Chen J., Watkins R., and Butts Pauly K., “Optimization of encoding gradients for MR-ARFI,” Magn. Reson. Med. 63, 1050–1058 (2010). 10.1002/mrm.22299 [DOI] [PMC free article] [PubMed] [Google Scholar]
- Larrat B., Pernot M., Montailo G., Fink M., and Tanter M., “MR-guided adaptive focusing of ultrasound,” IEEE Trans. Ultrason. Ferroelectr. Freq. Control 57, 1734–1747 (2010). 10.1109/TUFFC.2010.1612 [DOI] [PMC free article] [PubMed] [Google Scholar]
- Auboiroux V., Hyacinthe J.-N., Roland J., Viallon M., Petruca L., Goget Th., Gross P., Becker C. D., and Salomir R., “MR-guided focused ultrasound: Acoustic radiation force imaging simultaneous with PRFS thermal monitoring at 3T using a fast GRE-EPI sequence,” Proceedings 8th Interventional MRI Symposium, pp. 98–100 (Leipzig, Germany, 2010).
- Rieke V., Vigen K. K., Sommer G., Daniel B. L., Pauly J. M., and Butts K., “Referenceless PRF shift thermometry,” Magn. Reson. Med. 51, 1223–1231 (2004). 10.1002/mrm.v51:6 [DOI] [PubMed] [Google Scholar]
- Kuroda K., Kokuryo D., Kumamoto E., Suzuki K., Matsuoka Y., and Keserci B., “Optimization of self-reference thermometry using complex field estimation,” Magn. Reson. Med. 56, 835–843 (2006). 10.1002/mrm.v56:4 [DOI] [PubMed] [Google Scholar]
- Callé S., Remenieras J. P., Matar O. B., Hachemi M. E., and Patat F., “Temporal analysis of tissue displacement induced by a transient ultrasound radiation force,” J. Acoust. Soc. Am. 118, 2829–2840 (2005). 10.1121/1.2062527 [DOI] [PubMed] [Google Scholar]
- Nightingale K. R., Palmeri M. L., Nightingale R. W., and Trahey G. E., “On the feasibility of remote palpation using acoustic radiation force,” J. Acoust. Soc. Am. 110, 625–634 (2001). 10.1121/1.1378344 [DOI] [PubMed] [Google Scholar]
- Roulot D., Czernichow S., Le Cieslau H., Costes J. L., Vergnaud A. C., and Beaugrand M., “Liver stiffness values in apparently healthy subjects: Influence of gender and metabolic syndrome,” J. Hepatol. 48, 606–613 (2008). 10.1016/S0168-8278(08)60967-8 [DOI] [PubMed] [Google Scholar]
- Hertzberg Y., Volovick A., Zur Y., Medan Y., Vitek S., and Navon G., “Ultrasound focusing using magnetic resonance acoustic radiation force imaging: Application to ultrasound transcranial therapy,” Med. Phys. 37, 2934–2942 (2010). 10.1118/1.3395553 [DOI] [PubMed] [Google Scholar]
- Kaye E., Chen J., and Butts Pauly K., “Rapid MR-ARFI method for focal spot localization during focused ultrasound therapy,” Magn. Reson. Med. 65, 738–743 (2011). 10.1002/mrm.22662 [DOI] [PMC free article] [PubMed] [Google Scholar]
- Holdsworth S. J., Skare S., Newbould R. D., Guzmann R., Blevins N. H., and Bammer R., “Readout-segmented EPI for rapid high resolution diffusion imaging at 3T,” Eur. J. Radiol. 65, 36–46 (2008). 10.1016/j.ejrad.2007.09.016 [DOI] [PMC free article] [PubMed] [Google Scholar]
- Santos J. M., Wright G. A., and Pauly J. M., “Flexible real-time magnetic resonance imaging framework,” Conf. Proc. IEEE Eng. Med. Biol. Soc. 2, 1048–1051 (2004). [DOI] [PubMed] [Google Scholar]
- Dumoulin C. L., Mallozzi R. P., Darrow R. D., and Schmidt E. J., “Phase-Field dithering for active catheter tracking,” Magn. Reson. Med. 63, 1398–1403 (2010). 10.1002/mrm.22297 [DOI] [PubMed] [Google Scholar]
- Holbrook A. B., Santos J. M., Kaye E., Rieke V., and Butts Pauly K., “Real-time MR thermometry for monitoring HIFU ablations of the liver,” Magn. Reson. Med. 63, 365–373 (2010). 10.1002/mrm.22206 [DOI] [PMC free article] [PubMed] [Google Scholar]
- Grissom W. A., Holbrook A. B., Rieke V., Lustig M., Santos J. M., McConnell M. V., and Butts Pauly K., “Hybrid referenceless and multibaseline subtraction MR thermometry for monitoring thermal therapies in moving organs,” Med. Phys. 37, 5014–5026 (2010). 10.1118/1.3475943 [DOI] [PMC free article] [PubMed] [Google Scholar]
- Roemer R. B., Fletcher A. M., and Cetas T. C., “Obtaining local SAR and blood perfusion data from temperature measurements: Steady state and transient techniques compared,” Int. J. Radiat. Oncol., Biol., Phys., 11(8), 1539–1550 (1985). 10.1016/0360-3016(85)90343-8 [DOI] [PubMed] [Google Scholar]
- Josan S., Holbrook A. B., Kaye E., Law C., and Butts Pauly K., “Analysis of focused ultrasound hotspot appearance on EPI and Spiral MR Imaging,” Proc. Intl. Soc. Mag. Reson. Med, 18, 1802 (2010). [Google Scholar]
- Gudbjartsson H. and Patz S., “The rician distribution of noisy MRI data,” Magn. Reson. Med. 34, 910–914 (1995). 10.1002/mrm.v34:6 [DOI] [PMC free article] [PubMed] [Google Scholar]
- Quesson B., Merle M., Roujol S., de Senneville B. D., and Moonen C. T., “A method for MRI guidance of intercostal high intensity focused ultrasound ablation in the liver,” Med. Phys. 37, 2533–2540 (2010). 10.1118/1.3413996 [DOI] [PubMed] [Google Scholar]
- Hynynen K., “The threshold for thermally significant cavitation in dog’s thigh muscle in vivo,” Ultrasound Med. Biol. 17(2), 157–169 (1991). 10.1016/0301-5629(91)90123-E [DOI] [PubMed] [Google Scholar]


