Abstract
Electroporation, a non-virus-mediated gene transfection method, has traditionally had poor outcomes with low gene transfection efficiency and poor cellular viability, particularly in primary human lymphocytes. Herein we have optimized the electroporation conditions for primary CD8+ cells resulting in a maximum rate of 81.3%, and a mean transfection efficiency of 59.6%. After removal of dead cells, the viability of transfected primary CD8+ cells was greater than 90%, similar to untransfected controls. Using this procedure, primary human CD8+ cells transfected with an interferon α8 plasmid produced fluids that inhibited HIV-1 replication by >95%. This transfection protocol is useful for transfection of other primary blood cells, such as CD4+ T cells, and for studying the function of genes in primary human blood cells instead of cell lines. The transfection procedure also has potential application in gene therapy clinical trials to treat diseases utilizing transfected primary human cells.
Keywords: Primary Human CD8+ cells, Electroporation, Transfection, HIV-1
Introduction
Successfully introducing foreign nucleic acids into primary human cells is a major challenge in gene therapy. Various methods have been developed to transfect these cells, such as chemical (lipids and polymers), physical (electroporation, sonoporation, gene gun, hydrodynamic gene transfer and microinjection) and viral vector methods (Zhang and Godbey, 2006; Romano, 2007; Mir, 2008; Schaffer et al., 2008; Al-Dosari and Gao, 2009). Among these methods, electroporation is the most widely used to transfect primary cells and many cell lines, but its efficiency is inconsistant.
The electroporation technology was first utilized almost 30 years ago for transfection in vitro (Neumann et al., 1982), and subsequently in vivo (Titomirov et al., 1991). The amaxa Nucleofector™ transfection system was developed in 2002 in which only 200,000 cells per transfection were needed. This system can transfect primary human cells with moderate efficiencies (28.9% to 45.3%) with a viability of 16.5% in mesenchymal stem cells, compared to untreated cells (Hamm et al., 2002).
CD8+ T cells play a vital role in controlling retrovirus replication in HIV infection in humans, and SIV infection in rhesus macaques (Koup and Ho, 1994; Levy et al., 1996; Ogg et al., 1998; Lifson et al., 2001). CD8+ T cells can inhibit HIV replication through both non-cytotoxic and conventional cytotoxic mechanisms (Walker et al., 1986; Walker et al., 1991; Levy et al., 1996). In the pre-HAART era, HIV-1 infected patients typically progressed to AIDS because of a loss of cellular antiviral responses, resulting in immune disorders. In rare cases, however, the function of CD8+ T cells in controlling viral replication is maintained, and the infected individuals remain healthy without treatment for many years (e.g. long term survivors) (Levy et al., 1996; Barker et al., 1998).
A major mechanism correlating with long-term survival is the production by CD8+ cells of a CD8+ cell anti-HIV factor (CAF). To evaluate human genes associated with CAF production, we sought an effective procedure for primary CD8+ cell gene transfection. Toward this objective, we optimized conditions for the transfection of primary human CD8+ cells. The highest transfection efficiency was 81.3%. The transfection efficiency improved when using CD8+ cells isolated via Dynal immunomagenetic beads than by Miltenyi beads. After the removal of dead cells, the viability of transfected primary CD8+ cells was comparable to untreated cells. We show that this technology can be used successfully to evaluate genes, such as interferon, for biologic activity.
Material and Methods
1.1 Primary Human CD8+ Cell Preparation
Human buffy coats were obtained from the Blood Centers of the Pacific, San Francisco, CA. Peripheral blood mononuclear cells (PBMC) were prepared by Histopaque-1077 density gradient centrifugation (Sigma-Aldrich, St. Louis, MO). The resultant PBMC layer was collected and cells were washed twice with Hank’s Balanced Salt Solution (HBSS) (Mediatech Inc., Manassas, VA). PBMC were resuspended in standard growth medium consisting of RPMI 1640 (Mediatech Inc., Manassas, VA), 10% heat-inactivated (56°C, 30min) fetal bovine serum (GIBCOBRL, Carlsbad, CA), 2mM L-glutamine, and 100 μg/ml of penicillin and streptomycin (Tissue Culture Facility, University of California, San Francisco, CA).
Primary CD8+ cells were obtained by positive selection immunomagenetic (IM) bead isolation using Dynal beads (Cat. No. 113.33D, Invitrogen, Oklo, Norway) or Miltenyi beads (Mat. No. 120-000-244, Miltenyi Biotec, Auburn, CA) bearing an anti-CD8 monoclonal antibody. The Dynal IM beads were removed using Detach-a-beads (Invitrogen, Oklo, Norway).
1.2 Primary CD8+ Cell Transfection
The primary CD8+ cells were washed with 1xDulbecco’s Phosphate Buffered saline (DPBS) (without calcium and magnesium, Mediatech Inc., Manassas, VA), then resuspended in Buffer T (Lot No. ALDV0809, Invitrogen, Carlsbad, CA) at the concentration of 20×106/ml. Maxi-prep purified plasmids (1mg/ml in ddH2O) (Cat. No. K2100-17, Invitrogen, Carlsbad, CA) were then added to the cell mixture. The primary cells were transfected under varying conditions using the Invitrogen Neon transfection kit. The cells were resuspended in 500 μl standard growth medium without penicillin and streptomycin, and incubated for 24 hours at 37°C and 5% CO2.
1.3 Removal of Dead and Dying Cells
Transfected primary CD8+ cells were collected and centrifuged at 300g for 5 mins. Supernatants were removed and the cells were resuspended in 100 μl of dead cell-removal beads (Lot No. 5090922114, Miltenyi Biotec, Auburn, CA) per 107 cells as described by the manufacturer. The mixture was incubated at room temperature for 15 min and added to an MS column (Miltenyi Biotec, Auburn, CA). The columns were then washed four times with binding buffer. Live cells were collected from the flow-through.
1.4 Human IFN-α ELISA
The human IFN-α Muti-Subtype ELISA Kit (Pestka Biomedical Laboratories Inc., Piscataway, NJ) was employed in this study. The procedures followed the manufacturer’s instruction.
1.5 IFN Suppression by Transfected primary CD8 + Cells
Two million freshly isolated primary human CD8+ cells were transfected with 100 μl tips containing the IFN-α plasmid or plasmid control. The transfected CD8+ cells were then treated with the dead cell removal kit. After 24 hours, the supernatant of the transfected CD8+ cells was collected and added to HIV-1SF2 (Subtype B, CXCR4 tropism)-acutely infected CD4+ cells plated in triplicate in a 96 well plate (Mackewicz et al., 1994). At 2-day intervals, 100 μl aliquots of culture supernatants were collected from each well and assayed for reverse transcriptase (RT) activity as described (Hoffman et al., 1985). Wells were refed with 50 μl of fresh standard growth medium containing 100 units Hu rIL-2 (Invitrogen, Camarillo, CA) and 50 μl of cell supernatant. The percent of HIV suppression was calculated relative to virus replication in untreated cultured HIV-1SF2-infected CD4+ cells.
1.6 Flow Cytometry Assay
The purified CD8+ cells were stained with fluorochrome-conjugated antibodies using a standard protocol. Flow cytometry was performed on the BD FACSort using the FCS Express V3 for data analysis. For measuring dead cells, the Annexin V-APC Apoptosis Detection Kit and Propidium Iodide were obtained from eBioscience. (Cat. No. 88-8007, 00-6990-50) Mouse IgG2a, Mouse IgG1, Human HLA-DR, CD3, CD4, CD8, CD16,56, CD38, CD25 were purchased from BD Biosciences, San Diego, CA.
1.7 Confocal imaging of GFP-positive CD8+ cells
Two million un-stimulated primary CD8+ cells were transfected with the GFP plasmid or buffer alone under 20ms/Pulse1/2200V. After removal of dead cells, the nuclei of CD8+ cells were stained with Hoechst33342 (Invitrogen, Camarillo, CA) (2 μg/ml) at room temperature for 15 min. Cells were washed with 1xDPBS and fixed with 4% paraformaldehyde (PFA) at room temperature for 10 min. Confocal microscopy imaging was taken using a Leica CTR 6500 (Leica Microsystems, Heidelberg, Germany) with 20x and 40xZoom4x objectives.
Results
2.1 Optimized Transfection Conditions for Primary Human CD8+ Cells
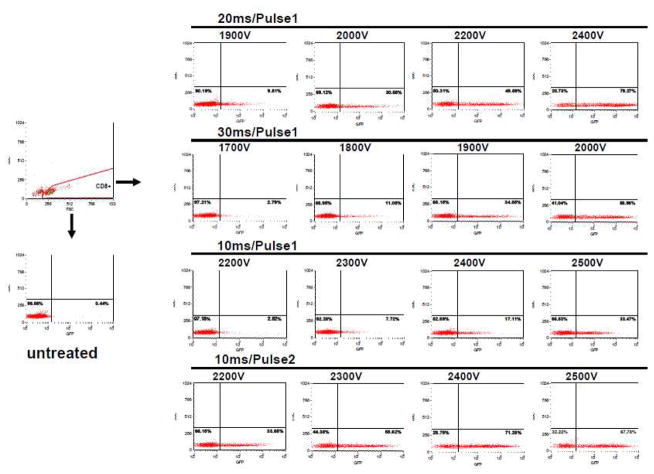
Primary human CD8+ cells were transfected with a GFP plasmid (Invitrogen, Camarillo, CA) under the following experimental conditions: untreated, 20ms/Pulse1 with different voltages, 30 ms/Pulse1 with different voltages, and 10 ms with one or two pulses with different voltages. The transfection rate (the percentage of GFP-positive) in untreated cells for all experiments was less than 2% (Fig. 1). With 20ms/Pulse1, the transfection rates were never greater than 9% for voltages below 1900V (Table 1). The transfection rate increased with increasing voltage (Fig. 1). Both the mean and median values were greater than 50% if the voltage was 2200V. This procedure was reproducible in twenty studies using primary human CD8+ cells, two frozen CD8+ cell preparations and three samples of CD8+ cells isolated from HIV-1 infected individuals. The highest transfection rate was 81.3% with 20ms/Pulse1/2400V using CD8+ cells isolated by Dynal beads. With 30ms/Pulse1, the percentage of GFP-positive cells was less than 20% for voltages under 1750V. The transfection rates were greater than 50% if the voltage was greater than 1950V. With 10ms/Pulse1, all the transfection rates were less than 35%. However, if these cells were transfected twice, using 2 pulses, then the transfection rate increased by more than 20% (Table 1). The percentage of GFP-positive CD8+ cells was greater than 50% with voltages greater than 2350V. Similar observations were made at 2400V for cells isolated with the Miltenyi kit (Table 1).
Fig. 1. Primary CD8+ cell transfection efficiency under different conditions.
Primary human CD8+ cells were freshly isolated using Dynal or Miltenyi immunomagenetic (IM) beads from normal buffy coats and washed once with phosphate buffered saline (PBS). 200,000 cells were electroporated in 10 μl tips in Buffer T with 1 μl of 1 μg/μl GFP plasmid. The transfection efficiency was tested by flow cytometery (BD FACsort), 24 hours after electroporation. Transfection conditions were varied to compare the effect of different voltages, pulse widths (10 ms, 20 ms or 30 ms) and pulse repetitions (once or twice) on transfection efficiency. This figure shows transfection efficiency of CD8+ cells isolated using Dynal beads.
Table 1.
Primary CD8+ cell transfection efficiency and viability
| Voltage (V) | CD8+ cell isolated by the Dynal Kit | CD8+ cell isolated by the Miltenyi Kit | |||||||||||||||
|---|---|---|---|---|---|---|---|---|---|---|---|---|---|---|---|---|---|
| Transfection Efficiency (%) | Viability (%) | Transfection Efficiency (%) | Viability (%) | ||||||||||||||
| Range | Mean | Median | SD | Range | Mean | Median | SD | Range | Mean | Median | SD | Range | Mean | Median | SD | ||
| 20ms/Pulse1 | 1900 | 0.7–8.3 | 4.1 | 2.8 | 3. 3 | 37–67 | 55.7 | 59.0 | 11.4 | 0.6–4.9 | 1.9 | 1.9 | 1.4 | 34–68 | 52.3 | 51.0 | 10.8 |
| 2000 | 4.3–29.8 | 13. 4 | 6.5 | 9. 9 | 34–62 | 50.4 | 55.0 | 10.8 | 1.3–21.6 | 11.1 | 11.7 | 7.1 | 26–65 | 47.4 | 52.0 | 12.0 | |
| 2100 | 18.1–48.8 | 31.5 | 22.3 | 14.1 | 27–59 | 45.3 | 49.0 | 11.3 | 1.6–40.6 | 27.4 | 30.6 | 13.9 | 20–61 | 42.3 | 46 | 12.6 | |
| 2200 | 50.5–72 | 59.6 | 56.4 | 7.2 | 19–57 | 34.6 | 34.0 | 12.7 | 35.3–71.2 | 55.3 | 56.2 | 11.3 | 13–53 | 31.9 | 35.0 | 12.3 | |
| 2300 | 66.4–74.4 | 72.3 | 73.4 | 2.7 | 9–46 | 24.4 | 20.0 | 12.9 | 54–73.4 | 67.5 | 69.7 | 6.1 | 6–42 | 20.4 | 16.0 | 11.2 | |
| 2400 | 55.9–81.3 | 69.2 | 70.2 | 8.9 | 5–39 | 18.6 | 14.0 | 11.7 | 47.5–71 | 60.6 | 60.8 | 8.1 | 4–35 | 14.3 | 10.0 | 9.9 | |
| 30ms/Pulse1 | 1700 | 0.9–13.3 | 4.9 | 4.9 | 4.0 | 39–73 | 60.3 | 64.0 | 12.2 | 0.5–5.4 | 2.6 | 2.4 | 1.8 | 39–73 | 56.3 | 58.0 | 10.8 |
| 1800 | 7.3–26.7 | 15.2 | 10.0 | 8.5 | 30–68 | 52.9 | 57.0 | 13.1 | 6.3–14.2 | 15.1 | 15.8 | 6.9 | 29–67 | 47.4 | 41.0 | 11.7 | |
| 1900 | 27.7–51 | 38.9 | 34.1 | 8.8 | 20–62 | 43.3 | 49.0 | 13.8 | 23.7–52.3 | 37.3 | 38.2 | 10.4 | 17–62 | 37.3 | 36.0 | 13.7 | |
| 2000 | 41.8–60.5 | 52.4 | 51.9 | 5.8 | 7–52 | 26.4 | 27.0 | 14.1 | 40.3–54.8 | 48.8 | 51.7 | 5.9 | 7–45 | 20.3 | 19.0 | 11.1 | |
| 10ms/Pulse1 | 2200 | 0.4–2.2 | 1.1 | 0.7 | 0.7 | 29–66 | 52.9 | 56.0 | 12.9 | 0.4–2.1 | 0.9 | 0.7 | 0.5 | 29–66 | 52.0 | 56.0 | 12.4 |
| 2300 | 0.5–6.4 | 2.4 | 1.7 | 2.1 | 27–65 | 50.9 | 54.0 | 13.6 | 0.5–6.4 | 2.0 | 1.7 | 1.9 | 27–65 | 49.9 | 54.0 | 13.0 | |
| 2400 | 0.9–14.5 | 6.8 | 5.6 | 5.7 | 28–60 | 48.4 | 52.0 | 12.4 | 0.9–14.5 | 5.3 | 5.6 | 4.2 | 28–60 | 47.0 | 51.0 | 11.6 | |
| 2500 | 5.3–34.8 | 18.7 | 17.0 | 10.4 | 25–56 | 44.0 | 49.0 | 11.7 | 5.3–31.5 | 16.3 | 17.0 | 8.0 | 25–56 | 43.0 | 47.0 | 11.3 | |
| 10ms/Pulse2 | 2200 | 3.5–33.3 | 20.1 | 23.4 | 10.2 | 27–61 | 46.7 | 52.0 | 12.3 | 5.7–27 | 16.6 | 14.3 | 8.2 | 19–58 | 38.0 | 41.0 | 12.7 |
| 2300 | 18.5–54.2 | 38.8 | 44.4 | 12.2 | 23–56 | 41.6 | 46.0 | 11.4 | 20.4–51.7 | 34.8 | 31.3 | 11.1 | 16–53 | 33.9 | 36.0 | 12.1 | |
| 2400 | 48.5–74.6 | 62.3 | 65.5 | 8.7 | 14–43 | 31.3 | 35.0 | 10.3 | 37.3–65.6 | 50.6 | 46.4 | 10.7 | 12–52 | 31.9 | 30.0 | 13.4 | |
| 2500 | 18.9–76.8 | 63.6 | 71.2 | 19.1 | 4–29 | 14.9 | 14.0 | 7.8 | 59.5–70.5 | 65.3 | 65.4 | 4.5 | 7–33 | 21.0 | 13.0 | 12.6 | |
Procedures are described in Material and Methods.
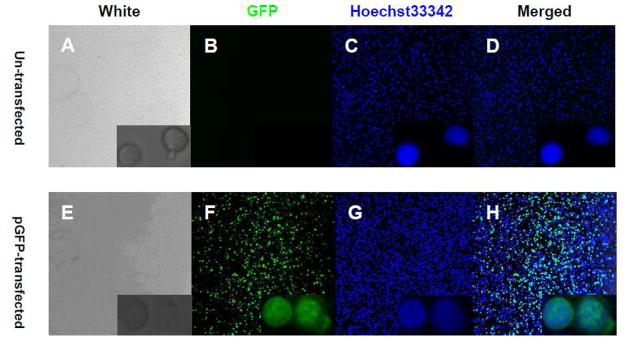
As the voltage increased, the viability of transfected primary human CD8+ cells decreased (Table 1). With 20ms/Pulse1/1900V, the viability averaged 55.7% (isolated by the Dynal kit) and 52.3% (isolated by the Miltenyi kit). Mean viability was 34.6% (for CD8+ cells isolated by the Dynal kit) and 31.9% (for CD8+ cells isolated by the Miltenyi kit) for the 2200V setting (n=7). With 30ms/Pulse1, the mean cell viability was greater than 35% for voltages under 1900V. With 10ms/Pulse1, the viability of all cells was greater than 35%. When the primary CD8+ cells were transfected twice, the mean viability was greater than 35% for voltages under 2350V for CD8+ cells isolated by the Dynal kit, and under 2250V for CD8+ cells isolated by the Miltenyi kit (Table 1). In summary, the optimal conditions for transfection of primary CD8+ cells and CD4+ cells (data not shown) was 20ms/Pulse1/2200V using cells isolated by Dynal IM beads (Table 1). This finding was supported by confocal microscopy imaging which showed greater than 80% transfection efficiency (GFP positive cells compared to Hochest positive cells) with the GFP plasmid (Fig. 2).
Fig. 2. Confocal imaging of GFP expression in primary human CD8+ cells.
Two million CD8+ cells were transfected with GFP plasmid or transfection buffer. After removal of dead cells, the nuclei of CD8+ cells were stained with Hoechst33342 (2 μg/ml) and cells were fixed with 4% paraformaldehyde (PFA). Confocal photos were taken using 20x and 40xZoom4x (low right corner) lens. A-D, primary human CD8+ cells were transfected with buffer as control. E-H, primary human CD8+ cells were transfected with GFP plasmid under 20ms/Pulse1/2200V conditions.
2.2 Removal of Dead and Dying Cells
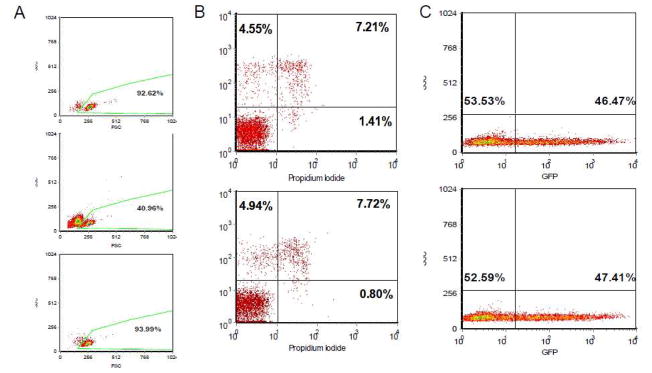
Two million primary human CD8+ cells were transfected with the GFP plasmid and dying or dead cells were removed 24 hours after electroporation. The viability and GFP expression of transfected and untreated cells were measured by FACsort. The viability of untreated primary CD8+ cells was 92.82% after 24 hours culture in the standard growth medium (Fig. 3A). The percentage of live cells was 40.96% under the transfection condition (20ms/Pulse1/2200V). However, the viability was 93.99% upon removal of dead cells (Fig. 3A). There was <1% dead cells in the dead cell-removed culture (Fig. 3B). Importantly, the elimination of dead cells did not change the percentage of GFP-positive cells among the viable cells (Fig. 3C).
Fig. 3. Removal of Dead and dying cells.
Two million primary CD8+ cells were either untreated or transfected in 100 μl tips in Buffer T with 10 μl of 1 μg/μl GFP plasmid under the following conditions: 20ms/Pulse1/2200V. The dying and dead cells were removed using a dead cell removal kit. A) Cell viability was tested by flow cytometry (BD FACsort) 24 hours after electroporation. Upper panel: untreated cells; middle panel: cells prior to dead cell removal; less panel: cells after dead cell removal. B) Untreated primary CD8+ cells (upper panel) and transfected CD8+ cells after dead cell removal (less panel). The cells were stained with Annexin and Propidium Iodide. C) The transfection efficiency was not changed by dead cell removal. The percentage of GFP-positive cells was tested before (upper panel) and after (less panel) dead cell removal.
2.3 The IFN-a8 Expressed by Primary CD8+ cells Suppresses HIV-1
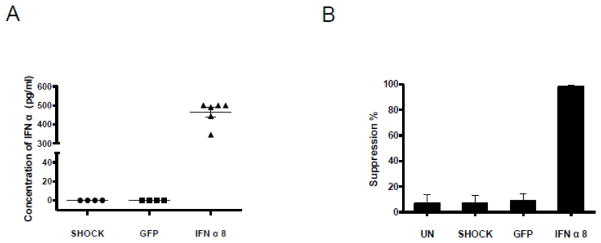
An IFN-α8 plasmid was transfected into primary CD8+ cells at 20 million cells/ml in 100 μl tips by the optimal transfection procedures (20ms/Pulse1/2200V). The transfected cells were treated with the dead-cell removal kit and cultured in standard growth medium at the concentration of 1 million cells/ml for 24 hours. The primary CD8+ cells expressed an average of 486 pg/ml of IFN-α per million cells as measured by ELISA. No IFN-α expression was detected in non-plasmid and GFP plasmid transfected cells (Fig. 4A).
Fig. 4. IFN-α8 plasmid expression and suppression of HIV-1.
Two million primary CD8+ cells were transfected in 100 μl tips in Buffer T with 10 μl of 1 μg/μl IFN-α8 plasmid. The conditions included: untreated, transfected with IFN-α8 plasmid (20ms/Pulse1/2200V) and transfection with buffer (shock). The GFP plasmid was transfected as another control. The dying and dead cells were removed using a dead cell removal kit. The CD8+ cells were cultured in standard growth medium for 24 hours. The supernatants were collected by spinning at 3000 rpm. A) IFN-α8 expression was tested using a human IFN-α Muti-Subtype ELISA Kit. B) The CD8+ cell supernatant suppressed HIV-1 replication. The CD8+ cell supernatants were added to HIV-1SF2-infected CD4+ cells. The HIV viral load in culture supernatants was measured using the reverse transcriptase (RT) assay (Hoffman et al., 1985). Percent suppression was calculated relative to viral replication in untreated HIV-1SF2-infected CD4+ cells.
The supernatants collected from transfected primary human CD8+ cells were added to HIV-1SF2-infected CD4+ cells plated in triplicate in a 96 well plate. After 6 days, the percent suppression of HIV replication was >95%. No substantial suppression was observed with control supernatants (Fig. 4B).
2.4 The subsets of CD8+ cells isolated by IM beads
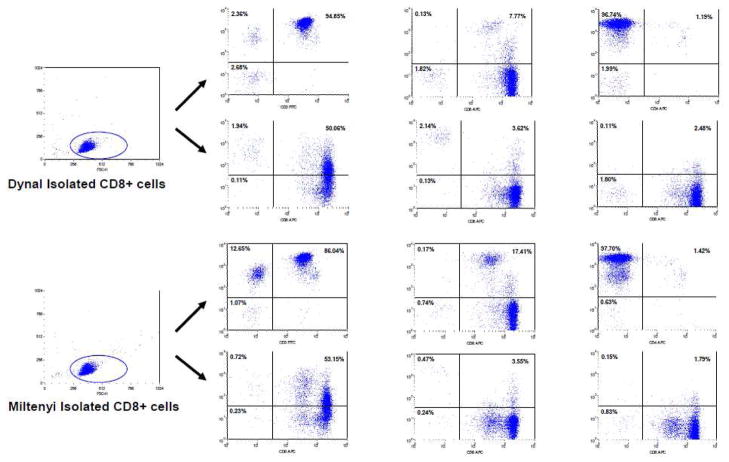
In these studies, our FACS data indicated that the Dynal and Miltenyi kits isolated different subsets of cells even though the purity of CD8+ cells was greater than 97%. When isolated by the Miltenyi kit, 13.72% of CD8+ cells were NK cells (CD3-CD8+) (Fig. 5). In contrast, 5.04% of CD8+ cells isolated by the Dynal kit were CD3-CD8+. This finding was confirmed by measuring the percentage of CD16/56+CD8+ cells (Fig. 5). There was no difference in the percentage of CD4+CD8+ double positive cells (Fig. 5). We also did not find any difference between CD8+ cells isolated using both kits in regards to cellular activation as measured by CD38, HLA-DR and CD25 staining (Fig. 5).
Fig. 5. Primary CD8+ cells subsets.
Primary CD8+ cells were freshly isolated using Dynal or Miltenyi IM beads. Cell subsets were identified using different monoclonal antibodies by flow cytometry (BD FACsort). Data shown were representative of experiments using three different normal buffy coats.
Discussion
These studies were performed to find the most effective procedure for evaluating human genes associated with production of a CD8+ cell anti-HIV factor (CAF). The anti-HIV activities of many known cellular factors, such as β-chemokines, are concentration-dependent (Cochhi et al., 1995). Therefore, we needed the highest gene transfection efficiencies to obtain sufficient amounts of proteins expressed by primary human CD8+ cells. We optimized voltage, duration and times of electroporation for efficient transfection of primary CD8+ cells. In previous studies, the electric field (voltage) applied to polyanionic DNA was noted to be an important factor for DNA transfection by electroporation (Andreason and Evans, 1989; Sukharev et al., 1992). In our study, we found that the transfection efficiency increased with increasing voltage (1700–2500V) under four different sets of conditions (varying pulse duration and frequency) (Fig. 1). The average transfection rate increased from 4.1% to 72.3% when increasing voltage under the 20ms/Pulse1 condition (Table 1).
Long pulses (greater than 5 ms) were more effective than short ones (100 μs) (Mir et al., 1999). We then compared the effect of pulse duration (10–30 ms) on transfection efficiency for primary CD8+ cells. Our data showed that 10ms was too short to effectively transfect primary CD8+ cells (Fig. 1). If the pulse duration increased from 10ms to 20ms, the transfection rate increased >30% (Table 1). We also compared 10ms/Pulse1 and 10ms/Pulse2 in the primary CD8+ cell electroporation. The transfection efficiency was substantially enhanced by the second pulse. The transfection rates increased greater than 40% at voltages >2300V (Table 1).
In this study, we observed >50% of transfected primary CD8+ cells were dying after electroporation due mostly to apoptosis. This effect was addressed by removal of the dead cells; the percentage of viable GFP-positive cells remained unchanged (Fig. 3C).
Our data also showed a difference in transfection efficiency and viability of the CD8+ cells isolated using the Dynal kit versus the Miltenyi kit (Table 1). This difference may be due to the Miltenyi kit isolating >10% of NK cells (CD3-CD8+) (Fig. 5). Another difference between the two kits is that the Dynal protocol uses detach-a-beads after isolation, whereas the beads remain attached to the cell membrane using the Miltenyi kit. In the latter case, both the beads and the polyanioic DNA share the electric field, resulting in lower transfection efficiencies. The optimal transfection conditions for primary CD8+ cells and CD4+ cells were 20ms/Pulse1/2200V using Dynal IM beads for cell isolation.
Most importantly, when transfecting the IFN-α8 plasmid into primary human CD8+ cells, the cell supernatants suppressed HIV-1 replication by >95%. This finding indicates that this process of gene transfection can lead to a biologically active protein. In summary, we report the highest transfection efficiency and viability reported thus far for primary human CD8+ cells. This protocol can also be used to optimize tranfection of CD4+ lymphocytes and other primary human blood cells.
Acknowledgments
We are grateful to HeeJung Choi, Sonia Bakkour and Scott Killian for their helpful advice.
Footnotes
Publisher's Disclaimer: This is a PDF file of an unedited manuscript that has been accepted for publication. As a service to our customers we are providing this early version of the manuscript. The manuscript will undergo copyediting, typesetting, and review of the resulting proof before it is published in its final citable form. Please note that during the production process errors may be discovered which could affect the content, and all legal disclaimers that apply to the journal pertain.
References
- Al-Dosari MS, Gao X. Nonviral gene delivery: principle, limitations, and recent progress. Aaps J. 2009;11:671–81. doi: 10.1208/s12248-009-9143-y. [DOI] [PMC free article] [PubMed] [Google Scholar]
- Andreason GL, Evans GA. Optimization of electroporation for transfection of mammalian cell lines. Anal Biochem. 1989;180:269–75. doi: 10.1016/0003-2697(89)90429-6. [DOI] [PubMed] [Google Scholar]
- Barker E, Mackewicz CE, Reyes-Teran G, Sato A, Stanford S, Fujimura SH, Christopherson C, Chang SY, Levy JA. Virological and Immunological Features of Long-Term Human Immunodeficiency Virus-Infected Individuals Who Have Remained Asymptomatic Compared With Those Who Have Progressed to Acquired Immunodeficiency Syndrome. Blood. 1998;92:3105–14. [PubMed] [Google Scholar]
- Cocchi F, DeVico AL, Garzino-Demo A, Arya SK, Gallo RC, Lusso P. Identification of RANTES, MIP-1α, and MIP-1β as the Major HIV-Suppressive Factors Produced by CD8+ T Cells. Science. 1995;270:1811–15. doi: 10.1126/science.270.5243.1811. [DOI] [PubMed] [Google Scholar]
- Hamm A, Krott N, Breibach I, Blindt R, Bosserhoff AK. Efficient transfection method for primary cells. Tissue Eng. 2002;8:235–45. doi: 10.1089/107632702753725003. [DOI] [PubMed] [Google Scholar]
- Hoffman AD, Banapour B, Levy JA. Characterization of the AIDS-associated retrovirus reverse transcriptase and optimal conditions for its detection in virions. Virology. 1985;147:326–35. doi: 10.1016/0042-6822(85)90135-7. [DOI] [PubMed] [Google Scholar]
- Koup RA, Ho DD. Shutting down HIV. Nature. 1994;370:416. doi: 10.1038/370416a0. [DOI] [PubMed] [Google Scholar]
- Levy JA, Mackewicz CE, Barker E. Controlling HIV pathogenesis: the role of the noncytotoxic anti-HIV response of CD8+ T cells. Immunol Today. 1996;17:217–24. doi: 10.1016/0167-5699(96)10011-6. [DOI] [PubMed] [Google Scholar]
- Lifson JD, Rossio JL, Piatak M, Jr, Parks T, Li L, Kiser R, Coalter V, Fisher B, Flynn BM, Czajak S, Hirsch VM, Reimann KA, Schmitz JE, Ghrayeb J, Bischofberger N, Nowak MA, Desrosiers RC, Wodarz D. Role of CD8(+) lymphocytes in control of simian immunodeficiency virus infection and resistance to rechallenge after transient early antiretroviral treatment. J Virol. 2001;75:10187–99. doi: 10.1128/JVI.75.21.10187-10199.2001. [DOI] [PMC free article] [PubMed] [Google Scholar]
- Mackewicz CE, Ortega H, Levy JA. The anti-HIV activity in CD8+ cell culture fluids is not associated with other known cytokines. Cell Immunol. 1994;153:329–43. doi: 10.1006/cimm.1994.1032. [DOI] [PubMed] [Google Scholar]
- Mir LM. Application of electroporation gene therapy: past, current, and future. Methods Mol Biol. 2008;423:3–17. doi: 10.1007/978-1-59745-194-9_1. [DOI] [PubMed] [Google Scholar]
- Mir LM, Bureau MF, Gehl J, Rangara R, Rouy D, Caillaud JM, Delaere P, Branellec D, Schwartz B, Scherman D. High-efficiency gene transfer into skeletal muscle mediated by electric pulses. Proc Natl Acad Sci U S A. 1999;96:4262–7. doi: 10.1073/pnas.96.8.4262. [DOI] [PMC free article] [PubMed] [Google Scholar]
- Neumann E, Schaefer-Ridder M, Wang Y, Hofschneider PH. Gene transfer into mouse lyoma cells by electroporation in high electric fields. Embo J. 1982;1:841–5. doi: 10.1002/j.1460-2075.1982.tb01257.x. [DOI] [PMC free article] [PubMed] [Google Scholar]
- Ogg GS, Jin X, Bonhoeffer S, Dunbar PR, Nowak MA, Monard S, Segal JP, Cao Y, Rowland-Jones SL, Cerundolo V, Hurley A, Markowitz M, Ho DD, Nixon DF, McMichael AJ. Quantitation of HIV-1-specific cytotoxic T lymphocytes and plasma load of viral RNA. Science. 1998;279:2103–6. doi: 10.1126/science.279.5359.2103. [DOI] [PubMed] [Google Scholar]
- Romano G. Current development of nonviral-mediated gene transfer. Drug News Perspect. 2007;20:227–31. doi: 10.1358/dnp.2007.20.4.1103528. [DOI] [PubMed] [Google Scholar]
- Schaffer DV, Koerber JT, Lim KI. Molecular engineering of viral gene delivery vehicles. Annu Rev Biomed Eng. 2008;10:169–94. doi: 10.1146/annurev.bioeng.10.061807.160514. [DOI] [PMC free article] [PubMed] [Google Scholar]
- Sukharev SI, Klenchin VA, Serov SM, Chernomordik LV, Chizmadzhev Yu A. Electroporation and electrophoretic DNA transfer into cells. The effect of DNA interaction with electropores. Biophys J. 1992;63:1320–7. doi: 10.1016/S0006-3495(92)81709-5. [DOI] [PMC free article] [PubMed] [Google Scholar]
- Titomirov AV, Sukharev S, Kistanova E. In vivo electroporation and stable transformation of skin cells of newborn mice by plasmid DNA. Biochim Biophys Acta. 1991;1088:131–4. doi: 10.1016/0167-4781(91)90162-f. [DOI] [PubMed] [Google Scholar]
- Walker CM, Erickson AL, Hsueh FC, Levy JA. Inhibition of human immunodeficiency virus replication in acutely infected CD4+ cells by CD8+ cells involves a noncytotoxic mechanism. J Virol. 1991;65:5921–7. doi: 10.1128/jvi.65.11.5921-5927.1991. [DOI] [PMC free article] [PubMed] [Google Scholar]
- Walker CM, Moody DJ, Stites DP, Levy JA. CD8+ lymphocytes can control HIV infection in vitro by suppressing virus replication. Science. 1986;234:1563–6. doi: 10.1126/science.2431484. [DOI] [PubMed] [Google Scholar]
- Zhang X, Godbey WT. Viral vectors for gene delivery in tissue engineering. Adv Drug Deliv Rev. 2006;58:515–34. doi: 10.1016/j.addr.2006.03.006. [DOI] [PubMed] [Google Scholar]


