Abstract
Acute lung injury evokes a pulmonary inflammatory response and changes in the breathing pattern. The inflammatory response has a centrally mediated component which depends on the vagi. We hypothesize that the central inflammatory response, complimentary to the pulmonary inflammatory response, is expressed in the nuclei tractus solitarii (nTS) and that the expression of cytokines in the nTS is associated with breathing pattern changes. Adult, male Sprague-Dawley rats (n=12) received intratracheal instillation of either bleomycin (3U in 120 µl of saline) or saline (120 µl). Respiratory pattern changed by 24h. At 48 h, bronchoalveolar lavage fluid and lung tissue had increased IL-1β and TNF-α levels, but not IL-6. No changes in these cytokines were noted in serum. Immunocytochemical analysis of the brainstem indicated increased expression of IL-1β in the nTS commissural subnucleus that was localized to neurons. We conclude that breathing pattern changes in acute lung injury were associated with increased levels of IL-1β in brainstem, areas which integrate cardio-respiratory sensory input.
Keywords: Inflammation, Brainstem, Acute Lung Injury, Breathing Pattern, Respiratory Variability
1. Introduction
Acute lung injury (ALI) is a common clinical problem characterized by diffuse, heterogeneous lung damage that is caused by both direct injury to the lung (e.g., pneumonia) and indirect insults (e.g., sepsis) (Ashbaugh et al. 1967; Bernard et al. 1994; Rubenfeld et al. 2005). Whether ALI results from a stimulus of local inflammation or as part of a systemic inflammatory process, insult to the lung disrupts the alveolar-capillary interface and initiates an inflammatory cascade (Ware et al. 2000; Suratt et al. 2006). This inflammatory response includes release of proinflammatory mediators, upregulation of adhesion molecules, recruitment of neutrophils and activation of lung macrophages with resultant production of early response cytokines including interleukin (IL)-1β, IL-6, and tumor necrosis factor (TNF)-α (Strieter et al. 1999; Ware et al. 2000; Shimabukuro et al. 2003). If the lung is unable to recover from the initial insult or contain the inflammatory response, injury worsens progressing to the acute respiratory distress syndrome (ARDS) (Ware et al. 2000; Piantadosi et al. 2004).
Breathing patterns are altered by the onset and progression of respiratory diseases (Kuratomi et al. 1985; Brack et al. 2002; Miyata et al. 2002; Yeragani et al. 2002; Bien et al. 2004; Giraldo et al. 2004; Miyata et al. 2004; Casaseca-de-la-Higuera et al. 2006; Wysocki et al. 2006; Ibrahim et al. 2008; Veiga et al. 2010). The mechanisms responsible for changes in the breathing pattern in ALI and ARDS are attributed to the fundamental pathophysiology of diffuse pulmonary infiltrates, altered ventilation-perfusion matching, progressive hypoxemia, reduced lung compliance and increased work of breathing (Gattinoni et al. 1994; Pelosi et al. 1995). However, the relative contribution of each of these mechanisms has not been defined, and the impact of inflammation to altered respiratory pattern is unknown. Furthermore, while there is a growing appreciation of the importance of variability of biological signals (i.e., variability in the pattern) (Kleiger et al. 1987; Lishner et al. 1987; Casolo et al. 1989; Odemuyiwa et al. 1991; Huikuri et al. 2000; Mietus et al. 2000; Goldberger 2001; Griffin et al. 2001; Tapanainen et al. 2002; Griffin et al. 2004; Stein et al. 2005), changes in breathing pattern variability in ALI and ARDS have not been characterized.
Most probably, multiple mechanisms contribute to changes in breathing pattern variability in ALI including alterations in lung mechanics and sensory feedback. For example, pathophysiological changes in the plant (lungs and muscles) will influence the temporal pattern of breathing, the variability from breath-to-breath. Reductions in vital capacity (VC) in the setting of gas exchange requirements that necessitate maintenance of a relatively normal tidal volume (VT) may narrow the VC/VT ratio and result in a more uniform rate and depth of pattern (Brack et al. 2002). Hypoxia (Jubran et al. 2000; Van den Aardweg et al. 2002) and hypercapnia (Jubran et al. 1997; Fiamma et al. 2007), which result from lung injury, also alter variability of ventilatory patterns. Further, carotid body chemoreceptors are sensitized during early stages of lung injury (Jacono et al. 2006) and increased gain of the ‘sensor’ could act to increase variability of the controlled system (Cherniack et al. 1966; Longobardo et al. 1966). In chronic lung injury where the lung is fibrotic, vagal afferents drive the characteristic tachypnea (Schelegle et al. 2001). Thus, changes in magnitude and type of sensory input not only influence the breathing pattern but also the variance of the breathing pattern during illness, specifically acting to modulate breathing pattern variability in ALI (Bruce 1996; Benchetrit 2000; Webber et al. 2006).
However, afferent feedback and mechanical properties of the lung are not the only determinants of breathing patterns (Bruce 1996; Benchetrit 2000; Webber et al. 2006). Neural control of breathing can also influence pattern, and changes in breathing pattern variability may be adaptive. For example, a breathing pattern with low variability minimizes dyspnea in patients with restrictive lung disease (Brack et al. 2002); respiratory complexity decreases during slow-wave sleep (Sako et al. 2001) whereas it increases in patients with panic disorder (Yeragani et al. 2002), and complex waxing and waning respiratory patterns have been reported in an animal model of stroke with normal lung physiology (Koo et al. 2010). Thus, changes related to intrinsic properties of the nervous system such as state are mediated by the brainstem and contribute to changes in deterministic structure, variability and pattern of respiration.
Finally, local lung inflammation may influence breathing pattern variability. Endotoxin (Lai et al. 2005) and reactive oxygen species (Ruan et al. 2005) activate lung C fibers, which alter breathing frequency. Further, studies in humans identified a decrease in variability of respiratory timing with endotoxemia supporting an impact of systemic inflammation on breath-to-breath dynamics (Preas et al. 2001). However, the impact of a neural inflammatory response on breathing pattern variability in ALI is unknown. We hypothesize that in ALI, the mechanisms responsible for changes in variability of the respiratory pattern after lung injury relate to the central expression of cytokines and their influence on state. To begin to assess the role of local brainstem inflammation to breathing pattern responses in lung injury, we determined the association of lung and brainstem cytokine levels with changes in the linear and nonlinear properties of breathing pattern variability in the first 48 h of bleomycin-induced ALI.
2. Materials and methods
2.1 Experimental procedures
Male Sprague-Dawley rats (100–250 g, n=12, Harlan) were purchased with their jugular vein catheterized and with the catheter exteriorized between their shoulder blades. Briefly, plethysmographic recordings were made at baseline (approximately 24 h after shipment) and then 6, 12, 24 and 48 h after intratracheal instillation of either saline (control group) or bleomycin. Venous blood samples (0.15 ml) were drawn at each of these time points. At 48 h the rats were exsanguinated and the following were collected: a) bronchoalveolar lavage fluid (BALF), b) lung tissue and c) brainstem. The Institutional Animal Care and Use Committee of Case Western Reserve University approved the experimental protocols.
2.2 Chemically-induced acute lung injury
We anesthetized the rats with a mixture of acepromazine, ketamine and xylazine using a weight-based dosing protocol. Once the rats were at a general surgical plane (no corneal reflex and no gag reflex) of anesthesia, the trachea was exposed by a 1-cm anterior neck incision. We inserted a 26-gauge needle between the cartilaginous rings of the trachea and administered bleomycin [3.0 units in 120 µl phosphate-buffered saline (PBS)] or 120 µl of PBS (control) (Jacono et al. 2006). The surgical site was closed with surgical tissue adhesive and the animals were observed during recovery.
2.3 Measurements of breathing patterns
Respiratory waveforms were recorded from spontaneously breathing rats in a temperature-equilibrated whole-body plethysmograph following an acclimatization period. Pressure changes in the chamber were passed through a pre-amplifier (Max II, Buxco Electronics), acquired (Sampling rate = 200 Hz, Power1401, CED, Cambridge, UK) and stored with respiratory acquisition software (Spike 2, CED) for off-line analysis of breathing-pattern dynamics.
2.4 Assessment of lung injury
At the 48 h time point, the rats were sacrificed by an over dose of anesthetic and their chest cavity opened (Jacono et al. 2006). A tracheal cannula was secured and the lungs lavaged with saline (2× with 2.5 ml each time). Protein concentration of BALF supernatant was measured using a conventional dye-binding assay (Bio-Rad Laboratories, Hercules, CA) and analyzed spectrophotometrically. The BALF cell pellet was resuspended in PBS and viable cells were identified by Trypan blue exclusion and counted by a reader blinded to the injury status of the animal. In other animals, lungs were inflated and fixed with 10% formalin at 25 cm H2O for 30 min. The lungs were then removed en bloc, transferred to a cassette, and embedded in paraffin. Subsequently, 5-µm sections were cut and stained with hematoxylin and eosin for histological examination.
2.5 Lung tissue and serum cytokine levels
Unfixed lung tissue was homogenized in complete lysis buffer and centrifuged. Cytokine concentrations (IL-1β, IL-6 and TNF-α) were measured in supernatants of homogenized lungs by quantitative sandwich enzyme immunoassay technique (ELISA) (R&D Systems). Standards and samples were pipetted into microplate wells pre-coated with a monoclonal antibody specific for the relevant cytokine. After washing, an enzyme-linked polyclonal antibody specific to relevant cytokine was added. After washing, substrate solution was added and the amount of bound cytokine quantified spectrophotometrically.
2.6 Brainstem cytokine assessment
2.6a. Brainstem tissue removal
Animals were perfused transcardially with saline followed by 4% paraformaldehdye. The brainstems were removed, postfixed in 4% paraformaldehyde for 4 hours at 4°C, and cryoprotected in 15% sucrose overnight and then 30% sucrose until the tissue sank. Brainstems were then embedded in tissue freezing medium (Triangle Biomedical Sciences) and frozen sections (20 µm) were cut using a cryostat (Leica). All sections were collected on a series of 4 duplicate slides and stored at −20°C until use.
2.6b. Immunohistochemical staining for densitometry
Every fourth section was stained immunohistochemically for IL-1β, IL-6, or TNF-α (Abcam), with the fourth section serving as a negative control (no primary antibody Immunostaining procedures were the same for all antibodies and were as follows: 1) 0.03%H2O2 in sodium phosphate buffer (PBS), 30 min; 2) 20% bovine serum albumin (BSA), 3% Triton x-100 in PBS, 60 min; 3) 1:100 dilution of primary antibody, 0.01% triton x-100, 5% goat serum in PBS, overnight; 4) PBS 3×10min; 5) 1:200 dilution of biotin conjugated secondary antibody (goat anti- rabbit, Jackson Labs), 0.01% triton X-100, 5% goat serum, 2 h; 6) PBS 3×10 min; 7) Avidin Biotin complex (ABC kit standard elite, Vector) 30 min; 8) PBS 3 × 10 min; 9) 0.03% 3,3’-Diaminobenzidine, 0.03% NiCl2, 0.008% H2O2, 6–10 min; 10) PBS 3 × 5 min. Sections were then dehydrated through alcohols and xylene and coverslipped using permount.
Densitometry was performed by photographing (Retiga EXI camera) the area of interest of each section at the same light intensity and the same exposure time with QImaging software. Images were loaded into ImageJ and the white balance corrected to the same level for all images. A circle 100 pixels in diameter was then placed in the area of interest and the average pixel intensity within this circle was measured. These measurements were recorded for the nuclei tractus solitarii (nTS) and area postrema bilaterally and then averaged. Measurements were compared for anatomically equivalent sections between saline and the insult group using ANOVA, with a p-value of less the 0.05 considered significant.
2.6c. Fluorescence staining
Free-floating sections were used and every fourth section was stained immunohistochemically for IL-1β (Abcam) and NeuN conjugated to FITC (Millipore), with the fourth section serving as a negative control (no primary antibody). Immunostaining procedures were the same for all antibodies and were as follows: 1) 2 washes sodium phosphate buffer (PBS), 5 min each wash; 2) Block in (PBST – 0.3% Triton), 5 % horse serum, and 1% BSA (RT) on a shaker, 1 h; 3) 1:100 dilution of primary antibody in blocking buffer on a shaker, overnight in 4°C; 4) PBS wash, 3×10 min; 5) 1:500 dilution of secondary antibody (GaRabbit Alexa633; Invitrogen), 1 h; 6) PBS wash, 3×10 min; 7) Sections were put on slides and coverslipped with Vectashield mounting medium (Vector Labs).
2.7 Data analysis
We have developed a standard approach for breathing pattern waveform analysis that distinguishes and examines both distributional, linear and nonlinear properties of the pattern (Jacono et al. 2010). The analytical steps are described below briefly.
2.7a. Respiratory pattern analysis
For each epoch, discrete breaths were identified by the custom software and verified visually and corrected manually. Respiratory rate and coefficient of variation of respiratory cycle length (CV of Ttot) were calculated for each of three epochs (60-s of stable breathing) and reported data represents the average of these three epochs for each time point. In addition, Spike 2 Software was used to generate cycle-triggered averages to capture average frequency and morphology over the entire epoch (at least 50 breaths).
2.7b. Autocorrelation
Autocorrelation functions were constructed to characterize the linear relationship between sampled points in the respiratory pattern. For each breathing epoch, autocorrelation coefficients were calculated using available MATLAB routines across multiple time intervals or lags (τ) from neighboring points to points separated by one respiratory cycle length (Ttot). To facilitate comparisons across animals with different respiratory rates, the value of the autocorrelation coefficient at one cycle length was reported as a measure of the strength of linear correlations.
2.7c. Sample entropy
To calculate sample entropy, templates consisting of m points and m + 1 points separated by a time interval (τ) were created for every point. Computationally, sample entropy is the negative natural logarithm of the conditional probability that epochs with a certain number of matches for m number of points will also have matches for m + 1 points within a tolerance r (Richman et al. 2000). Our analysis was computed using m = 2 and r = 0.2*SD. Sample entropy was computed over multiple τ’s from unity up to one cycle length. These values were averaged across time lags excluding those for which high linear correlations were present in the data set as defined by the first minimum of the mutual information function.
2.7d. Nonlinear determinants of breathing pattern variability
Surrogate data sets were designed to preserve the linear and to eliminate the nonlinear correlations in the data set. We computed the surrogate data sets (n=19) using the iterated amplitude adjusted Fourier transform (iAAFT) by moving the data into the frequency domain and back into the time domain while ensuring that both the frequency distribution (power spectrum/autocorrelation function) and the amplitude distribution were maintained (Theiler 1986; Schreiber and Schmitz 2000; Kaffashi et al. 2008). To determine complexity attributable to nonlinear sources, differences were tabulated between sample entropy for original and surrogate datasets. A nonlinear complexity index (NLci) was computed as the average of the statistically significant differences in sample entropy between the surrogate and original data across multiple τ from neighboring points to points separated by Ttot. Higher values of NLci correlate with an increased contribution of nonlinear and/or non-Gaussian sources of variability (Koo et al. 2010).
2.7d Statistical analysis
Results are presented as mean ± standard deviation. The data was inspected graphically and was normally distributed. For measurements made across multiple time points a two-way repeated measures analysis of variance (ANOVA) was performed with statistical significance determined by a p<0.05. If a significant interaction between intervention and time was found, then the Student-Newman-Keuls method was used as a pairwise multiple comparison assay (adjusted p-values reported, p<0.05 significant). For comparisons made only at the 48 h time point, statistical evaluations were made using a two-sample t-test with p<0.05 considered significant. Analyses were performed using SigmaPlot 11.2 (Systat Software).
3. Results
3.1 Acute lung injury was present 48 h after intratracheal instillation of bleomycin and was associated with changes in the breathing pattern
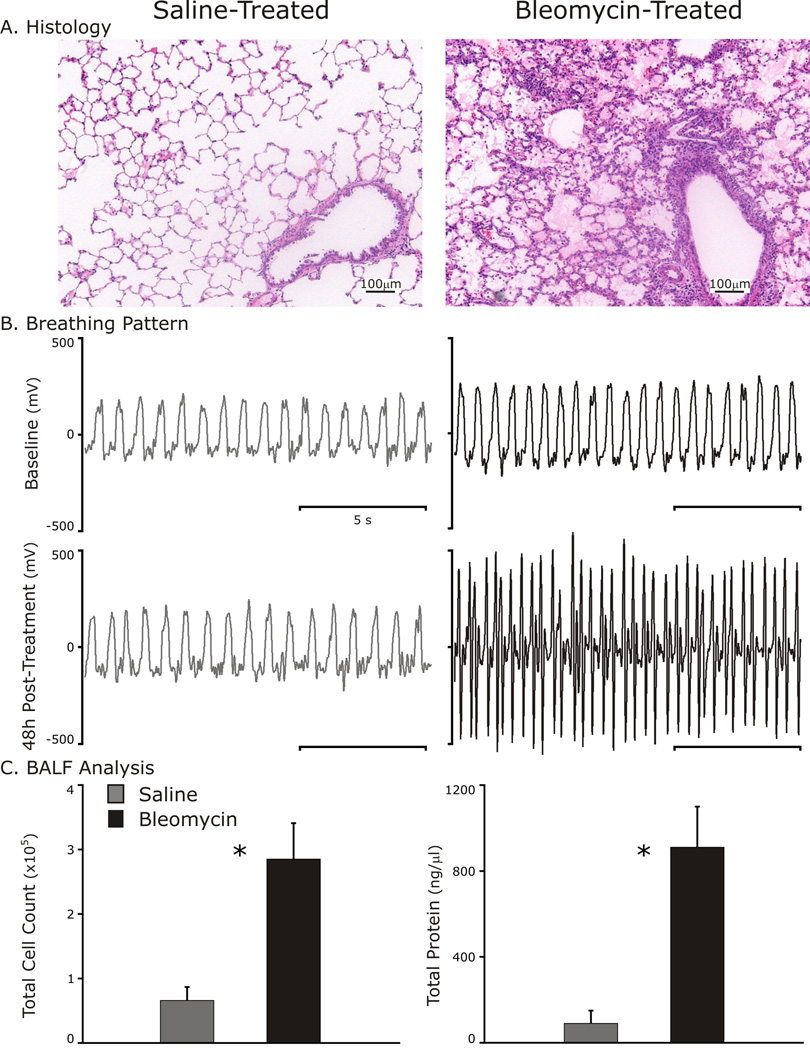
Analysis of pulmonary histology, breathing pattern and BALF from rats administered bleomycin indicated that ALI had developed by 48 h (Fig. 1). Histological images revealed a cellular infiltrate with hyaline membranes most prominent near airway structures in lung-injured but not control rats (Fig. 1A). As compared to baseline breathing patterns, changes in respiratory rate and shape of the pattern were evident at 48 h following bleomycin instillation (Fig. 1B). Further, lung-injured rats developed an inflammatory response as quantified by an increase in BALF cell count (285,000 ± 55,800 cells/ml bleomycin vs. 66,000 ± 20,740 cells/ml saline, p<0.001) and loss of the integrity of the alveolar-capillary barrier as measured by BALF protein concentration (0.91 ± 0.19 µg/µl bleomycin vs. 0.09 ± 0.06 µg/µl saline, p<0.001). Due to the presence of these markers, we concluded that the bleomycin-treated rats had developed lung injury.
Fig. 1.
Evidence of early lung injury 48 h after intratracheal instillation of 3 units of bleomycin.
A: Representative histology sections (hematoxylin and eosin staining) of a control and lung-injured rat lungs.
B: Breathing patterns at baseline (Top panels) and 48 h after Bleomycin (black traces) or saline (gray traces, bottom panels).
C: Bronchoalveolar lavage fluid (BALF) analysis identifies cellular inflammation and elevated protein suggestive of damage to the alveolar-capillary interface. *p<0.001.
3.2 Interval analysis of breathing pattern
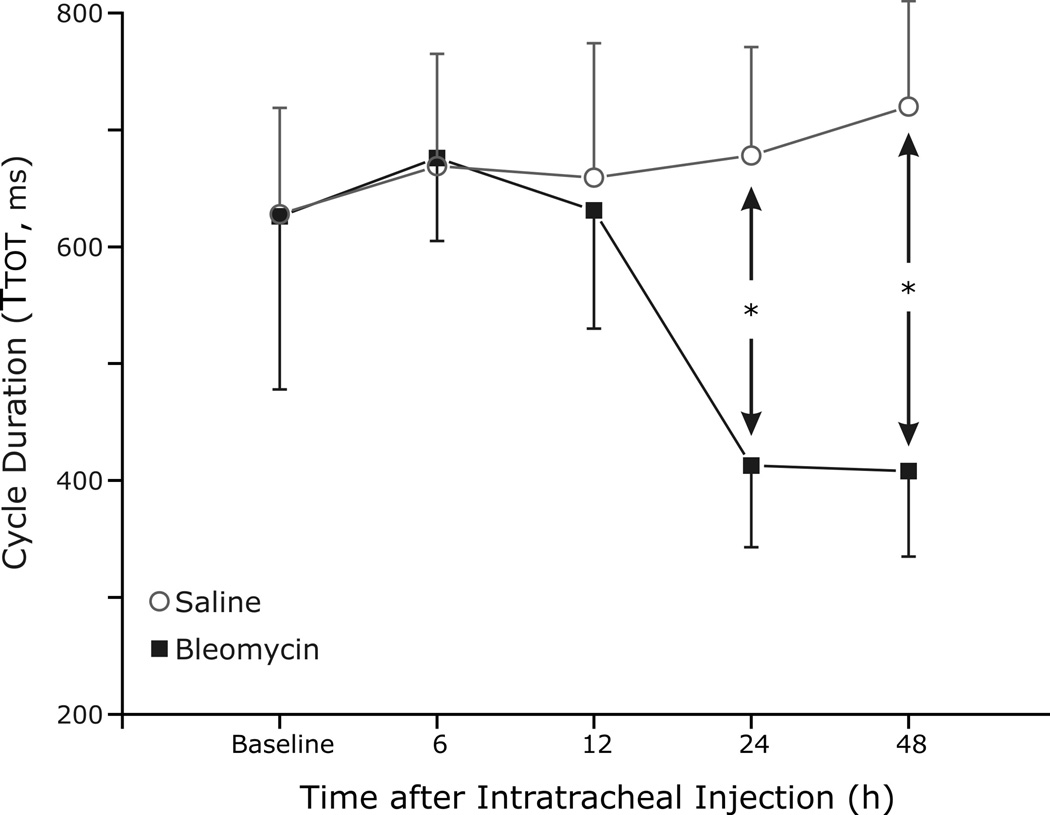
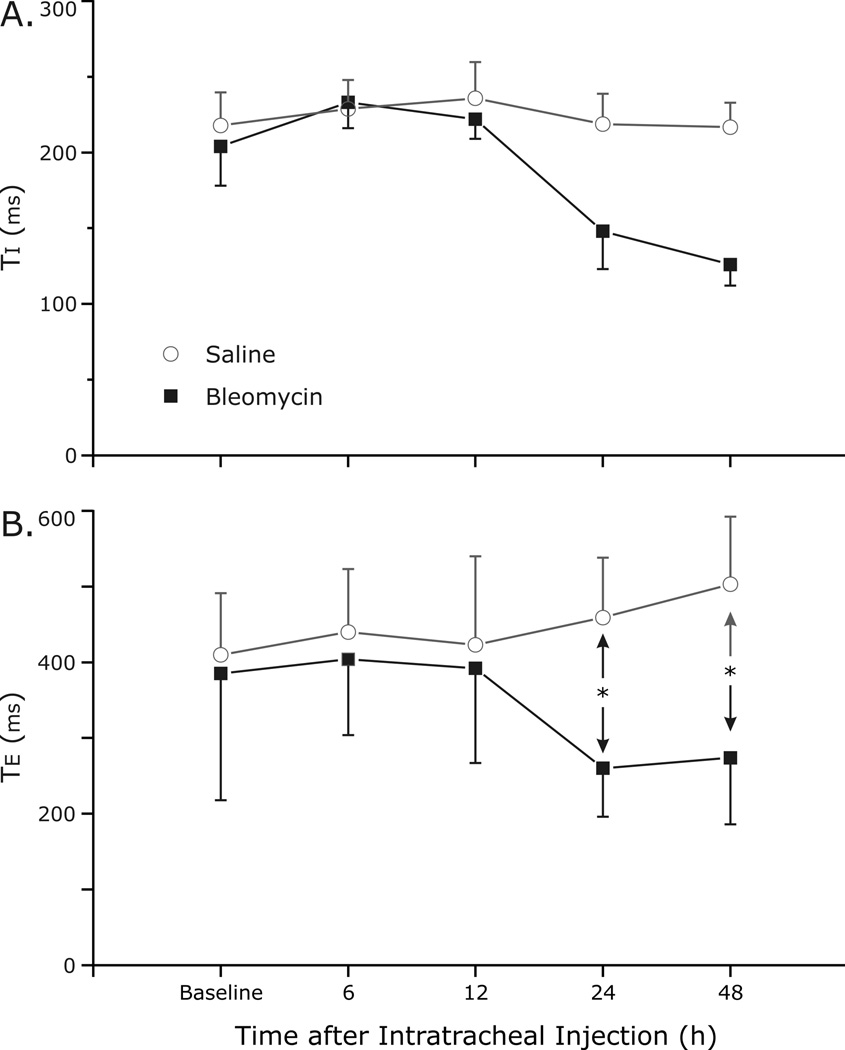
Respiratory cycle duration (Ttot) was analyzed to quantify changes in the breathing pattern (Fig. 2). Significant differences in Ttot between the two groups occurred as early as 24 h after the instillation of bleomycin and induction of ALI (p<0.001). At 48 h after bleomycin instillation, Ttot remained decreased in the lung-injured rats as compared to saline (0.41 ± 0.07 s bleomycin vs. 0.72 ± 0.09 s control, p<0.001). Decreases in both inspiratory time (Ti) and expiratory time (Te) appeared to account for the change in Ttot (Fig. 3A and 3B, respectively), although only changes in Te achieved statistical significance at 24 h (p=0.005) and 48 h (p=0.008).
Fig. 2.
Interval analysis of respiratory cycle duration (Ttot) to quantify changes in breathing pattern. Respiratory rate is increased (significant decrease in Ttot in the lung injury group) as early as 24 h after the instillation of bleomycin and induction of ALI, and this rate change persists at 48 h after bleomycin instillation (p<0.01).
Fig. 3.
Decreases in both inspiratory time (Ti) and expiratory time (Te) accounted for the change in respiratory cycle length (A and B, respectively), although only changes in Te achieved statistical significance at 24 h (p=0.005) and 48 h (p=0.008). * indicates significance.
3.3 Variability analysis of breathing pattern
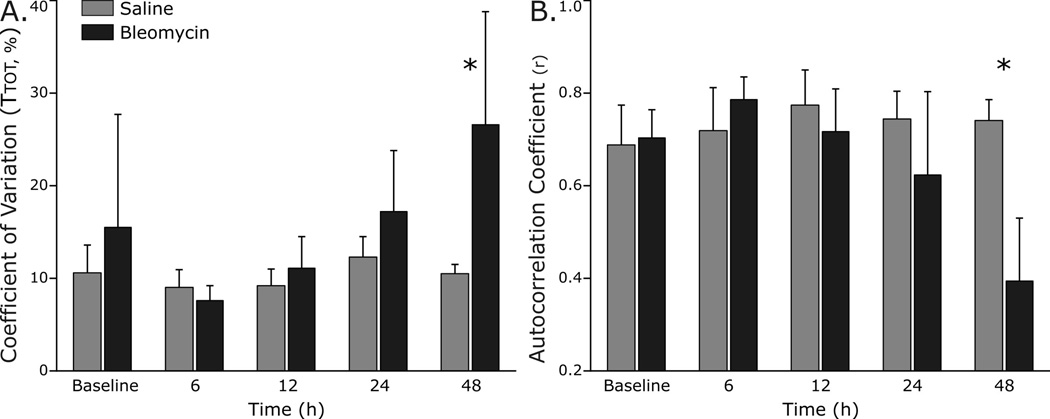
To begin to determine if breathing pattern variability had changed with lung injury, we measured distributional variance of respiratory cycle length using coefficient of variation (CV), as well as autocorrelation and sample entropy. In addition, the normalized difference between the original and surrogate data sets was quantified as the nonlinear complexity index (NLci). In the lung-injured rats, the CV of Ttot increased at 48 h (p<0.001), but not at earlier time points (Fig. 4A). The autocorrelation coefficient was measured at a time lag corresponding to one cycle length (Ttot) and was used to assess the linear correlations in respiratory pattern. The autocorrelation coefficient decreased significantly at 48 h (0.39 ± 0.14 bleomycin vs. 0.74 ± 0.04 saline, p<0.001) but not before (Fig. 4B).
Fig. 4.
Linear determinants of breathing pattern variability change with development of ALI.
A. The coefficient of variation of respiratory cycle length (CV of Ttot) in lung-injured rats increased at 48 h (p<0.001), but not at earlier time points.
B. The autocorrelation coefficient decreased significantly at 48 h (p<0.001) but not before, indicating a diminution in linear correlations in the respiratory pattern with ALI.
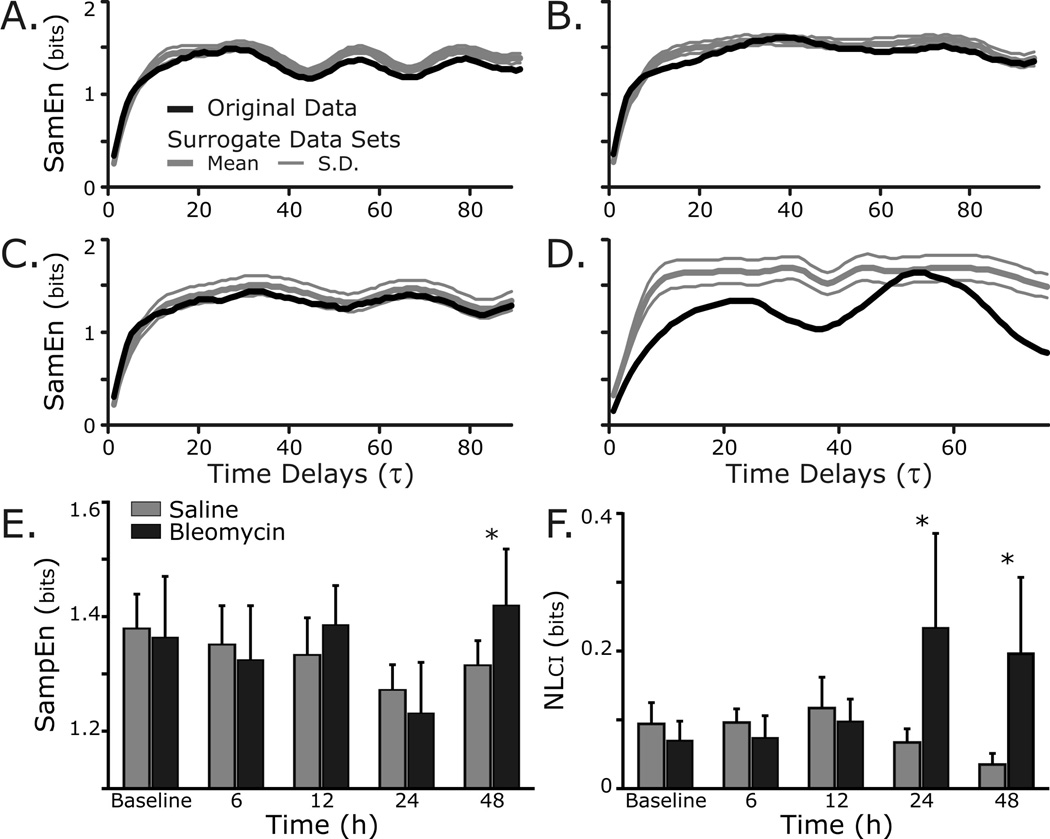
Sample Entropy (SampEn) is a measure of self-similarity which captures both linear and nonlinear properties of the respiratory pattern (Richman et al. 2000; Kaffashi et al. 2008). Fig. 5 shows that SampEn was modestly increased in the lung-injury group as compared to control rats at 48 h (p=0.01). However, an index of the nonlinear determinants of breathing pattern variability (NLci) was increased at 24 h (0.24 ± 0.14 bits bleomycin vs. 0.07 ± 0.02 bits saline, p=0.01) and at 48 h (0.20 ± 0.11 bits bleomycin vs. 0.04 ± 0.02 bits control, p<0.01) after bleomycin instillation.
Fig. 5.
Nonlinear variability of the respiratory waveform changes as ALI progresses.
Representative sample entropy (SampEn) analysis applied to original (black) and surrogate (grey) data sets from: A, Control rat at baseline; B, Control rat at 48 h; C, Bleomycin rat at baseline; and D, Bleomycin rat at 48 h. Note the separation between the SampEn of the original and surrogate data sets 48 h after induction of lung injury, indicating an increased contribution of nonlinear and/or non-Gaussian sources of variability.
E. Group data shows that SampEn was modestly increased in the lung-injury group as compared to control rats at 48 h (p=0.01).
F. Group data show that an index of the nonlinear determinants of breathing pattern variability (NLci) was increased at 24 h (p=0.01) and at 48 h (p<0.01) after bleomycin instillation.
3.4 Measurements of local lung and systemic inflammation
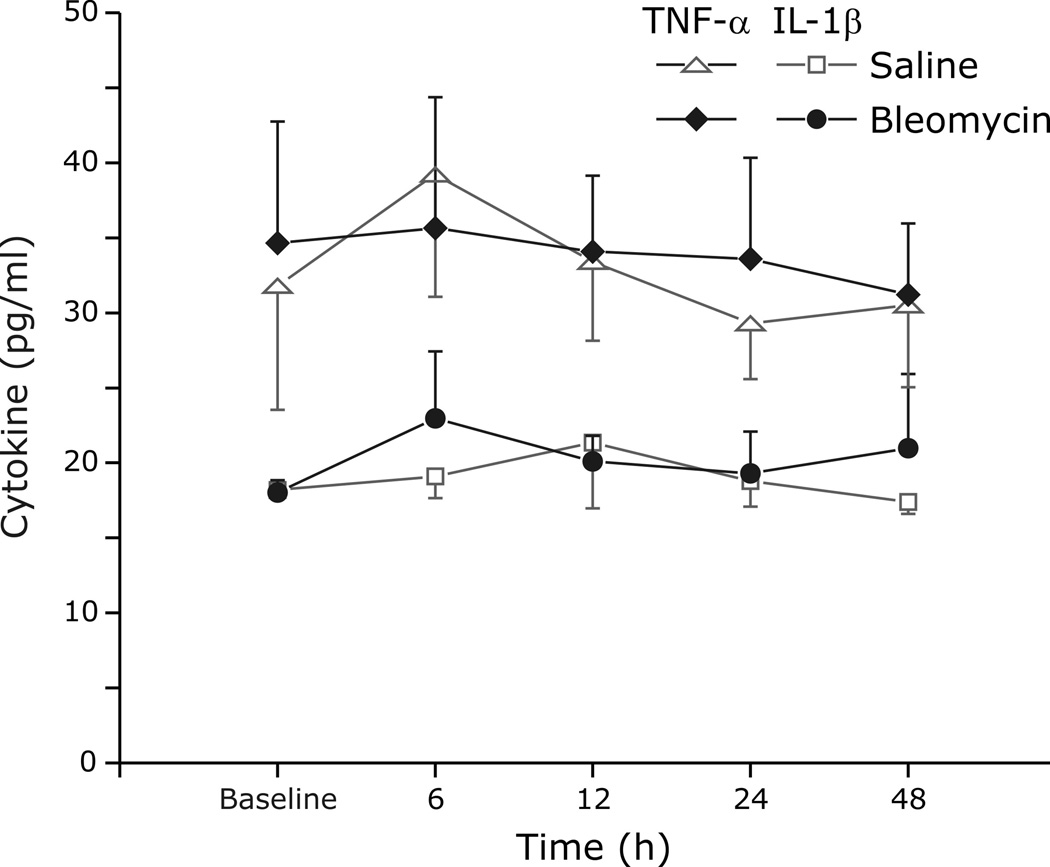
We compared IL-1β (Fig. 6A.) and TNF-α (Fig 6B.) in BALF, lung homogenate, and serum between bleomycin and saline treated animals. At the 48 h time point, IL-1β and TNF-α were increased in BALF (62.5 ± 9.8 pg/ml bleomycin vs. 45.3 ± 11.7 pg/ml saline, p=0.01; 11.8 ± 2.6 pg/ml bleomycin vs. 8.4 ± 0.3 pg/ml saline, p=0.02, respectively) and in lung homogenate (74.6 ± 33.1 pg/ml bleomycin vs. 52.7 ± 24.9 pg/ml control, p=0.06; 32.2 ± 4.3pg/ml bleomycin vs. 25.3 ± 1.3pg/ml control, p<0.01, respectively) from rats with ALI. Despite histological evidence of lung injury and increases in inflammatory cytokines in the lung, serum levels of IL-1β (p=0.8) and TNF-α (p=0.3) were similar at all time points between the lung injury and control groups (Figs. 6 and 7). In contrast to IL-1β and TNF-α, IL-6 was not statistically different in BALF, lung tissue and serum between the groups at all time points (data not shown).
Fig. 6.
Cytokine analysis in bronchoalveolar lavage fluid (BALF), lung tissue and serum.
A. IL-1β was increased in BALF (p=0.01) and in lung tissue homogenate (p=0.06), but not is serum (p=0.8), 48 h after bleomycin instillation.
B. TNF-α was increased in BALF (p=0.02) and in lung tissue homogenate (p<0.01), but not in serum from rats with ALI (48 h).
Fig. 7.
Time course of cytokine (TNF-α (diamond or triangle) and IL-1β (circle or square) in serum before and after exposure to either saline (open symbols) or Bleomycin (closed symbols).
3.5 Cytokine expression in area postrema and nucleus tractus solitarii
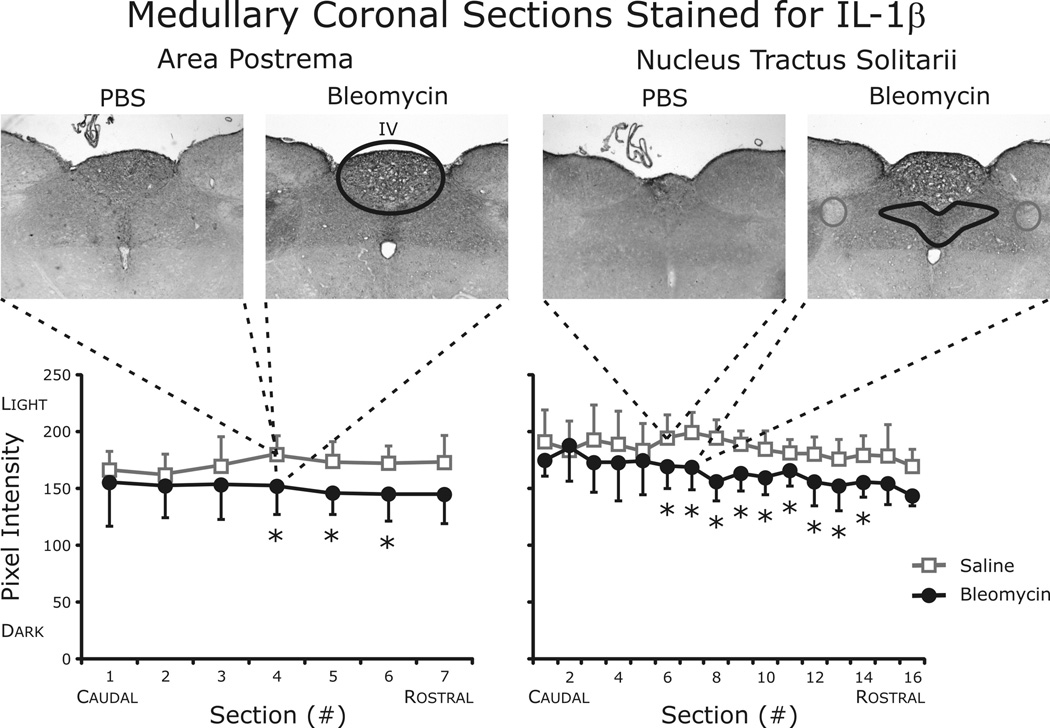
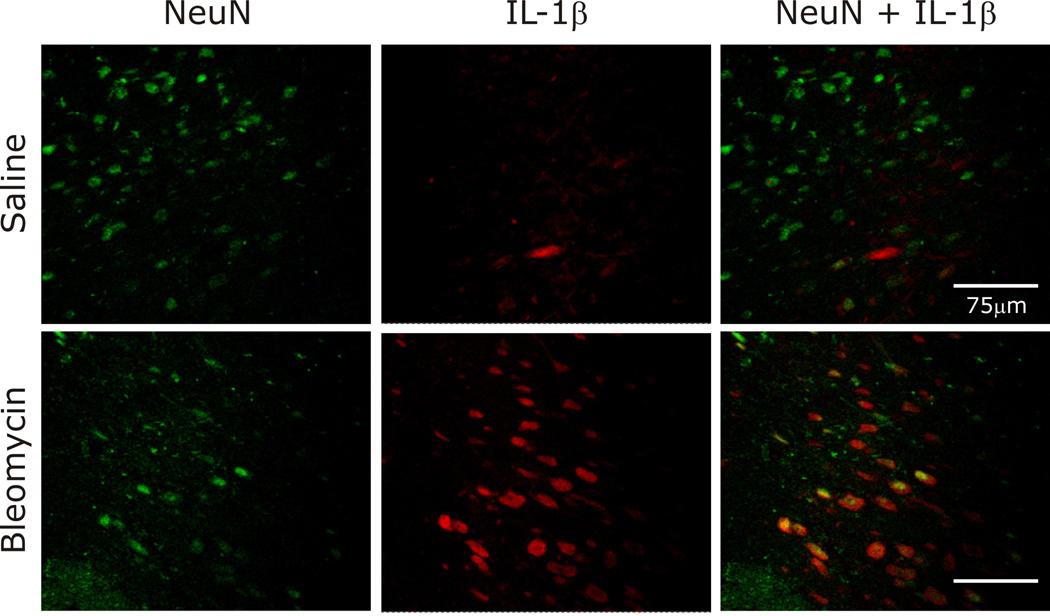
Histological examination of brainstem tissue revealed significant increases in IL-1β in both the area postrema and the nTS (Fig. 8). In contrast, TNF-α and IL-6 staining was similar between the groups in both brainstem areas examined (data not shown). To identify the cellular location of IL-1β expression, fluorescent staining was performed. As pictured in Fig. 9, IL-1β was co-localized with neurons identified using antibodies against the neuronal specific nuclear protein NeuN.
Fig. 8.
Quantification of IL-1β staining in area postrema and nuclei tractus solitarii (nTS). Histological examination identified significant increases in IL-1β in both the area postrema and the nTS. TNF-α and IL-6 staining was similar between the groups in both brainstem areas examined (data not shown).
Fig. 9.
IL-1β was co-localized with neurons in the nTS, as identified by fluorescent staining.
4. Discussion
4.1 Main findings of the study
The objective of the present study was to investigate the relationship of lung and brainstem inflammation to breathing pattern changes in early ALI. Key findings include changes in the respiratory rate and pattern variability that occur 24–48 h after the induction of lung injury in a rat model using intratracheal instillation of bleomycin. Alterations included changes in the linear and nonlinear components of breathing pattern variability. As expected, key proinflammatory cytokines were increased in BALF and lung tissue but not serum. Interestingly, breathing pattern changes following ALI were associated with increased levels of IL-1β in two brainstem areas important in the integration of cardio-respiratory sensory input. While this observation does not mean a causal relationship exists, it is consistent with one as increases in brainstem IL-1β occurred without a significant increase in serum levels of this inflammatory mediator.
4.2 Significance of breathing pattern variability
Ventilation exhibits temporal variations even in health (Bruce 1996) and this breathing pattern variability is influenced by the development of disease. For example, loss of variability in the respiratory pattern occurs in restrictive lung disease (Kuratomi et al. 1985; Brack et al. 2002), obstructive lung disease (Veiga et al. 2010), and respiratory failure (Bien et al. 2004; Giraldo et al. 2004; Casaseca-de-la-Higuera et al. 2006; Wysocki et al. 2006), as well as in septic and acutely ill patients (Askanazi et al. 1979). In contrast, increases in breathing pattern variability have been observed in patients with panic disorder (Yeragani et al. 2002) and sleep disordered breathing (Miyata et al. 2002; Miyata et al. 2004), particularly at the wake-sleep transition (Ibrahim et al. 2008). Taken together, these data emphasize that while rate, depth and pattern of respiration often change with the development and progression of disease, both increases and decreases in pattern variability may occur. Our perspective is that variability of pattern is not inherently ‘good’ or ‘bad,’ but rather a state-dependent range of healthy breathing pattern variability exists.
Respiratory system dynamics are conventionally examined on a breath-by-breath basis. This standard approach provides important trend-based information as well as insight into pattern of breaths. Multiple approaches for quantifying variability including techniques based on linear assumptions, mathematical chaos theory and information theory have been applied to the timing of breaths (e.g., inspiratory, expiratory and total respiratory cycle time). However, each breath can have a different shape, and variability on this time scale will not be completely captured by an analysis of phase durations. While part of the observed variation is due to random fluctuations (stochastic variability), the respiratory pattern also exhibits deterministic variability with temporal structure that exists across many breaths (Jacono et al. 2010).
In addition to an evaluation of phase durations, a novel aspect of our analytical approach is that we applied signal analysis techniques directly to the whole-body plethysmography signal sampled at 200 Hz. Variations at this time scale are typically ignored or dismissed as noise, but we hypothesized that deterministic structure in breathing pattern shape reflects alterations in the processing of afferent inputs by the cardiorespiratory network. That is, changes in the respiratory profile itself could serve as a window into the state of the system. A growing literature supports the value of similar analytical approaches to the respiratory pattern as a biomarker of pathophysiologic status (Kaimakamis et al. 2009; Koo et al. 2010; Veiga et al. 2010; Mangin et al. 2011).
In the present study, we characterized breathing patterns using complex systems analysis techniques to quantify distributional, linear and nonlinear properties of the pattern breaths (Jacono et al. 2010). Distributional variance captures how variability is distributed independent of temporal dynamics, and is reflected in measures such as mean and coefficient of variation. Linear properties reflect straight line relationships, which we quantified with an autocorrelation coefficient. Nonlinear properties include relationships in the pattern which are not directly proportional. Sample Entropy captures both linear and nonlinear variability, and surrogate data testing was used to quantify nonlinear complexity directly.
4.3 Altered breathing pattern in acute lung injury
Breathing patterns are altered by the onset, progression and resolution of respiratory diseases (Kuratomi et al. 1985; Brack et al. 2002; Miyata et al. 2002; Yeragani et al. 2002; Bien et al. 2004; Giraldo et al. 2004; Miyata et al. 2004; Casaseca-de-la-Higuera et al. 2006; Wysocki et al. 2006; Ibrahim et al. 2008; Veiga et al. 2010). However the mechanisms responsible for changes in variability of the breathing pattern after ALI are poorly understood. Our present findings suggest that both linear and nonlinear determinants of breathing pattern variability are altered in the setting of ALI. In fact, the earliest changes in breathing pattern were related to rate and nonlinear complexity. Furthermore, these ventilatory changes occurred in temporal correlation with increased levels of pro-inflammatory cytokines. While this observation does not mean there is a causal relationship, it is consistent with neuro-immune-interactions regulating breath patterning acting as potential mechanism for changes in breathing pattern and its variability.
Prior work supports this idea, as inflammation is known to alter breathing patterns as evidenced by activation of vagal C fibers by endotoxin (Lai et al. 2005) and reactive oxygen species (Ruan et al. 2005). Human studies in which the intravenous endotoxin injection-mediated increase in autocorrelative behavior of respiratory frequency was mediated by the cyclooxygenase pathway (Preas et al. 2001) further support the impact of inflammation on breathing pattern. Moreover, a feed-forward loop may exist as resistive breathing can induce plasma cytokines (Vassilakopoulos et al. 2002).
4.4 Potential mechanisms for immune-brain signaling in acute lung injury
Inflammation originating from peripheral sites has well documented effects on the central nervous system (Watkins et al. 1995). Cytokines are considered to be the critical mediators of immune-to-brain signaling, and several pathways exist by which immune-to-brain information transfer may occur (Goehler et al. 2000; Quan 2008; Cameron 2009; Thayer et al. 2010). The blood-brain barrier may act as a relay station mediating the active transport of cytokines directly into the brain from the systemic circulation (Banks 2005; Quan 2008). Circumventricular organs are midline brain structures near the third and fourth ventricles with modified blood-brain barriers such that molecules such as cytokines can pass into the brain more freely. Finally, the blood-brain barrier may be bypassed by sensory nerves. In particular, ascending fibers traveling in the vagus nerve are a key neural inflammation-sensing pathway. Thus, alternative blood-brain barrier independent pathways exist.
The importance of vagal pathways is based on studies of the blunted effects of peripheral inflammation by vagotomy (Maier et al. 1998; Goehler et al. 2000; Tracey 2002) and of electrolytic lesioning of the nTS (Gordon 2000). Vagal afferents terminate in the caudal medulla in the area postrema, the nTS, and the dorsal motor nucleus of the vagus. Peripheral inflammation activates neurons in the nTS with vagal sensory input driving this ascending pathway (Goehler et al. 2000). In addition, direct microinjection of IL-6 in the nTS plays a role in regulating cardiovascular control via modulation of input signals from baroreceptor afferents (Takagishi et al. 2010). Whether the presence of cytokines in the nTS also results in altered respiratory physiology remains to be resolved.
Acute lung injury induces local inflammation (Strieter et al. 1999; Ware et al. 2000). In the bleomycin model, neutrophils increase in bronchoalveolar lavage fluid at 24 h, and pro-inflammatory cytokines including IL-1β, IL-6 and TNF-α peak between 6 and 63 h (Matute-Bello et al. 2008). Depending on the severity of lung injury, inflammatory mediators may be released systemically. In our model, we observed significant increases in lung levels of IL-1β and TNF-α 48 h after bleomycin instillation. Notably, increases in serum levels of these cytokines were not observed at any of the measured time points. Nevertheless, significant increases in IL-1β were quantified in the area postrema and the nTS at 48 h.
As we stated previously, the temporal correlation between quantified increases in IL-1β in the brainstem and significant changes in ventilatory pattern following the onset of ALI does not establish a causal link. However, these findings are suggestive of potential mechanisms that are addressed here and by other authors in this special issue. For example, the area postrema is a circumventricular organ—which raises the possibility that accumulation of cytokines in this region occurs as a result of direct passage from the systemic circulation. But, we would expect increases in serum cytokine levels at this stage of lung injury and were unable to quantify such changes. We consider vagal nerve transport or afferent activity mediating a neural inflammatory response in the dorsal vagal complex to be a likely mechanism. However, activation of microglia by unidentified factors following lung injury may also result in local release and accumulation of inflammatory cytokines. Future studies are planned to evaluate this question more precisely.
4.5 Limitations of the present work
Animal models for human disease often have limitations. For example, the model of intratracheal instillation of bleomycin used in this series of experiments leads to heterogeneous ALI focused in the more central areas of the lung. However, while no model fully reproduces the features of human lung injury, bleomycin-instillation is associated with key features of this condition (Matute-Bello et al. 2008). Further, generalizing findings in rats to humans may be difficult given differences in respiratory structures. Animal models do not replicate human conditions precisely, but nonlinear determinants of variability are a property of central control network (Khoo 2000), and while dependent on afferent feedback, variability is a property that is phylogenetically preserved. Thus, despite its limitations, this ALI model permits investigation of changes in breathing pattern in conjunction with an assessment of inflammatory status. However, replication of these findings in other models of lung injury will be important.
4.6 Conclusions
In an animal model of chemically-induced acute lung injury, breathing pattern changes, including a significant increase in nonlinear deterministic variability were associated with increased levels of IL-1β in two brainstem areas important in the integration of cardio-respiratory input. While this observation does not prove a causal relationship, it is consistent with neuro-immunologic interaction in the brainstem as a potential mechanism for regulation of breathing pattern. Further, the noted increase in IL-1β occurred without a significant increase in the blood levels of this cytokine indicating a potential role of vagal nerve afferent activity in mediating the neural inflammatory response. These data do suggest that a causal connection may exist between inflammation-derived sensory input and changes in breathing pattern variability which will be the focus of future studies. Finally, these data highlight the early changes in breathing pattern that occur following ALI and support the translational potential of using breathing pattern analysis as a diagnostic tool.
Acknowledgements
The authors would like to thank Cara Campanaro and David Nethery for assistance with data collection and analysis, and Abdelmajid Belkandi for assistance with the fluorescent staining protocols.
Financial support: This research was supported by grants from the National Institutes of Health (HL-087377 and HL-07931) and by Award Number I01BX000873 from the Biomedical Laboratory Research & Development Service of the VA Office of Research and Development.
Footnotes
Publisher's Disclaimer: This is a PDF file of an unedited manuscript that has been accepted for publication. As a service to our customers we are providing this early version of the manuscript. The manuscript will undergo copyediting, typesetting, and review of the resulting proof before it is published in its final citable form. Please note that during the production process errors may be discovered which could affect the content, and all legal disclaimers that apply to the journal pertain.
References
- Ashbaugh DG, Bigelow DB, Petty TL, Levine BE. Acute respiratory distress in adults. Lancet. 1967;2:319–323. [Google Scholar]
- Askanazi J, Silverberg PA, Hyman AI, Rosenbaum SH, Foster R, Kinney JM. Patterns of ventilation in postoperative and acutely ill patients. Crit Care Med. 1979;7:41–46. doi: 10.1097/00003246-197902000-00002. [DOI] [PubMed] [Google Scholar]
- Banks WA. Blood-brain barrier transport of cytokines: a mechanism for neuropathology. Curr Pharm Des. 2005;11:973–984. doi: 10.2174/1381612053381684. [DOI] [PubMed] [Google Scholar]
- Benchetrit G. Breathing pattern in humans: diversity and individuality. Respir Physiol. 2000;122:123–129. doi: 10.1016/s0034-5687(00)00154-7. [DOI] [PubMed] [Google Scholar]
- Bernard GR, Artigas A, Brigham KL, Carlet J, Falke K, Hudson L, Lamy M, Legall JR, Morris A, Spragg R. The American-European Consensus Conference on ARDS. Definitions, mechanisms, relevant outcomes, and clinical trial coordination. Am J Respir Crit Care Med. 1994;149:818–824. doi: 10.1164/ajrccm.149.3.7509706. [DOI] [PubMed] [Google Scholar]
- Bien MY, Hseu SS, Yien HW, Kuo BI, Lin YT, Wang JH, Kou YR. Breathing pattern variability: a weaning predictor in postoperative patients recovering from systemic inflammatory response syndrome. Intensive Care Med. 2004;30:241–247. doi: 10.1007/s00134-003-2073-8. [DOI] [PubMed] [Google Scholar]
- Brack T, Jubran A, Tobin MJ. Dyspnea and decreased variability of breathing in patients with restrictive lung disease. Am J Respir Crit Care Med. 2002;165:1260–1264. doi: 10.1164/rccm.2201018. [DOI] [PubMed] [Google Scholar]
- Bruce EN. Temporal variations in the pattern of breathing. J Appl Physiol. 1996;80:1079–1087. doi: 10.1152/jappl.1996.80.4.1079. [DOI] [PubMed] [Google Scholar]
- Cameron OG. Visceral brain-body information transfer. Neuroimage. 2009;47:787–794. doi: 10.1016/j.neuroimage.2009.05.010. [DOI] [PubMed] [Google Scholar]
- Casaseca-de-la-Higuera P, Martin-Fernandez M, Alberola-Lopez C. Weaning from mechanical ventilation: a retrospective analysis leading to a multimodal perspective. IEEE Trans Biomed Eng. 2006;53:1330–1345. doi: 10.1109/TBME.2006.873695. [DOI] [PubMed] [Google Scholar]
- Casolo G, Balli E, Taddei T, Amuhasi J, Gori C. Decreased spontaneous heart rate variability in congestive heart failure. Am J Cardiol. 1989;64:1162–1167. doi: 10.1016/0002-9149(89)90871-0. [DOI] [PubMed] [Google Scholar]
- Cherniack NS, Longobardo GS, Levine OR, Mellins R, Fishman AP. Periodic breathing in dogs. J Appl Physiol. 1966;21:1847–1854. doi: 10.1152/jappl.1966.21.6.1847. [DOI] [PubMed] [Google Scholar]
- Fiamma MN, Straus C, Thibault S, Wysocki M, Baconnier P, Similowski T. Effects of hypercapnia and hypocapnia on ventilatory variability and the chaotic dynamics of ventilatory flow in humans. Am J Physiol Regul Integr Comp Physiol. 2007;292:R1985–R1993. doi: 10.1152/ajpregu.00792.2006. [DOI] [PubMed] [Google Scholar]
- Gattinoni L, Bombino M, Pelosi P, Lissoni A, Pesenti A, Fumagalli R, Tagliabue M. Lung structure and function in different stages of severe adult respiratory distress syndrome. JAMA. 1994;271:1772–1779. [PubMed] [Google Scholar]
- Giraldo BF, Chaparro J, Ballesteros D, Lopez-Rodriguez L, Geat D, Benito S, Caminal P. Study of the respiratory pattern variability in patients during weaning trials; Conf Proc IEEE Eng Med Biol Soc; 2004. pp. 3909–3912. [DOI] [PubMed] [Google Scholar]
- Goehler LE, Gaykema RP, Hansen MK, Anderson K, Maier SF, Watkins LR. Vagal immune-to-brain communication: a visceral chemosensory pathway. Auton Neurosci. 2000;85:49–59. doi: 10.1016/S1566-0702(00)00219-8. [DOI] [PubMed] [Google Scholar]
- Goldberger AL. Heartbeats, hormones, and health: is variability the spice of life? Am J Respir Crit Care Med. 2001;163:1289–1290. doi: 10.1164/ajrccm.163.6.ed1801a. [DOI] [PubMed] [Google Scholar]
- Gordon FJ. Effect of nucleus tractus solitarius lesions on fever produced by interleukin-1beta. Auton Neurosci. 2000;85:102–110. doi: 10.1016/s1566-0702(00)00228-9. [DOI] [PubMed] [Google Scholar]
- Griffin MP, Moorman JR. Toward the early diagnosis of neonatal sepsis and sepsis-like illness using novel heart rate analysis. Pediatrics. 2001;107:97–104. doi: 10.1542/peds.107.1.97. [DOI] [PubMed] [Google Scholar]
- Griffin MP, O'Shea TM, Bissonette EA, Harrell FE, Jr, Lake DE, Moorman JR. Abnormal heart rate characteristics are associated with neonatal mortality. Pediatr Res. 2004;55:782–788. doi: 10.1203/01.PDR.0000119366.21770.9E. [DOI] [PubMed] [Google Scholar]
- Huikuri HV, Makikallio TH, Peng CK, Goldberger AL, Hintze U, Moller M. Fractal correlation properties of R-R interval dynamics and mortality in patients with depressed left ventricular function after an acute myocardial infarction. Circulation. 2000;101:47–53. doi: 10.1161/01.cir.101.1.47. [DOI] [PubMed] [Google Scholar]
- Ibrahim LH, Patel SR, Modarres M, Johnson NL, Mehra R, Kirchner HL, Redline S. A measure of ventilatory variability at wake-sleep transition predicts sleep apnea severity. Chest. 2008;134:73–78. doi: 10.1378/chest.07-1705. [DOI] [PMC free article] [PubMed] [Google Scholar]
- Jacono FJ, De Georgia MA, Wilson CG, Dick TE, Loparo KA. Data Acquisition and Complex Systems Analysis in Critical Care: Developing the Intensive Care Unit of the Future. Journal of Healthcare Engineering. 2010;1:337–356. [Google Scholar]
- Jacono FJ, Peng YJ, Nethery D, Faress JA, Lee Z, Kern JA, Prabhakar NR. Acute lung injury augments hypoxic ventilatory response in the absence of systemic hypoxemia. J Appl Physiol. 2006;101:1795–1802. doi: 10.1152/japplphysiol.00100.2006. [DOI] [PubMed] [Google Scholar]
- Jubran A, Grant BJ, Tobin MJ. Effect of hyperoxic hypercapnia on variational activity of breathing. Am J Respir Crit Care Med. 1997;156:1129–1139. doi: 10.1164/ajrccm.156.4.97-01080. [DOI] [PubMed] [Google Scholar]
- Jubran A, Tobin MJ. Effect of isocapnic hypoxia on variational activity of breathing. Am J Respir Crit Care Med. 2000;162:1202–1209. doi: 10.1164/ajrccm.162.4.9907003. [DOI] [PubMed] [Google Scholar]
- Kaffashi F, Foglyano R, Wilson CG, Loparo KA. The effect of time delay on Approximate & Sample Entropy calculations. Physica D: Nonlinear Phenomena. 2008;237:3069–3074. [Google Scholar]
- Kaimakamis E, Bratsas C, Sichletidis L, Karvounis C, Maglaveras N. Screening of patients with Obstructive Sleep Apnea Syndrome using C4.5 algorithm based on non linear analysis of respiratory signals during sleep; Conf Proc IEEE Eng Med Biol Soc; 2009. pp. 3465–3469. [DOI] [PubMed] [Google Scholar]
- Khoo MC. Determinants of ventilatory instability and variability. Respir Physiol. 2000;122:167–182. doi: 10.1016/s0034-5687(00)00157-2. [DOI] [PubMed] [Google Scholar]
- Kleiger RE, Miller JP, Bigger JT, Jr, Moss AJ. Decreased heart rate variability and its association with increased mortality after acute myocardial infarction. Am J Cardiol. 1987;59:256–262. doi: 10.1016/0002-9149(87)90795-8. [DOI] [PubMed] [Google Scholar]
- Koo BB, Strohl KP, Gillombardo CB, Jacono FJ. Ventilatory patterning in a mouse model of stroke. Respir Physiol Neurobiol. 2010;172:129–135. doi: 10.1016/j.resp.2010.05.008. [DOI] [PMC free article] [PubMed] [Google Scholar]
- Kuratomi Y, Okazaki N, Ishihara T, Arai T, Kira S. Variability of breath-by-breath tidal volume and its characteristics in normal and diseased subjects. Ventilatory monitoring with electrical impedance pneumography. Jpn J Med. 1985;24:141–149. doi: 10.2169/internalmedicine1962.24.141. [DOI] [PubMed] [Google Scholar]
- Lai CJ, Ruan T, Kou YR. The involvement of hydroxyl radical and cyclooxygenase metabolites in the activation of lung vagal sensory receptors by circulatory endotoxin in rats. J Appl Physiol. 2005;98:620–628. doi: 10.1152/japplphysiol.00539.2004. [DOI] [PubMed] [Google Scholar]
- Lishner M, Akselrod S, Avi VM, Oz O, Divon M, Ravid M. Spectral analysis of heart rate fluctuations. A non-invasive, sensitive method for the early diagnosis of autonomic neuropathy in diabetes mellitus. J Auton Nerv Syst. 1987;19:119–125. doi: 10.1016/0165-1838(87)90005-1. [DOI] [PubMed] [Google Scholar]
- Longobardo GS, Cherniack NS, Fishman AP. Cheyne-Stokes breathing produced by a model of the human respiratory system. J Appl Physiol. 1966;21:1839–1846. doi: 10.1152/jappl.1966.21.6.1839. [DOI] [PubMed] [Google Scholar]
- Maier SF, Goehler LE, Fleshner M, Watkins LR. The role of the vagus nerve in cytokine-to-brain communication. Ann N Y Acad Sci. 1998;840:289–300. doi: 10.1111/j.1749-6632.1998.tb09569.x. [DOI] [PubMed] [Google Scholar]
- Mangin L, Leseche G, Duprey A, Clerici C. Ventilatory chaos is impaired in carotid atherosclerosis. PLoS One. 2011;6:e16297. doi: 10.1371/journal.pone.0016297. [DOI] [PMC free article] [PubMed] [Google Scholar]
- Matute-Bello G, Frevert CW, Martin TR. Animal models of acute lung injury. Am J Physiol Lung Cell Mol Physiol. 2008;295:L379–L399. doi: 10.1152/ajplung.00010.2008. [DOI] [PMC free article] [PubMed] [Google Scholar]
- Mietus JE, Peng C, Ivanov PC, Goldberger AL. Detection of obstructive sleep spnea from cardiac interbeat interval time series. Computers in Cardiology. 2000;27:753–756. [Google Scholar]
- Miyata M, Burioka N, Sako T, Suyama H, Fukuoka Y, Tomita K, Higami S, Shimizu E. A short daytime test using correlation dimension for respiratory movement in OSAHS. Eur Respir J. 2004;23:885–890. doi: 10.1183/09031936.04.00044104. [DOI] [PubMed] [Google Scholar]
- Miyata M, Burioka N, Suyama H, Sako T, Nomura T, Takeshima T, Higami S, Shimizu E. Non-linear behaviour of respiratory movement in obstructive sleep apnoea syndrome. Clin Physiol Funct Imaging. 2002;22:320–327. doi: 10.1046/j.1475-097x.2002.00438.x. [DOI] [PubMed] [Google Scholar]
- Odemuyiwa O, Malik M, Farrell T, Bashir Y, Poloniecki J, Camm J. Comparison of the predictive characteristics of heart rate variability index and left ventricular ejection fraction for all-cause mortality, arrhythmic events and sudden death after acute myocardial infarction. Am J Cardiol. 1991;68:434–439. doi: 10.1016/0002-9149(91)90774-f. [DOI] [PubMed] [Google Scholar]
- Pelosi P, Cereda M, Foti G, Giacomini M, Pesenti A. Alterations of lung and chest wall mechanics in patients with acute lung injury: effects of positive end-expiratory pressure. Am J Respir Crit Care Med. 1995;152:531–537. doi: 10.1164/ajrccm.152.2.7633703. [DOI] [PubMed] [Google Scholar]
- Piantadosi CA, Schwartz DA. The acute respiratory distress syndrome. Ann Intern Med. 2004;141:460–470. doi: 10.7326/0003-4819-141-6-200409210-00012. [DOI] [PubMed] [Google Scholar]
- Preas HL, 2nd, Jubran A, Vandivier RW, Reda D, Godin PJ, Banks SM, Tobin MJ, Suffredini AF. Effect of endotoxin on ventilation and breath variability: role of cyclooxygenase pathway. Am J Respir Crit Care Med. 2001;164:620–626. doi: 10.1164/ajrccm.164.4.2003031. [DOI] [PubMed] [Google Scholar]
- Quan N. Immune-to-brain signaling: how important are the blood-brain barrier-independent pathways? Mol Neurobiol. 2008;37:142–152. doi: 10.1007/s12035-008-8026-z. [DOI] [PMC free article] [PubMed] [Google Scholar]
- Richman JS, Moorman JR. Physiological time-series analysis using approximate entropy and sample entropy. Am J Physiol Heart Circ Physiol. 2000;278:H2039–H2049. doi: 10.1152/ajpheart.2000.278.6.H2039. [DOI] [PubMed] [Google Scholar]
- Ruan T, Lin YS, Lin KS, Kou YR. Sensory transduction of pulmonary reactive oxygen species by capsaicin-sensitive vagal lung afferent fibres in rats. J Physiol. 2005;565:563–578. doi: 10.1113/jphysiol.2005.086181. [DOI] [PMC free article] [PubMed] [Google Scholar]
- Rubenfeld GD, Caldwell E, Peabody E, Weaver J, Martin DP, Neff M, Stern EJ, Hudson LD. Incidence and outcomes of acute lung injury. N Engl J Med. 2005;353:1685–1693. doi: 10.1056/NEJMoa050333. [DOI] [PubMed] [Google Scholar]
- Sako T, Burioka N, Suyama H, Nomura T, Takeshima T, Shimizu E. Nonlinear behavior of human respiratory movement during different sleep stages. Chronobiol Int. 2001;18:71–83. doi: 10.1081/cbi-100001172. [DOI] [PubMed] [Google Scholar]
- Schelegle ES, Walby WF, Mansoor JK, Chen AT. Lung vagal afferent activity in rats with bleomycin-induced lung fibrosis. Respir Physiol. 2001;126:9–27. doi: 10.1016/s0034-5687(00)00228-0. [DOI] [PubMed] [Google Scholar]
- Schreiber T, Schmitz A. Surrogate time series. Physica D. 2000;142:346–382. [Google Scholar]
- Shimabukuro DW, Sawa T, Gropper MA. Injury and repair in lung and airways. Crit Care Med. 2003;31:S524–S531. doi: 10.1097/01.CCM.0000081437.06466.B3. [DOI] [PubMed] [Google Scholar]
- Stein PK, Domitrovich PP, Huikuri HV, Kleiger RE. Traditional and nonlinear heart rate variability are each independently associated with mortality after myocardial infarction. J Cardiovasc Electrophysiol. 2005;16:13–20. doi: 10.1046/j.1540-8167.2005.04358.x. [DOI] [PubMed] [Google Scholar]
- Strieter RM, Kunkel SL, Keane MP, Standiford TJ. Chemokines in lung injury: Thomas A. Neff Lecture. Chest. 1999;116:103S–110S. doi: 10.1378/chest.116.suppl_1.103s. [DOI] [PubMed] [Google Scholar]
- Suratt BT, Parsons PE. Mechanisms of acute lung injury/acute respiratory distress syndrome. Clin Chest Med. 2006;27:579–589. doi: 10.1016/j.ccm.2006.06.005. abstract viii. [DOI] [PubMed] [Google Scholar]
- Takagishi M, Waki H, Bhuiyan ME, Gouraud SS, Kohsaka A, Cui H, Yamazaki T, Paton JF, Maeda M. IL-6 microinjected in the nucleus tractus solitarii attenuates cardiac baroreceptor reflex function in rats. Am J Physiol Regul Integr Comp Physiol. 2010;298:R183–R190. doi: 10.1152/ajpregu.00176.2009. [DOI] [PubMed] [Google Scholar]
- Tapanainen JM, Thomsen PE, Kober L, Torp-Pedersen C, Makikallio TH, Still AM, Lindgren KS, Huikuri HV. Fractal analysis of heart rate variability and mortality after an acute myocardial infarction. Am J Cardiol. 2002;90:347–352. doi: 10.1016/s0002-9149(02)02488-8. [DOI] [PubMed] [Google Scholar]
- Thayer JF, Sternberg EM. Neural aspects of immunomodulation: focus on the vagus nerve. Brain Behav Immun. 2010;24:1223–1228. doi: 10.1016/j.bbi.2010.07.247. [DOI] [PMC free article] [PubMed] [Google Scholar]
- Theiler J. Spurious dimension from correlation algorithms applied to limited time-series data. Phys Rev A. 1986;34:2427–2432. doi: 10.1103/physreva.34.2427. [DOI] [PubMed] [Google Scholar]
- Tracey KJ. The inflammatory reflex. Nature. 2002;420:853–859. doi: 10.1038/nature01321. [DOI] [PubMed] [Google Scholar]
- Van den Aardweg JG, Karemaker JM. Influence of chemoreflexes on respiratory variability in healthy subjects. Am J Respir Crit Care Med. 2002;165:1041–1047. doi: 10.1164/ajrccm.165.8.2104100. [DOI] [PubMed] [Google Scholar]
- Vassilakopoulos T, Katsaounou P, Karatza MH, Kollintza A, Zakynthinos S, Roussos C. Strenuous resistive breathing induces plasma cytokines: role of antioxidants and monocytes. Am J Respir Crit Care Med. 2002;166:1572–1578. doi: 10.1164/rccm.200203-177OC. [DOI] [PubMed] [Google Scholar]
- Veiga J, Faria RC, Esteves GP, Lopes AJ, Jansen JM, Melo PL. Approximate entropy as a measure of the airflow pattern complexity in asthma; Conf Proc IEEE Eng Med Biol Soc; 2010. pp. 2463–2466. [DOI] [PubMed] [Google Scholar]
- Ware LB, Matthay MA. The acute respiratory distress syndrome. N Engl J Med. 2000;342:1334–1349. doi: 10.1056/NEJM200005043421806. [DOI] [PubMed] [Google Scholar]
- Watkins LR, Maier SF, Goehler LE. Cytokine-to-brain communication: a review & analysis of alternative mechanisms. Life Sci. 1995;57:1011–1026. doi: 10.1016/0024-3205(95)02047-m. [DOI] [PubMed] [Google Scholar]
- Webber C, Zbilut J. Ventilatory Pattern Variability in Mammals Wliey Encyclopedia of Biomedical Engineering ebs. 2006;1260:1–9. [Google Scholar]
- Wysocki M, Cracco C, Teixeira A, Mercat A, Diehl JL, Lefort Y, Derenne JP, Similowski T. Reduced breathing variability as a predictor of unsuccessful patient separation from mechanical ventilation. Crit Care Med. 2006;34:2076–2083. doi: 10.1097/01.CCM.0000227175.83575.E9. [DOI] [PubMed] [Google Scholar]
- Yeragani VK, Radhakrishna RK, Tancer M, Uhde T. Nonlinear measures of respiration: respiratory irregularity and increased chaos of respiration in patients with panic disorder. Neuropsychobiology. 2002;46:111–120. doi: 10.1159/000066388. [DOI] [PubMed] [Google Scholar]


