Abstract
Cancellous bone microstructure is an important determinant of the mechanical integrity of vertebrae. The numerous microstructural parameters that have been studied extensively are generally represented as a single value obtained as an average over a sample. The range of the intra-sample variability of cancellous microstructure and its effect on the mechanical properties of bone are less well-understood. The objectives of this study were to investigate the extent to which human cancellous bone microstructure within a vertebra i) is related to bone modulus and stress distribution properties and ii) changes along with age, gender and locations thoracic 12 (T12) vs lumbar 1 (L1).
Vertebrae were collected from 15 male (66±15 yrs) and 25 female (54±16 yrs) cadavers. Three dimensional finite element models were constructed using microcomputed tomography images of cylindrical specimens. Linear finite element models were used to estimate apparent modulus and stress in the cylinders during uniaxial compression. The intra-specimen mean, standard deviation (SD) and coefficient of variation (CV) of microstructural variables were calculated.
Mixed model statistical analysis of the results demonstrated that increases in the intra-specimen variability of the microstructure contribute to increases in the variability of trabecular stresses and decreases in bone stiffness. These effects were independent from the contribution from intra-specimen average of the microstructure. Further, the effects of microstructural variability on bone stiffness and stress variability were not accounted for by connectivity and anisotropy. Microstructural variability properties (SD, CV) generally increased with age, were greater in females than in males and in T12 than in L1. Significant interactions were found between age, gender, vertebra and race. These interactions suggest that microstructural variability properties varied with age differently between genders, races and vertebral levels.
The current results collectively demonstrate that microstructural variability has a significant effect on mechanical properties and tissue stress of human vertebral cancellous bone. Considering microstructural variability could improve the understanding of bone fragility and improve assessment of vertebral fracture risk.
Keywords: Biomechanics, Stress/strain, Aging, Gender, Race, Microstructural Heterogeneity
1. INTRODUCTION
Cancellous bone microstructure is considered important in determining bone strength and fracture risk. The numerous microstructural parameters that have been studied extensively over the years are generally represented as a single value obtained as an average over a sample. However, the variation of the microstructure within the bone and its potential role on bone mechanical properties received less attention.
Engineering theories predict that the intra-sample variability of microstructure should have an effect on the mechanical properties of a cellular material like cancellous bone [2, 23, 45, 50]. Several previous studies did consider the intra-sample variability of cancellous microstructure and its effect on bone stiffness. However, each had features which limited their contributions to understanding. Some of these studies were limited to theoretical analyses using generic or limited 2D bone geometries for mechanical analysis [46, 55]. Some considered anatomic sites that are far apart from each other or from the sites of clinical interest [1, 6]. In the latter case, small samples were obtained from whole bones, and the properties were assumed to be homogeneous within each bone sample. Studies that considered the intra-sample variability of cancellous microstructure in vertebral bone at a finer scale than the whole bone were generally of pilot nature [20, 27, 30, 61] and used very few samples. Thus the association of intra-sample variability of microstructure with donor age, gender, anatomic site and bone mechanical properties in vertebral bone remains largely unknown.
Trabecular stress distribution parameters (trabecular shear stress per apparent uniaxial stress and coefficient of variation of trabecular shear stress) as estimated from large scale finite element (FE) analyses have been associated with age [59], bone strength [14] and with the amount of in vivo microdamage [56] in human vertebral cancellous bone. Similarly, measures of microstructural variability have been associated with structural mechanical properties of whole vertebral bodies [29, 47, 60]. Clinical data also indicate that measures of microstructural variability are associated with fracture risk in spine [31], hip [15] and the wrist [34] whether measured at, or remote from, the site of interest. The variability of stresses would be expected to be associated with variability of the microstructure for bone loaded predominantly in uniaxial compression. The relationship between stress distributions and the average properties of cancellous microstructure has been examined for vertebral bone [59] but not extended to the distribution properties of the microstructure.
The objectives of this study were to investigate the extent to which the spatial variation of human cancellous bone microstructure within a vertebra i) is related to bone modulus and stress distribution properties and ii) changes along with age, gender and locations thoracic 12 (T12) vs lumbar 1 (L1).
2. METHODS
The specimens and the μCT images were the same as in a previous study [59]. Briefly, cylindrical (∅8×10 mm) cancellous bone specimens from the anterior region of 40 pairs of fresh frozen T12 and L1 vertebrae were utilized. The specimens were from 14 black female (Age: 56 ± 18 years), 7 black male (Age: 70 ± 16 years), 11 white female (Age: 50 ± 14 years) and 8 white male cadavers (Age: 63 ± 15 years). The age difference between groups was not significant (p>0.07; ANOVA).
Details of specimen preparation, μCT scanning, reconstruction, linear FE models and calculation of apparent modulus (EFEM) and stress distribution properties were previously reported [59]. Two main trabecular stress distribution parameters, namely, coefficient of variation of trabecular von Mises stress distributions (VMCV) and average trabecular shear variation stress per apparent uniaxial stress (VMExp/σapp) were considered. The apparent modulus and stress distribution parameters used in the current study were the same as those in our previous study. Degree of anisotropy (DA) and connectivity density (-#Euler/Vol) were also calculated in previous work [59].
Trabecular microstructural parameters (BV/TV, Tb.Th, Tb.N and Tb.Sp) were calculated for each slice of the micro-CT image (~200 slices/specimen perpendicular to the supero-inferior direction; each 50μm thick) using 2D stereologic methods [17]. The intra-specimen mean (Av), standard deviation (SD) and coefficient of variation (CV) of each microstructural variable were calculated for each specimen. Multiple regression was used to assess the relationships between mechanical (EFEM, VMCV and VMExp/σapp) and microstructure parameters. Specifically, multiple regression models containing both the average and standard deviation of a microstructural parameter were used to examine the effect of the SD of a parameter in presence of its mean. Nonnormality in parameters and nonlinearity in relationships between some of the parameters were expected based on previous work [58, 59], therefore, multiple regressions were re-performed on Box-Cox-transformed variables [5]. The transformation was of the form X(λ)=(xλ−1)/λγλ−1 (λ≠0) or X(λ)=γ ln(x) (λ=0), where γ is the geometric mean of the untransformed variable x. An optimal value of the transform parameter (λ) was determined for each variable so as to minimize sum of square of errors around the mean. All transformations are such that the transformed parameter increases with increasing untransformed parameter.
Stepwise regression models with DA, -#Euler/Vol, BV/TV.Av, BV/TV.SD, Tb.N.Av, Tb.N.SD as predictors were considered to examine whether an SD parameter can contribute further to the prediction of a mechanical parameter in presence of a set of conventional average properties. In these models, BV/TV.Av was introduced first and forced to remain in the model. The inclusion of Tb.N.Av in the predictor set caused substantial multicollinearity as indicated by a variance inflation factor (VIF) of 27.7 and 40.0 for the untransformed and transformed set of predictors, respectively. Subsequently, we removed Tb.N.Av from the predictor set which resulted in a maximum VIF of 2.25 and 2.82 for untransformed and transformed set of predictors, respectively.
Mixed model procedures were used to examine the effect of vertebra type, gender and age on the microstructure distribution properties. Because we had a mixed group of black and white donors, race was also included in the models (as identified in the medical record). Analysis started with examination of interactions between effects. The analysis proceeded in a backward stepwise fashion where nonsignificant terms were removed starting with higher order interactions followed by lower order interactions and main effects. When a significant interaction was present, the sample was separated according to the interacting terms and the sub-groups were analyzed separately. Final models were constructed by removing the nonsignificant effects and interactions from the initial model.
Statistical analysis was performed using JMP (Version 7.0.2, SAS Institute Inc., Cary, NC). Statistical significance was set as p<0.05. p-values corresponding to an α of 0.05 were indicated for multiple tests, taking into account the correlations between parameters [42].
3. RESULTS
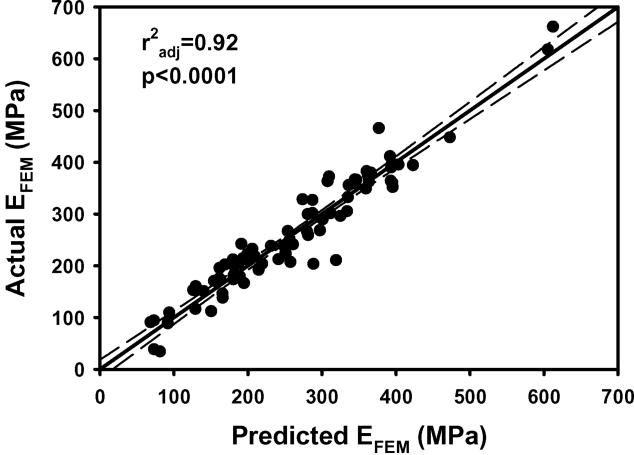
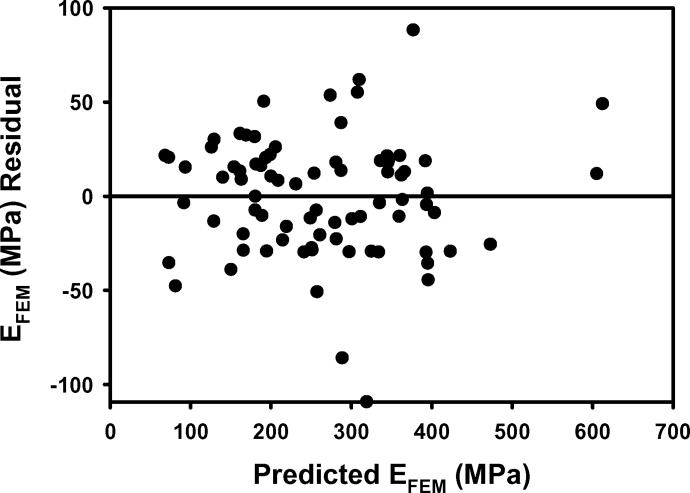
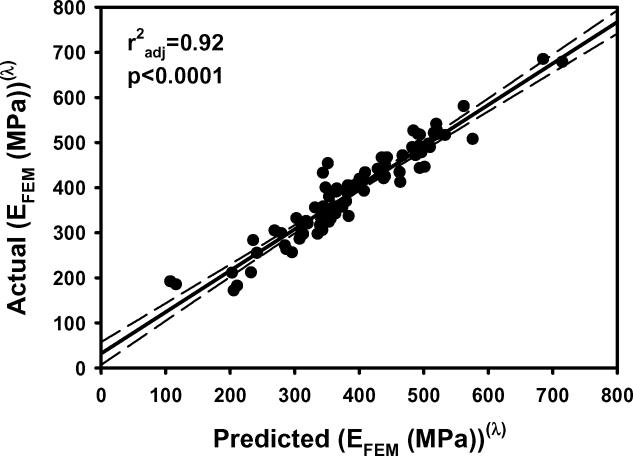
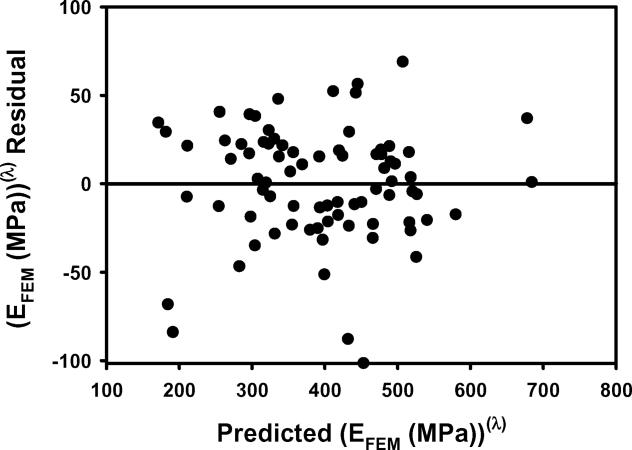
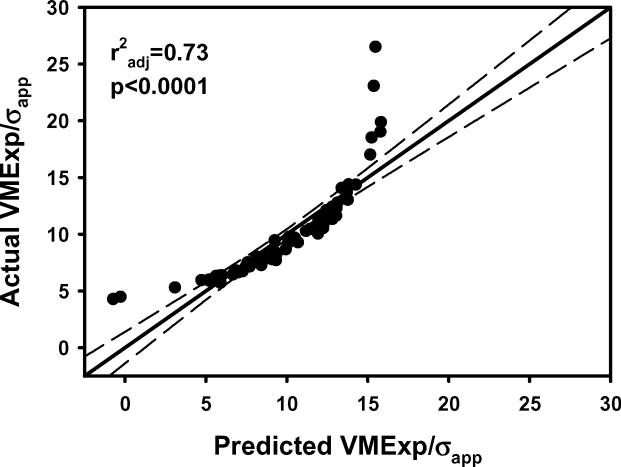
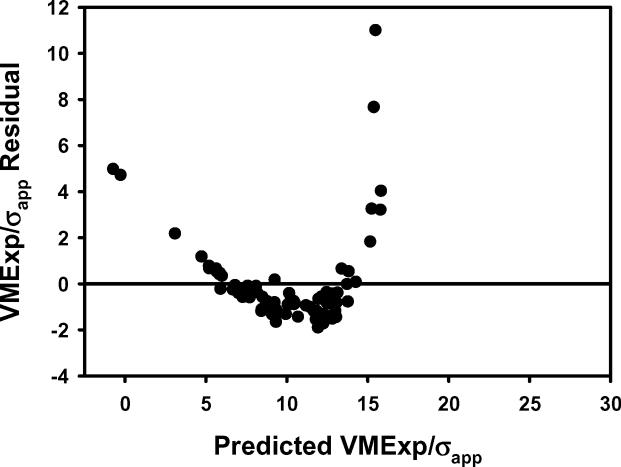
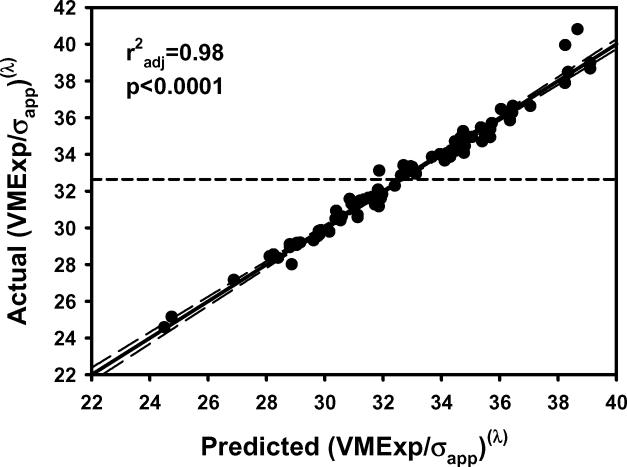
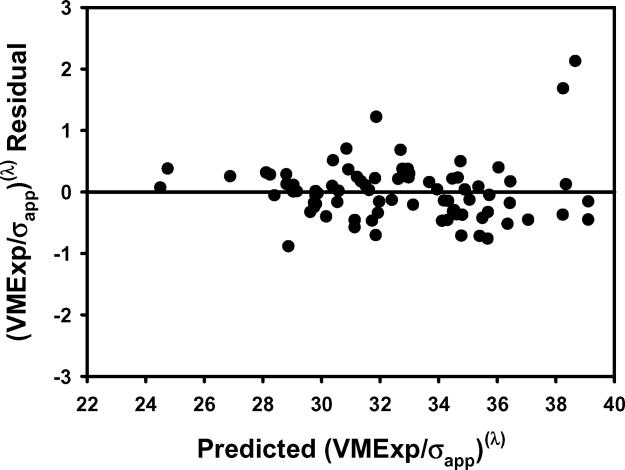
Transformation of the outcome variables was necessary and substantially improved the model fit in some instances (Figures 1–2). The optimum λ was 0.6, −2, −0.4, 0.4, −0.2, −1, −0.2, 1.2, 0, −0.6, −0.6, −0.4 and 0.4 for EFEM, VMCV, VMExp/σapp, BV/TV.Av, BV/TV.SD, Tb.Th.Av, Tb.Th.SD, Tb.N.Av, Tb.N.SD, Tb.Sp.Av, Tb.Sp.SD, DA and -#Euler/Vol, respectively. All transformed parameters were normally distributed (p>0.19 to p>0.98; Shapiro-Wilk W test) except for Tb.Sp.SD (p=0.0427), which was substantially nonnormal prior to the transformation (p<0.0001).
Figure 1.
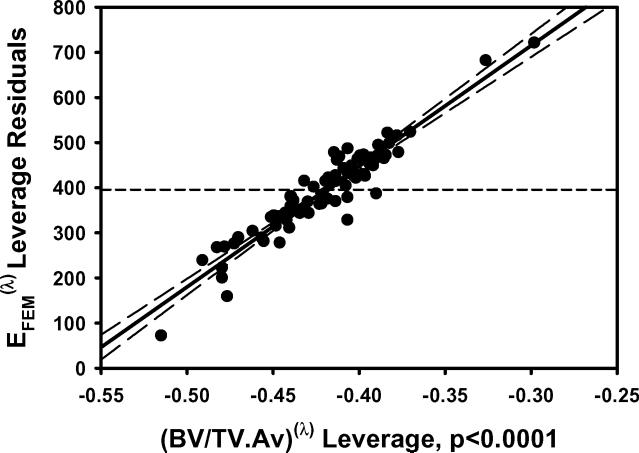
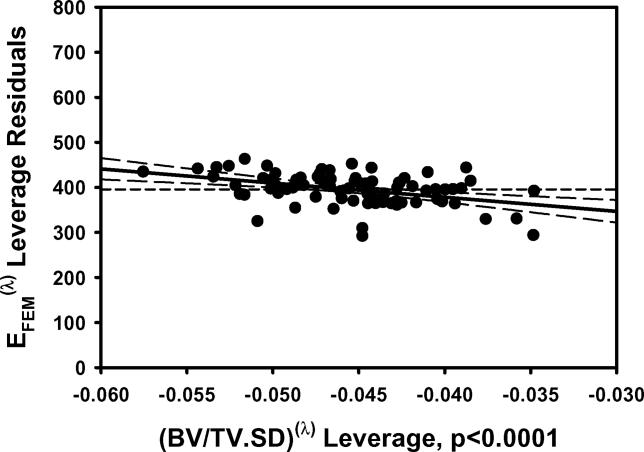
a) EFEM calculated from finite element models vs EFEM predicted by the multiple regression model including BV/TV.Av and BV/TV.SD using nontransformed variables. b) The residuals for the model with nontransformed variables. c) As in 1a except using transformed variables. d) The residuals for the model with transformed variables. e) Leverage plot for BV/TV.Av and f) Leverage plot for BV/TV.SD. Solid, medium dashed and small dashed lines show linear fits, 95% confidence intervals and mean of the actual EFEM, respectively. (95% confidence curve crossing the mean response line indicates a significant leverage for the effect.) The model with transformed variables and that with nontransformed variables were qualitatively similar.
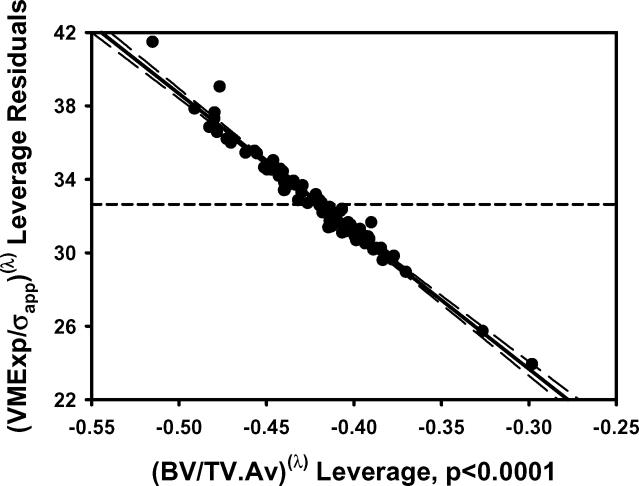
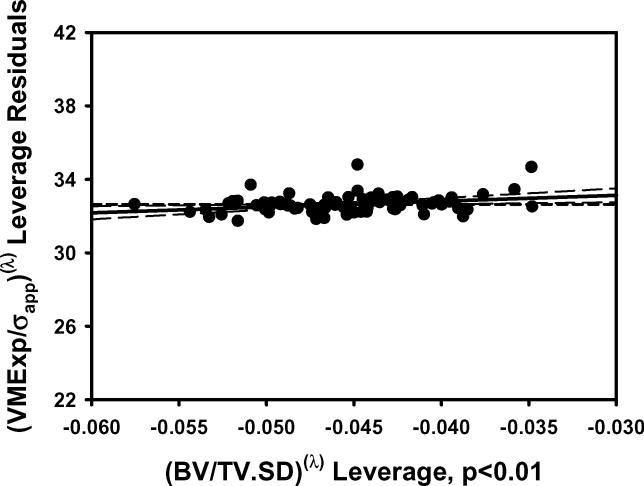
Figure 2.
The plots of a) VMExp/σapp calculated from finite element models vs VMExp/σapp predicted by the multiple regression model including BV/TV.Av and BV/TV.SD and b) the residuals indicated that the linear model fit was not appropriate. The transformation of variables resulted in an improved fit as indicated by the plots of c) calculated (VMExp/σapp)(λ) vs predicted (VMExp/σapp)(λ) app and d) the residuals from the model with transformed variables. e) Leverage plot for BV/TV.Av(λ) and f) leverage plot for BV/TV.SD(λ) in the transformed model. The model with transformed variables, unlike that with nontransformed variables, indicates a significant, albeit small, effect of BV/TV.SD on VMExp/σapp.
In multiple regression models that included both the average and standard deviation of microstructural parameters, EFEM increased with increasing BV/TV.Av, Tb.Th.Av and Tb.N.Av, and decreased with increasing Tb.Sp.Av (Table 1; Figure 1). Conversely, both VMCV and VMExp/σapp decreased with increasing BV/TV.Av, Tb.Th.Av and Tb.N.Av, and increased with increasing Tb.Sp.Av (p<0.0001 for all) (Table 1; Figure 2).
Table 1.
Multiple regression models examining the effect of the mean and variability of each microstructural parameter on EFEM, VMCV and VMExp/σapp. The estimate for each term in the model is given with the associated p-value in parenthesis.
| Response | Term | BV/TV(λ) | Tb.Th (mm)(λ) | Tb.N(mm−1)(λ) | Tb.Sp (mm)(λ) |
|---|---|---|---|---|---|
|
| |||||
| (EFEM(MPa))(λ) | Av | 2675 (<.0001) | 8606 (<.0001) | 326.9 (<.0001) A | −474.0 (<.0001) |
| SD | −3148(<.0001) | −15983 (<.0001) | NS (p>0.23) | NS (p>0.39) | |
| Int | 1374 (<.0001) | 901.9 (<.0001) | 206.0 (<.006) | 242.5 (<.0001) | |
| Model | r2 adj | 0.92 | 0.51 | 0.78 | 0.82 |
| p< | 0.0001 | 0.0001 | 0.0001 | 0.0001 | |
|
| |||||
| (VMCV (%))λ | Av | −1.969 (<.0001) | −5.883 (.0001) | −0.2142 (<.0001) | 0.1526 (<.04) |
| SD | 7.124 (<.0001) | 20.17 (<.0001) | 0.7951 (=0.0192) | 1.222 (=0.0106) | |
| Int | −0.6918 (<.0001) | −0.3309 (<.0001) | NS (p>0.39) | NS (p>0.22) | |
| Model | r2 adj | 0.64 | 0.42 | 0.50 | 0.53 |
| p< | 0.0001 | 0.0001 | 0.0001 | 0 0001 | |
|
| |||||
| (VMExp/σapp)(λ) | Av | −74.95 (<.0001) | −229.8 (<.0001) | −9.672 (<.0001) | 15.79 (<.0001) |
| SD | 31.64 (<.01) | 343.2 (<.006) | NS (p>0.72) | NS (p>0.79) | |
| Int | 2.634 (<.0001) | 17.26 (<.0001) | 36.39 (<.0001) | 36.54 (<.0001) | |
| Model | r2 adj | 0.98 | 0.46 | 0.86 | 0.90 |
| p< | 0.0001 | 0.0001 | 0.0001 | 0.0001 | |
Int: Intercept
An adjustment for multiple tests, taking into account the correlations between all parameters, suggested that a p-value of 0.0170 be considered as significant for an α of 0.05.
EFEM decreased with increasing BV/TV.SD and Tb.Th.SD independent of the effect of their mean values (Table 1; Figure 1). Conversely, both VMCV and VMExp/σapp increased with increasing BV/TV.SD and Tb.Th.SD independent of the effect of their mean values (p<0.01 for all) (Table 1; Figure 2). Additionally, VMCV increased with increasing Tb.N.SD and Tb.Th.SD independent of the effect of their mean values (p<0.02).
Stepwise regression models selected at least one standard deviation parameter as a significant predictor in addition to the mean of that parameter for EFEM and VMCV but not for VMExp/σapp (Table 2).
Table 2.
a. Multiple regression models for EFEM, VMCV and VMExp/σapp. For comparison with previous work [59], models were constructed using a stepwise regression that included BV/TV.Av, BV/TV.SD, Tb.N.Av, Tb.N.SD, -#Euler/Vol and DA as explanatory variables. BV/TV.Av was forced to stay in the model in order to determine contributions from other variables that are independent of BV/TV.
b. Multiple regression models for EFEM(λ) VMCV(λ) and (VMExp/σapp) (λ) after elimination of Tb.N.Av. Models were constructed using a stepwise regression that included BV/TV.Av(λ), BV/TV.SD(λ), Tb.N.SD(λ), -#Euler/Vol(λ) and DA(λ) as explanatory variables. BV/TV.Av(λ) was forced to stay in the model in order to determine contributions from other variables that are independent of BV/TV.
| Response | Term | Estimate | t ratio | p< |
|---|---|---|---|---|
| EFEM (r2adj=0.93; p<0.0001) | BV/TV.Av | 2650.5 | 28.07 | 0.0001 |
| BV/TV.SD | −1962.5 | −2.79 | 0.007 | |
| DA | 52.73 | 2.47 | 0.02 | |
| Intercept | −190.3 | −4.71 | 0.0001 | |
|
| ||||
| VMCV (r2adj=0.68; p<0.0001) | BV/TV.Av | −1.865 | −10.95 | 0.0001 |
| BV/TV.SD | 3.611 | 2.84 | 0.006 | |
| DA | −0.2347 | −6.10 | 0.0001 | |
| Intercept | 1.312 | 18.01 | 0.0001 | |
|
| ||||
| VMExp/σapp (r2adj=0.78; p<0.0001) | BV/TV.Av | −40.99 | −2.94 | 0.005 |
| Tb.N.Av | −5.764 | −2.89 | 0.005 | |
| DA | −2.992 | −2.38 | 0.02 | |
| Intercept | 28.63 | 12.75 | 0.0001 | |
| Response | Term | Estimate | t ratio | p< |
|---|---|---|---|---|
| EFEM (r2adj=0.93; p<0.0001) | BV/TV.Av(λ) | 2852.5 | 24.03 | 0.0001 |
| BV/TV.SD(λ) | −1915.0 | −2.39 | 0.02 | |
| DA(λ) | 59.27 | 2.76 | 0.008 | |
| -#Euler/Vol(λ) | −99.56 | −3.15 | 0.003 | |
| Intercept | −1915.0 | −2.39 | 0.0001 | |
|
| ||||
| VMCV(λ)(r2adj=0.74; p<0.0001) | BV/TV.Av(λ) | −1.837 | −12.95 | 0.0001 |
| BV/TV.SD(λ) | 4.209 | 3.55 | 0.0007 | |
| DA(λ) | −0.1781 | −5.59 | 0.0001 | |
| Intercept | −0.6122 | 11.89 | 0.0001 | |
|
| ||||
| (VMExp/σapp)(λ) (r2adj=0.98; p<0.0001) | BV/TV.Av(λ) | −75.75 | −45.62 | 0.0001 |
| DA(λ) | −1.138 | −3.83 | 0.0003 | |
| -#Euler/Vol(λ) | 1.094 | 2.26 | 0.03 | |
| Intercept | 28.63 | 12.75 | 0.0001 | |
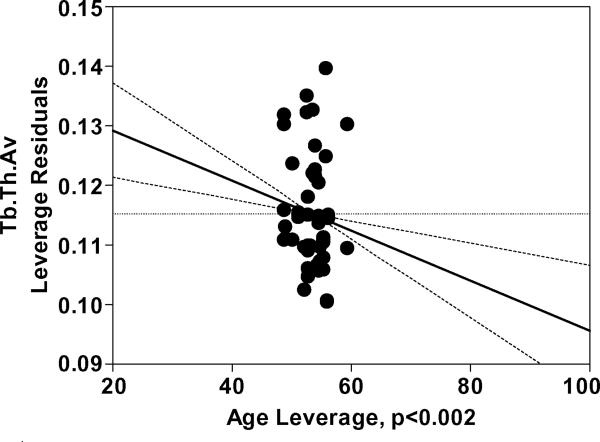
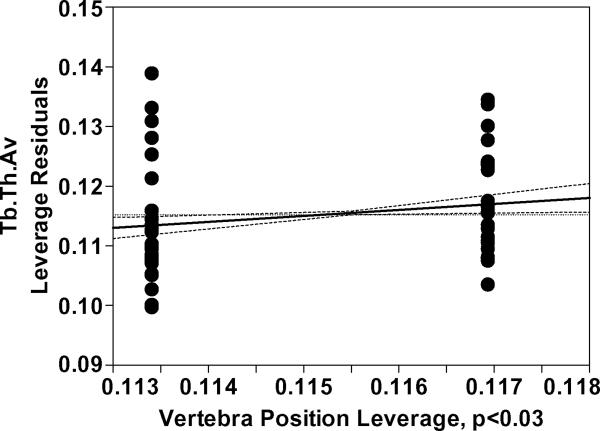
Average BV/TV and Tb.N decreased while Tb.Sp.Av increased with age (p<0.0001 for all) with no other significant effect in the model. Significant interaction of age and gender was found for Tb.Th.Av (p<0.009). Further analysis after separating the data between males and females indicated that Tb.Th.Av was smaller in T12 than in L1 (p<0.03) and decreased with age (p<0.002) in females (Table 3, Figure 3).
Table 3.
Summary of significant age, gender, vertebra and race effects on the micro structural variables, grouped by distribution properties. Females, T12 and blacks are the positive directions in the Gender (G), Position (P) and Race (R) rows, respectively. The blank entries are those that were removed from the model during the backward stepwise analysis described in Methods. The entries that are not blank show the final reduced status of the model with “NS” indicating the nonsignificant factors. The final reduced model contains nonsignificant factors only when significant interactions are present. The results are separated between genders, positions and/or races if significant interactions were found. The results of such analyses are shown below the main model in the same cell. (Eg. Average Tb.Th is smaller in T12 than in L1. Further analysis of the interaction between age and gender suggested that Tb.Th.Av decreases with age in female and that T12 has less Tb.Th.Av than L1 in females.)
| BV/TV | Tb.Th | Tb.N | Tb.Sp | ||
|---|---|---|---|---|---|
| NS | ↓ p<0.0001 | ↑ p<0.0001 | |||
| NS | |||||
| ↓ p<0.05 | |||||
| Race (B) | |||||
| A*G | p<0.009 | ||||
| A*P | |||||
| A*R | |||||
| G*P | |||||
| G*R | |||||
| P*R | |||||
| A*G*P | |||||
| A*G*R | |||||
| A*P*R | |||||
| G*P*R | |||||
| A*G*P*R | |||||
| F: Age ↓ p<0.002 | |||||
| F: P(T12) ↓ p<0.03 | |||||
| see Fig. 3 | |||||
| SD | Age | NS | ↑ p<0.0003 | ||
| G (F) | ↑ p<0.009 | ↑ p<0.01 | NS | ||
| P (T12) | ↑ p=0.0154 | ↑ p<0.04 | |||
| Race (B) | NS | ||||
| A*G | NS | ||||
| A*P | NS | ||||
| A*R | NS | ||||
| G*P | p<0.04 | ||||
| G*R | NS | ||||
| P*R | NS | ||||
| A*G*P | NS | ||||
| A*G*R | p<0.03 | ||||
| A*P*R | NS | ||||
| G*P*R | NS | ||||
| A*G*P*R | p<0.05 | ||||
| M: P(T12) ↑ p<0.006 | |||||
| BFL: Age ↑ p<0.05 | |||||
| WFT: : Age ↓ p<0.03 | |||||
| BMT: Age ↑ p<0.03 | |||||
| see Fig. 4 | |||||
| CV | Age | ↑ p<0.004 | ↑ p<0.008 | ↑ p<0.03 | |
| G (F) | ↑ p<0.04 | ↑ p=0.0136 | NS | NS | |
| P (T12) | NS | ↑ p=0.0140 | ↑ p<0.007 | ||
| Race (B) | NS | NS | NS | ||
| A*G | NS | NS | NS | ||
| A*P | NS | NS | NS | ||
| A*R | NS | NS | NS | ||
| G*P | NS | p<0.04 | NS | ||
| G*R | NS | NS | NS | ||
| P*R | NS | NS | NS | ||
| A*G*P | NS | ||||
| A*G*R | p=0.0195 | p<0.03 | p<0.007 | ||
| A*P*R | NS | ||||
| G*P*R | NS | ||||
| A*G*P*R | p<0.04 | ||||
| B: Age ↑ p<0.003 | BFL: Age ↑ p<0.008 | BF: Age ↑ p<0.009 | |||
| BF: Age ↑ p<0.003 | BFT: Age ↑ p<0.04 | ||||
| B: G(F) ↑ p<0.04 |
An adjustment for multiple tests, taking into account the correlations between all parameters, suggested that a p-value of 0.0196 be considered as significant for an α of 0.05.
Figure 3.
a) Age leverage and b) Vertebra leverage plots for the reduced Tb.Th.Av model for females, constructed based on significant interactions found between age and gender in the main model (Table 4). The increasing direction of vertebra leverage is from T12 to L1. The results show a decrease in Tb.Th.Av with increasing age and a greater Tb.Th.Av in L1 than in T12 for females. The age and vertebra effects were nonsignificant (p>0.4 and p>0.8, respectively) in the model for males.
Microstructural variability properties (SD, CV) generally increased with age, were greater in females than in males and in T12 than in L1 (Tables 3–4). A number of significant interactions found between age, gender, vertebra and race suggesting that microstructural variability properties varied with age differently between genders, races and vertebral levels.
Table 4.
The mean (standard deviation) of the measured microstructural variability parameters from thoracic 12 and lumbar1 vertebrae. Percent difference in means, significance of these differences and correlations between vertebrae are indicated. The percent differences between T12 an L1 were calculated with reference to T12. Results for average microstructural parameters were previously reported [59].
| Parameter | Thoracic 12 | Lumbar 1 | Difference% | Difference (p) | Correlation (r) | Correlation (p) |
|---|---|---|---|---|---|---|
| BV/TV.SD | 0.01781 (0.00717) | 0.01657 (0.00558) | −7.0% | 0.2114 | 0.554 | 0.0002 |
| Tb.N.SD | 0.1130 (0.0224) | 0.1035 (0.0226) | −8.4% | 0.0202 | 0.387 | 0.0137 |
| Tb.Sp.SD | 0.07810 (0.04318) | 0.071632 (0.039431) | −8.3% | <.0001 | 0.905 | <.0001 |
| Tb.Th.SD | 0.007661 (0.003370) | 0.007475 (0.002812) | −2.4% | 0.7148 | 0.483 | 0.0016 |
| BV/TV.CV | 0.1217 (0.4155) | 11.151 (3.23247) | −8.4% | 0.0881 | 0.527 | 0.0005 |
| Tb.N.CV | 0.8849 (0.2447) | 8.16003 (2.49851) | −7.8% | <.0001 | 0.719 | <.0001 |
| Tb.Sp.CV | 0.1084 (0.2641) | 9.8949 (2.53306) | −8.7% | 0.0143 | 0.598 | <.0001 |
| Tb.Th.CV | 0.6754 (0.2463) | 6.52107 (2.21202) | −3.4% | 0.5475 | 0.465 | 0.0025 |
An adjustment for multiple tests, taking into account the correlations between all parameters, suggested that a p-value of 0.0174 be considered as significant for an α of 0.05.
Absolute variability of microstructural properties (SD) generally increased with age, were greater in females than in males and in T12 than in L1: BV/TV.SD (p<0.009) and Tb.Th.SD (p<0.01) were greater in females than in males with no other significant effect in the models. A significant main effect of vertebral level was found (p<0.02) for the Tb.N.SD model indicating greater Tb.N.SD in T12 than in L1. A four-way interaction was noted for Tb.N.SD (p<0.05) warranting separate analysis of subgroups (Table 3). Tb.N.SD decreased with age in the T12 vertebrae of white females and black males (p<0.03) while it increased with age in L1 vertebrae of black females (p<0.05). Tb.Sp.SD was greater in T12 than in L1 (p<0.04) and increased with age (p<0.0003) (Table 3).
Relative variability of microstructural properties (CV) generally increased with age, were greater in females than in males and in T12 than in L1, similar to SD results: BV/TV.CV was greater in females than in males (p<0.04) and increased with age (p<0.004) (Table 3). A significant three-way interaction was noted between age, gender and race (p<0.02). Further analysis of separated groups revealed that the gender effect was significant within the black race (p<0.04) and the increase with age was significant within black females (p<0.003) and pooled black males and females (p<0.003). As in the case of SD, Tb.Th.CV was greater in females than in males with no other significant effect in the model (p<0.02). Significant main effects of age (p<0.008) and vertebral level (p<0.02) was found for the Tb.N.CV model indicating an increase in Tb.N.CV with age and a greater Tb.N.CV in T12 than in L1. As in the case of SD, a four-way interaction was noted for Tb.N.CV (p<0.04). Further analysis in separate subgroups revealed that Tb.N.CV. increased with age in the T12 and L1 vertebrae of black females (p<0.04 and p<0.008, respectively). Tb.Sp.CV was greater in T12 than in L1 (p<0.007) and increased with age (p<0.03). Significant interaction of age, gender and race was found for Tb.Sp.CV (p<0.007). Further analysis separate subgroups revealed that Tb.Sp.CV increased with age in black females (p<0.002).
4. DISCUSSION
We demonstrated, using 3D specimen-specific geometry and a large sample, that the variability of microstructural properties within a bone is different between female and male vertebral cancellous bone, between white and black races and between T12 and L1 vertebrae in the same individual. We also found that the variability of microstructural properties within a bone changes differently with age between genders, races and vertebrae. Consistent with previous predictions [55], we demonstrate that increases in microstructural variability contribute to increases in stress variability and decreases in bone stiffness independent from the contribution from intra-specimen average of the same microstructural parameter. Further, microstructural variability had a significant effect on bone stiffness and stress variability which was not accounted for by average microstructural measures including bone quantity, connectivity and anisotropy.
There are large differences in vertebral fracture risk between men and women. However, the exact sources of this difference are unclear. Very few studies noted gender-specific differences in vertebral cancellous bone microstructure [36]. No difference was noted between men and women in vertebral cancellous bone strength, bone volume fraction or ash density, or in their respective relationship with age [12, 35, 36, 51] when bone samples of similar size and anatomic location were examined. Differences in the anisotropy, bone loss patterns and transverse strength have been observed between male and female vertebral cancellous bone in some age groups after age-stratification. However, the microstructural changes were not consistent from age group to age group so as to explain the strength changes. For example, a greater distance between horizontal trabeculae was noted in females from above 75 years of age compared to females in the 50–75 years of age group. This difference suggests a greater susceptibility to fracture in the former, especially when loaded in the horizontal direction. However, when the samples were tested by loading horizontally, their strength was not different (0.31±0.12 MPa to 0.30±0.18 MPa) (others found similar results [36]), despite predictions to the contrary [21, 52]. Therefore, differences in uniaxial strength and average microstructure between male and female vertebral cancellous bone do not appear to explain the large differences in occurrence of vertebral fractures between them. The current results show that women have significantly greater cancellous bone variability than men in the anterior portion of T12 and L1 vertebrae. This previously unobserved difference in bone quality between males and females may be important in explaining the higher propensity of female vertebrae to fracture. There is some clinical evidence that the heterogeneity of cancellous bone properties can separate vertebral fracture patients from non-fracture patients [10, 31] suggesting that bone heterogeneity may be useful for predicting vertebral fracture risk.
Some of the differences in fracture risk between men and women may be attributable to the larger crossectional area of male vertebrae and their greater ability to expand with age than female vertebrae [4, 11, 37]. It was predicted that female vertebrae will lose strength at a higher rate than male vertebrae with age, primarily due to a greater loss of BMD in females than in males rather than due to crossectional area changes [4]. On the other hand, experimentally measured vertebral strength appears to decrease at a similar rate with age in men and women [37]. Nonetheless, a greater loss of whole vertebral bone mass with age in females than in males, together with identical rate of age-related bone mass loss in the central anterior region in Mosekilde studies, suggests that the loss of bone mass in women is more regional than in men. Such a bone loss pattern would result in an increased heterogeneity of bone mass in women compared to men. Together, these results suggest that the differences in microstructural heterogeneity observed between men and women in the current study might exist at the whole bone level as well.
There are differences in vertebral fracture risk between black and white races as well; blacks have a lower incidence of fractures (eg. [49]). Blacks are generally reported to have higher bone mass than whites, which is generally attributed to different rates of bone mass accumulation during growth [16]. However, the differences in vertebral cancellous bone architecture between blacks and whites are less well understood. BV/TV, trabecular thickness and turnover rates were generally evaluated from iliac crest bone and the differences between blacks and whites are largely dependent upon gender and geographic origin. Higher Tb.Th has been reported for African blacks than for whites in the iliac crest bone [44]. BV/TV has also been reported to be higher in African blacks than in whites but for men only [44]. While turnover rate has been reported to be higher in African blacks than in whites [43], it has been reported to be lower in American blacks than in whites [18, 53]. The relationship of microstructural parameters with age was also both gender- and race-dependent for African blacks: Trabecular thickness decreased in all groups except black males, trabecular number decreased in all groups except black females and, analogously with changes in trabecular number, trabecular separation increased in all groups except black females [44]. It is difficult to know to what extent the previous findings from iliac crest can be extrapolated to vertebra due to substantial differences between iliac crest and vertebral cancellous bone properties within an individual [38, 48]. Nevertheless, given these previous results, it is not surprising that we have found high order interactions of race with age and gender for our parameters. To our knowledge, age-related changes in cancellous bone heterogeneity, moreover, differences by race and gender have not been documented previously. Further understanding of these differences may provide insight into the role of genetic and environmental factors in regulation of bone microstructure.
The significant differences observed in the variability of cancellous microstructure between T12 and L1 were less than 10% but were greater than were observed for the average microstructure (Table 4) [59]. The variability parameters were also less well-correlated between the T12 and L1 of the same individual than were the average parameters (Table 4) [59]. These results suggest that while variations in average bone microstructure can be explained by factors common to the T12-L1 segment of the spine, the organization of this microstructure as measured by the variability of trabecular morphology is more dependent on local factors. The differences in microstructural variability between vertebrae that are far apart is expected to be greater than between the T12 and L1 [58]. As such, variability of trabecular microstructure within a vertebra may be a sufficiently sensitive parameter to detect small differences between vertebrae that are similar in their average microstructure.
The increase in VMCV and VMExp/σapp with increasing variability of the microstructure is consistent with previous findings that cancellous bone strength decreases with increasing VMCV [14] and vertebral strength decreases with increasing heterogeneity of bone mass [8, 29]. Together with the observation that increased microdamage content is associated with increased VMCV and VMExp/σapp in vertebral bone, the current results suggest that microstructural heterogeneity is a measure of stress concentration in cancellous bone. The effect of microstructural variability on VMCV seems more prominent than on VMExp/σapp, possibly due to the fact that VMExp/σapp is a ratio of volume averages whereas the stress variability is directly incorporated in VMCV. The results of our multiple regression analyses indicate that microstructural heterogeneity contributes to trabecular stress variability independently from the average of the same parameter and independently from a set of conventionally measured microstructural parameters. These results suggest that vertebral strength prediction would be improved when microstructural heterogeneity information is available.
Consideration must be given to qualities of bone other than uniaxial strength, however. The existing data indicate that bone heterogeneity can reflect additional aspects of vertebral failure such as structural ductility [60] and fatigue resistance [33]. Further, cellular materials with irregularly shaped and distributed cells like cancellous bone have higher creep rates than those with regular cells even if they are stiffer [2]. Similarly, analysis of the effect of random removal of struts within a foam on the creep rate indicates that removal of only a few percent of the struts can dramatically increase the creep rate by one to two orders of magnitude whereas the effect of uniform thinning is not as dramatic [23]. The differences we found in microstructural variability between genders, race and anatomic sites may manifest differences in the fatigue and/or creep behavior of bone between these populations. Nonetheless, due to the complex nature of in vivo fractures, it is important that clinical data are obtained to ultimately test the utility of bone heterogeneity in predicting fracture.
Some limitations outlined in our previous study also apply to the current study [59]. Briefly, voxel size used in the reconstruction of image volumes, homogeneous element properties used in the FE analyses, exclusion of vertebral regions other than the central anterior portion of the vertebral bodies and use of stereologic methods in calculation of microstructural parameters were identified as limitations. Slice-by-slice stereologic calculation of trabecular microstructure is subject to errors and will provide values that are different from those calculated by direct methods [9, 19]. However, dividing the sample volume in smaller regions of interest was necessary and the slice-by-slice approach provided a large number of data points from which distribution parameters could be calculated. It should be noted that BV/TV calculated from the slice-by-slice approach and that directly calculated by voxel counting had over 99% correlation (data not shown) in the current sample. This is consistent with a previous report that microstructural parameters calculated using direct methods are highly correlated to those calculated using a model-based method [9]. While microstructural heterogeneity has information content distinct from the average as well as from connectivity and anisotropy, its relationship with other microstructural properties such plate- vs rod-likeness of trabeculae remains to be elucidated. Also, consideration of the spatial distribution in addition to the statistical distribution properties of microstructure could provide further information on the nature of the heterogeneity [61]. This study was also limited to an investigation of the cancellous tissue from the anterior region. It is desirable to ultimately extend the results to the whole vertebrae. However, it is important to note that cancellous bone properties from the anterior region are strongly associated with whole vertebral strength [8, 28]. Thus, our study, while limited, is still very relevant to overall vertebral bone quality. The effect of modulus heterogeneity on finite element calculations of cancellous bone stiffness and stress distributions has been reported to be 6–20% [3, 40, 41]. However, the determination of mineralization distributions and modulus assignment based on micro-CT gray levels can be problematic due to artifacts inherent in the micro-CT scans [25] or due to lack of established relationships to accurately convert these values to modulus. Anatomic site, species and tissue processing differences could also result in a difference in the magnitude of this effect. It should also be pointed out that elastic moduli directly measured by nanoindentation had less variability than estimated by micro-CT gray levels and had little to no effect in FE calculation of apparent modulus of human vertebral bone in recent studies [7, 54]. Thus, these limitations are expected to have minor effects on our results but not affect our conclusions about cancellous tissue. In the end, the use of these conditions allows for direct comparisons between the current study and the previous ones that focused on average microstructural properties and trabecular stress variability [14, 22, 56, 57, 59].
The current study did not focus on the biological factors underlying microstructural heterogeneity, although mechanical loading might be expected to play a role. For example, it has been reported that low magnitude vibrations caused changes in the microstructure of trabecular bone which were associated with a reduced skewness of trabecular stresses and strains [24]. Previous work also suggested that status of the intervertebral disc and the end plate is associated with the regional microstructural and mechanical properties of cancellous bone [26], stress distributions within a vertebra [13, 32, 39] and the whole vertebral mechanical properties [39].
The causal nature of these associations currently needs further research
A notable observation was the considerable degree of high order interaction in the data set. We consider the results that were significant only within a sub-group of interacting parameters to be of secondary nature since high order interactions result in a reduced sample size. These findings should be confirmed by larger scale studies.
In conclusion, microstructural variability contributes to trabecular stress distribution and cancellous bone stiffness independent from average microstructure in human vertebral bone. Microstructural variability is anatomic site-, age-, gender- and race-dependent. Consideration of microstructural variability may provide insight into the understanding of bone fragility and improve assessment of vertebral fracture risk.
Research Highlights
-
>
Cancellous bone microstructural variability (MV), stiffness and stress distribution.
-
>
Relationship of MV with donor age, gender, race and, thoracic 12 and lumbar 1.
-
>
We used microcomputed tomography, finite element modeling and 3D stereology.
-
>
MV decreases bone stiffness, increases stress variability independently from average.
-
>
MV increases with age, is greater in females than in males and in T12 than in L1.
ACKNOWLEDGEMENTS
This project was supported, in part, by Grant Number AR049343 from the National Institutes of Health. Its contents are solely the responsibility of the authors and do not necessarily represent the official views of the NIH. We thank James Kimura, Ph.D., for helpful discussions.
Footnotes
Publisher's Disclaimer: This is a PDF file of an unedited manuscript that has been accepted for publication. As a service to our customers we are providing this early version of the manuscript. The manuscript will undergo copyediting, typesetting, and review of the resulting proof before it is published in its final citable form. Please note that during the production process errors may be discovered which could affect the content, and all legal disclaimers that apply to the journal pertain.
Note 2: This work was presented, in part, at 55th Annual Meeting, Orthopaedic Research Society, February 22–25, 2009, Las Vegas, Nevada.
REFERENCES
- [1].Aaron JE, Makins NB, Sagreiya K. The microanatomy of trabecular bone loss in normal aging men and women. Clin Orthop Relat Res. 1987:260–71. [PubMed] [Google Scholar]
- [2].Andrews EW, Gibson LJ. The role of cellular structure in creep of two-dimensional cellular solids. Materials Science and Engineering a-Structural Materials Properties Microstructure and Processing. 2001;303:120–126. [Google Scholar]
- [3].Bourne BC, van der Meulen MC. Finite element models predict cancellous apparent modulus when tissue modulus is scaled from specimen CT-attenuation. J Biomech. 2004;37:613–21. doi: 10.1016/j.jbiomech.2003.10.002. [DOI] [PubMed] [Google Scholar]
- [4].Bouxsein ML, Melton LJ, 3rd, Riggs BL, Muller J, Atkinson EJ, Oberg AL, Robb RA, Camp JJ, Rouleau PA, McCollough CH, Khosla S. Age- and sex-specific differences in the factor of risk for vertebral fracture: a population-based study using QCT. J Bone Miner Res. 2006;21:1475–82. doi: 10.1359/jbmr.060606. [DOI] [PubMed] [Google Scholar]
- [5].Box GEP, Cox DR. An Analysis of Transformations. JRSS. 1964;B26:211–43. [Google Scholar]
- [6].Chappard C, Marchadier A, Benhamou CL. Side-to-side and within-side variability of 3D bone microarchitecture by conventional micro-computed tomography of paired iliac crest biopsies. Bone. 2008;43:203–8. doi: 10.1016/j.bone.2008.02.019. [DOI] [PubMed] [Google Scholar]
- [7].Chevalier Y, Pahr D, Allmer H, Charlebois M, Zysset P. Validation of a voxel-based FE method for prediction of the uniaxial apparent modulus of human trabecular bone using macroscopic mechanical tests and nanoindentation. J Biomech. 2007;40:3333–40. doi: 10.1016/j.jbiomech.2007.05.004. [DOI] [PubMed] [Google Scholar]
- [8].Cody DD, Goldstein SA, Flynn MJ, Brown EB. Correlations between vertebral regional bone mineral density (rBMD) and whole bone fracture load. Spine (Phila Pa 1976) 1991;16:146–54. [PubMed] [Google Scholar]
- [9].Day JS, Ding M, Odgaard A, Sumner DR, Hvid I, Weinans H. Parallel plate model for trabecular bone exhibits volume fraction-dependent bias. Bone. 2000;27:715–20. doi: 10.1016/s8756-3282(00)00371-9. [DOI] [PubMed] [Google Scholar]
- [10].Dougherty G. Quantitative CT in the measurement of bone quantity and bone quality for assessing osteoporosis. Med Eng Phys. 1996;18:557–68. doi: 10.1016/1350-4533(96)00011-2. [DOI] [PubMed] [Google Scholar]
- [11].Duan Y, Seeman E, Turner CH. The biomechanical basis of vertebral body fragility in men and women. J Bone Miner Res. 2001;16:2276–83. doi: 10.1359/jbmr.2001.16.12.2276. [DOI] [PubMed] [Google Scholar]
- [12].Eckstein F, Fischbeck M, Kuhn V, Link TM, Priemel M, Lochmuller EM. Determinants and heterogeneity of mechanical competence throughout the thoracolumbar spine of elderly women and men. Bone. 2004;35:364–74. doi: 10.1016/j.bone.2004.04.008. [DOI] [PubMed] [Google Scholar]
- [13].Eswaran SK, Gupta A, Adams MF, Keaveny TM. Cortical and trabecular load sharing in the human vertebral body. J Bone Miner Res. 2006;21:307–14. doi: 10.1359/jbmr.2006.21.2.307. [DOI] [PubMed] [Google Scholar]
- [14].Fyhrie DP, Hoshaw SJ, Hamid MS, Hou FJ. Shear stress distribution in the trabeculae of human vertebral bone. Ann Biomed Eng. 2000;28:1194–1199. doi: 10.1114/1.1318928. [DOI] [PubMed] [Google Scholar]
- [15].Geraets WG, Van der Stelt PF, Lips P, Van Ginkel FC. The radiographic trabecular pattern of hips in patients with hip fractures and in elderly control subjects. Bone. 1998;22:165–73. doi: 10.1016/s8756-3282(97)00233-0. [DOI] [PubMed] [Google Scholar]
- [16].Gilsanz V, Skaggs DL, Kovanlikaya A, Sayre J, Loro ML, Kaufman F, Korenman SG. Differential effect of race on the axial and appendicular skeletons of children. Journal of Clinical Endocrinology & Metabolism. 1998;83:1420–7. doi: 10.1210/jcem.83.5.4765. [DOI] [PubMed] [Google Scholar]
- [17].Goulet RW, Goldstein SA, Ciarelli MJ, Kuhn JL, Brown MB, Feldkamp LA. The relationship between the structural and orthogonal compressive properties of trabecular bone. J Biomech. 1994;27:375–89. doi: 10.1016/0021-9290(94)90014-0. [DOI] [PubMed] [Google Scholar]
- [18].Han ZH, Palnitkar S, Rao DS, Nelson D, Parfitt AM. Effects of ethnicity and age or menopause on the remodeling and turnover of iliac bone: implications for mechanisms of bone loss. J Bone Miner Res. 1997;12:498–508. doi: 10.1359/jbmr.1997.12.4.498. [DOI] [PubMed] [Google Scholar]
- [19].Hildebrand T, Laib A, Muller R, Dequeker J, Ruegsegger P. Direct three-dimensional morphometric analysis of human cancellous bone: microstructural data from spine, femur, iliac crest, and calcaneus. J Bone Miner Res. 1999;14:1167–74. doi: 10.1359/jbmr.1999.14.7.1167. [DOI] [PubMed] [Google Scholar]
- [20].Hildebrand T, Ruegsegger P. A new method for the model independent assessment of thickness in three dimensional images. J Microsc. 1997;185:67–75. [Google Scholar]
- [21].Homminga J, Van-Rietbergen B, Lochmuller EM, Weinans H, Eckstein F, Huiskes R. The osteoporotic vertebral structure is well adapted to the loads of daily life, but not to infrequent “error” loads. Bone. 2004;34:510–6. doi: 10.1016/j.bone.2003.12.001. [DOI] [PubMed] [Google Scholar]
- [22].Hou FJ, Lang SM, Hoshaw SJ, Reimann DA, Fyhrie DP. Human vertebral body apparent and hard tissue stiffness. J Biomech. 1998;31:1009–15. doi: 10.1016/s0021-9290(98)00110-9. [DOI] [PubMed] [Google Scholar]
- [23].Huang JS, Gibson LJ. Creep of open-cell Voronoi foams. Materials Science and Engineering a-Structural Materials Properties Microstructure and Processing. 2003;339:220–226. [Google Scholar]
- [24].Judex S, Boyd S, Qin YX, Turner S, Ye K, Muller R, Rubin C. Adaptations of trabecular bone to low magnitude vibrations result in more uniform stress and strain under load. Ann Biomed Eng. 2003;31:12–20. doi: 10.1114/1.1535414. [DOI] [PubMed] [Google Scholar]
- [25].Kazakia GJ, Burghardt AJ, Cheung S, Majumdar S. Assessment of bone tissue mineralization by conventional x-ray microcomputed tomography: comparison with synchrotron radiation microcomputed tomography and ash measurements. Med Phys. 2008;35:3170–9. doi: 10.1118/1.2924210. [DOI] [PMC free article] [PubMed] [Google Scholar]
- [26].Keller TS, Hansson TH, Abram AC, Spengler DM, Panjabi MM. Regional variations in the compressive properties of lumbar vertebral trabeculae. Effects of disc degeneration. Spine (Phila Pa 1976) 1989;14:1012–9. doi: 10.1097/00007632-198909000-00016. [DOI] [PubMed] [Google Scholar]
- [27].Keller TS, Moeljanto E, Main JA, Spengler DM. Distribution and orientation of bone in the human lumbar vertebral centrum. J Spinal Disord. 1992;5:60–74. doi: 10.1097/00002517-199203000-00008. [DOI] [PubMed] [Google Scholar]
- [28].Kim D-G, Hunt CA, Zauel R, Fyhrie DP, Yeni YN. The Effect Of Regional Variations Of The Trabecular Bone Properties On The Compressive Strength Of Human Vertebral Bodies. 51st Annual Meeting, Orthopaedic Research Society; Washington, DC. 2005. p. 1271. [DOI] [PubMed] [Google Scholar]
- [29].Kim DG, Hunt CA, Zauel R, Fyhrie DP, Yeni YN. The Effect of Regional Variations of the Trabecular Bone Properties on the Compressive Strength of Human Vertebral Bodies. Ann Biomed Eng. 2007;35:1907–13. doi: 10.1007/s10439-007-9363-1. [DOI] [PubMed] [Google Scholar]
- [30].Kothari M, Keaveny TM, Lin JC, Newitt DC, Majumdar S. Measurement of intraspecimen variations in vertebral cancellous bone architecture. Bone. 1999;25:245–50. doi: 10.1016/s8756-3282(99)00161-1. [DOI] [PubMed] [Google Scholar]
- [31].Laib A, Newitt DC, Lu Y, Majumdar S. New model-independent measures of trabecular bone structure applied to in vivo high-resolution MR images. Osteoporos Int. 2002;13:130–6. doi: 10.1007/s001980200004. [DOI] [PubMed] [Google Scholar]
- [32].Langrana NA, Kale SP, Edwards WT, Lee CK, Kopacz KJ. Measurement and analyses of the effects of adjacent end plate curvatures on vertebral stresses. Spine J. 2006;6:267–78. doi: 10.1016/j.spinee.2005.09.008. [DOI] [PubMed] [Google Scholar]
- [33].McCubbrey DA, Cody DD, Peterson EL, Kuhn JL, Flynn MJ, Goldstein SA. Static and fatigue failure properties of thoracic and lumbar vertebral bodies and their relation to regional density. J Biomech. 1995;28:891–9. doi: 10.1016/0021-9290(94)00155-w. [DOI] [PubMed] [Google Scholar]
- [34].Melton LJ, 3rd, Christen D, Riggs BL, Achenbach SJ, Muller R, van Lenthe GH, Amin S, Atkinson EJ, Khosla S. Assessing forearm fracture risk in postmenopausal women. Osteoporos Int. 2010;21:1161–9. doi: 10.1007/s00198-009-1047-2. [DOI] [PMC free article] [PubMed] [Google Scholar]
- [35].Mosekilde L. Age-related changes in vertebral trabecular bone architecture--assessed by a new method. Bone. 1988;9:247–50. doi: 10.1016/8756-3282(88)90038-5. [DOI] [PubMed] [Google Scholar]
- [36].Mosekilde L. Sex differences in age-related loss of vertebral trabecular bone mass and structure--biomechanical consequences. Bone. 1989;10:425–32. doi: 10.1016/8756-3282(89)90074-4. [DOI] [PubMed] [Google Scholar]
- [37].Mosekilde L, Mosekilde L. Sex differences in age-related changes in vertebral body size, density and biomechanical competence in normal individuals. Bone. 1990;11:67–73. doi: 10.1016/8756-3282(90)90052-z. [DOI] [PubMed] [Google Scholar]
- [38].Mosekilde L, Viidik A, Mosekilde L. Correlation between the compressive strength of iliac and vertebral trabecular bone in normal individuals. Bone. 1985;6:291–5. doi: 10.1016/8756-3282(85)90317-5. [DOI] [PubMed] [Google Scholar]
- [39].Nekkanty S, Yerramshetty J, Kim DG, Zauel R, Johnson E, Cody DD, Yeni YN. Stiffness of the endplate boundary layer and endplate surface topography are associated with brittleness of human whole vertebral bodies. Bone. 2010;47:783–9. doi: 10.1016/j.bone.2010.07.001. [DOI] [PMC free article] [PubMed] [Google Scholar]
- [40].Renders GA, Mulder L, Langenbach GE, van Ruijven LJ, van Eijden TM. Biomechanical effect of mineral heterogeneity in trabecular bone. J Biomech. 2008;41:2793–8. doi: 10.1016/j.jbiomech.2008.07.009. [DOI] [PubMed] [Google Scholar]
- [41].Renders GA, Mulder L, van Ruijven LJ, Langenbach GE, van Eijden TM. Mineral heterogeneity affects predictions of intratrabecular stress and strain. J Biomech. 2011;44:402–7. doi: 10.1016/j.jbiomech.2010.10.004. [DOI] [PubMed] [Google Scholar]
- [42].Sankoh AJ, Huque MF, Dubey SD. Some comments on frequently used multiple endpoint adjustment methods in clinical trials. Stat Med. 1997;16:2529–42. doi: 10.1002/(sici)1097-0258(19971130)16:22<2529::aid-sim692>3.0.co;2-j. [DOI] [PubMed] [Google Scholar]
- [43].Schnitzler CM, Mesquita J. Bone marrow composition and bone microarchitecture and turnover in blacks and whites. Journal of Bone & Mineral Research. 1998;13:1300–7. doi: 10.1359/jbmr.1998.13.8.1300. [DOI] [PubMed] [Google Scholar]
- [44].Schnitzler CM, Pettifor JM, Mesquita JM, Bird MD, Schnaid E, Smyth AE. Histomorphometry of iliac crest bone in 346 normal black and white South African adults. Bone & Mineral. 1990;10:183–99. doi: 10.1016/0169-6009(90)90261-d. [DOI] [PubMed] [Google Scholar]
- [45].Silva MJ, Gibson LJ. The effects of non-periodic microstructure and defects on the compressive strength of two-dimensional cellular solids. Int. J. Mech. Sci. 1997;39:549–63. [Google Scholar]
- [46].Silva MJ, Gibson LJ. Modeling the mechanical behavior of vertebral trabecular bone: effects of age-related changes in microstructure. Bone. 1997;21:191–9. doi: 10.1016/s8756-3282(97)00100-2. [DOI] [PubMed] [Google Scholar]
- [47].Tanaka Y, Kokubun S, Sato T, Iwamoto M Sato. Trabecular domain factor and its influence on the strength of cancellous bone of the vertebral body. Calcif Tissue Int. 2001;69:287–92. doi: 10.1007/s002230010046. [DOI] [PubMed] [Google Scholar]
- [48].Thomsen JS, Ebbesen EN, Mosekilde L. Static histomorphometry of human iliac crest and vertebral trabecular bone: a comparative study. Bone. 2002;30:267–74. doi: 10.1016/s8756-3282(01)00666-4. [DOI] [PubMed] [Google Scholar]
- [49].Tracy JK, Meyer WA, Grigoryan M, Fan B, Flores RH, Genant HK, Resnik C, Hochberg MC. Racial differences in the prevalence of vertebral fractures in older men: the Baltimore Men's Osteoporosis Study. Osteoporosis International. 2006;17:99–104. doi: 10.1007/s00198-005-1919-z. [DOI] [PubMed] [Google Scholar]
- [50].van Lenthe GH, Huiskes R. How morphology predicts mechanical properties of trabecular structures depends on intra-specimen trabecular thickness variations. J Biomech. 2002;35:1191–7. doi: 10.1016/s0021-9290(02)00081-7. [DOI] [PubMed] [Google Scholar]
- [51].Weaver JK, Chalmers J. Cancellous bone: its strength and changes with aging and an evaluation of some methods for measuring its mineral content. J Bone Joint Surg Am. 1966;48:289–98. [PubMed] [Google Scholar]
- [52].Weinans H. Is osteoporosis a matter of over-adaptation? Technol Health Care. 1998;6:299–306. [PubMed] [Google Scholar]
- [53].Weinstein RS, Bell NH. Diminished rates of bone formation in normal black adults. New England Journal of Medicine. 1988;319:1698–701. doi: 10.1056/NEJM198812293192603. [DOI] [PubMed] [Google Scholar]
- [54].Wolfram U, Wilke HJ, Zysset PK. Valid micro finite element models of vertebral trabecular bone can be obtained using tissue properties measured with nanoindentation under wet conditions. J Biomech. 43:1731–7. doi: 10.1016/j.jbiomech.2010.02.026. [DOI] [PubMed] [Google Scholar]
- [55].Yeh OC, Keaveny TM. Biomechanical effects of intraspecimen variations in trabecular architecture: a three-dimensional finite element study. Bone. 1999;25:223–8. doi: 10.1016/s8756-3282(99)00092-7. [DOI] [PubMed] [Google Scholar]
- [56].Yeni YN, Hou FJ, Ciarelli T, Vashishth D, Fyhrie DP. Trabecular shear stresses predict in vivo linear microcrack density but not diffuse damage in human vertebral cancellous bone. Ann Biomed Eng. 2003;31:726–32. doi: 10.1114/1.1569264. [DOI] [PubMed] [Google Scholar]
- [57].Yeni YN, Hou FJ, Vashishth D, Fyhrie DP. Trabecular shear stress in human vertebral cancellous bone: intra- and inter-individual variations. J Biomech. 2001;34:1341–1346. doi: 10.1016/s0021-9290(01)00089-6. [DOI] [PubMed] [Google Scholar]
- [58].Yeni YN, Kim DG, Divine GW, Johnson EM, Cody DD. Human cancellous bone from T12-L1 vertebrae has unique microstructural and trabecular shear stress properties. Bone. 2009;44:130–6. doi: 10.1016/j.bone.2008.09.002. [DOI] [PMC free article] [PubMed] [Google Scholar]
- [59].Yeni YN, Zelman EA, Divine GW, Kim DG, Fyhrie DP. Trabecular shear stress amplification and variability in human vertebral cancellous bone: Relationship with age, gender, spine level and trabecular architecture. Bone. 2008;42:591–6. doi: 10.1016/j.bone.2007.11.011. [DOI] [PMC free article] [PubMed] [Google Scholar]
- [60].Yerramshetty J, Kim DG, Yeni YN. Increased Microstructural Variability is Associated With Decreased Structural Strength But With Increased Measures of Structural Ductility in Human Vertebrae. J Biomech Eng. 2009;131:1–5. doi: 10.1115/1.3148473. 094501_. [DOI] [PMC free article] [PubMed] [Google Scholar]
- [61].Zhu M, Keller TS, Moeljanto E, Spengler DM. Multiplanar variations in the structural characteristics of cancellous bone. Bone. 1994;15:251–9. doi: 10.1016/8756-3282(94)90286-0. [DOI] [PubMed] [Google Scholar]


