

Abstract
Diffusion tensor imaging (DTI) has been widely used in studying rodent models of white matter diseases. In this study, we examined the differences between in vivo and ex vivo fractional anisotropy (FA) and diffusivity measurements in the mouse cuprizone model. In the control mouse corpus callosum (CC), ex vivo diffusivities were significantly lower than in vivo measurements, but ex vivo FA values were not significantly different from in vivo FA values. With cuprizone induced demyelination and accompanying pathology in the CC, changes in in vivo and ex vivo FA and diffusivity measurements were not always in agreement. Our results suggest that ex vivo λ⊥ was a more reliable indicator of white matter demyelination than in vivo λ⊥ and in vivo λ∥ was a more reliable indicator of axonal injury than ex vivo λ∥ in this model. When comparing in vivo and ex vivo DTI results of axon and myelin pathology in the rodent models, potential changes in tissue microstructures associated with perfusion fixation should be considered.
INTRODUCTION
Diffusion tensor imaging (DTI) (1-3) is an important tool for studying white matter pathology in multiple sclerosis (MS) and other neurological diseases. By measuring the extent of water molecule diffusion along multiple axes and fitting the measurements into a tensor model , DTI can generate several endogenous measures that are useful for studying the anatomy and structural integrity of white matter structures (4). For example, apparent diffusion coefficient (ADC) and fractional anisotropy (FA) have been widely used to detect a variety of white matter injuries (5-7). Several recent reports on DTI of animal models further demonstrated that parallel diffusivity (λ∥, also called axial diffusivity), which measures the extent of water diffusion along axons, was sensitive to axonal injury, and perpendicular diffusivity (λ⊥, also called radial diffusivity), which measures the extent of water diffusion perpendicular to axons, was sensitive to myelin injury in these models (8,9). Significant correlations between DTI based measurements and histology based measurements of axon and myelin pathology have also been reported in several animal models (10,11). These reports clearly demonstrate the potential of DTI in detecting and monitoring white matter pathology in the clinic as well as in basic research.
Both in vivo and ex vivo DTI have been used for studying axon and myelin pathology in animal models. In vivo DTI allows longitudinal monitoring of the same animals, and its signals reflect the structural properties of axon and myelin in live animals. In vivo DTI, however, has limited imaging resolution and is susceptible to subject motion. Ex vivo DTI, on the other hand, allows higher imaging resolution than in vivo DTI, and is free of motion artifacts. One unresolved issue is whether in vivo and ex vivo DTI are comparable in detecting white matter pathology. It has been shown that fixation can alter the ratio of intra-cellular and extra-cellular spaces and membrane permeability (12). These changes will likely result in differences between DTI signals measured before and after fixation, which can make it challenging to infer in vivo tissue micro-structural properties based solely on ex vivo DTI signals. Several groups have compared in vivo and aldehyde fixed ex vivo DTI data and reported that while diffusivity values in ex vivo neuronal tissues were significantly reduced compared to live animals, diffusion anisotropy in normal white matter structures remained unchanged after fixation (13-16). It, however, remains unclear whether this is true for white matter structures under pathological conditions.
In this study, we used the mouse cuprizone model (17) to examine the differences between in vivo and ex vivo DTI measurements of demyelinating lesions. In this model, the caudal corpus callosum of cuprizone treated mice develops profound demyelination, and reliable remyelination can be observed once a normal diet is resumed (17,18). We have compared DTI data from the same animals before and after perfusion fixation with 4% paraformaldehyde (PFA) at several pathological milestones in this model.
METHODS
Animals and Specimen Preparation
All experimental procedures were approved by the Animal Use and Care Committee at the Johns Hopkins University School of Medicine. Adult C57BL/6 mice (two month old, female) were separated into a control group and four cuprizone treated groups with 5 mice in each group (Table 1). In vivo MR images of the control mice (0 week time point) were acquired from mice kept on a normal diet. Mice in the cuprizone treated groups were placed on a regimen of 6 week 0.2% cuprizone enriched diet followed by normal diet for an additional 2-6 weeks to allow remyelination. In vivo MR images of cuprizone treated mice were acquired after 2, 4, and 6 weeks of cuprizone diet (n = 5 at each time point), or after 6 weeks of cuprizone diet plus 2, 4, and 6 weeks of normal diet (n = 5 at each time point for the 8, 10, and 12 week time points,), as shown in Table 1. The control and cuprizone treated mice were fixed by trans-cardiac perfusion of 4% PFA in phosphate buffered saline (PBS) after in vivo MRI at the 0, 4, 6, 8, and 12 week time points for ex vivo MRI and histology. An additional five mice were perfusion fixed after 6 weeks of cuprizone diet and 3 weeks of normal diet (the 9 week time points). After fixation, mouse heads were removed and immersed in 4% PFA in PBS for 12 hours at 4°C before being transferred to PBS. The specimens were then kept in PBS (50 ml for each specimen and weekly changes into fresh PBS) for 2 -3 weeks at 4°C to wash out residual fixatives, which reduce tissue T2 and the signal-to-noise ratio of the acquired images (12). Before ex vivo MRI, specimens were placed into custom-built, MR-compatible tubes. The tubes were filled with Fomblin (Fomblin Profludropolyether, Ausimont, Thorofare, New Jersey, USA), which is a MR invisible liquid for susceptibility matching and can also prevent dehydration (19,20).
Table 1.
The timeline of cuprizone treatment and in vivo MRI (n = 5 at each time point).
| Groups (n = 5 for each group) | Cuprizone diet | Normal diet | |||||
|---|---|---|---|---|---|---|---|
| 0 weeks | 2 weeks | 4 weeks | 6 weeks | 8 weeks | 10 weeks | 12 weeks | |
| 1 (control) | MRI | ||||||
| 2 | MRI | ||||||
| 3 | MRI | ||||||
| 4 | MRI | ||||||
| 5 | MRI | MRI | MRI | ||||
In vivo MRI
In vivo three dimensional (3D) mouse brain MRI was performed on a 9.4 Tesla NMR spectrometer (Bruker Biospin, Billerica, MA, USA) equipped with a Micro2.5 gradient system (100 G/cm maximum gradient strength), a manufacturer-provided animal imaging probe, and a physiological monitoring system (EKG, respiration, and body temperature). During imaging, mice were anesthetized with isoflurane (1%) in an oxygen-air mixture (1:3 ratio) via a vaporizer. Images were acquired using a 20 mm diameter volume coil as the radiofrequency transmitter and receiver. For DTI, a recently developed 3D diffusion weighted gradient and spin echo (GRASE) sequence (21) was used with the following parameters: echo time (TE) of 32 ms, repetition time (TR) of 800 ms, bandwidth of 100 kHz, and 2 signal averages. The field of view and matrix size were 15.0 mm × 15.0 mm × 15.0 mm and 128 × 120 × 40, and the native resolution was 117 × 125 × 375 μm3. Two non diffusion-weighted and six diffusion weighted images (b-value 1000 s/mm2) were acquired with δ = 3 ms and Δ = 15 ms. The total imaging time was approximately 2.2 hours with respiratory gating. The signal-to-noise ratios in the corpus callosum measured in the non diffusion weighted images were greater than 20 for all experiments. High resolution 2D axial T2-weighted images were acquired using the multiple slice RARE sequence with TE of 40 ms, TR of 2000 ms, 4 signal averages, echo train length of 4, the same field of view as the DTI data, native resolution of 100 × 100 × 300 μm3, and total imaging time of 20 minutes. Multiple echo axial T2-weighted images for calculating T2 maps were acquired with TEs of 10/20/30/40/50/60 ms, TR of 2000 ms, 4 signal averages, using the same field of view as the DTI data, native resolution of 117 × 117 × 600 μm3, and total imaging time of 20 minutes. The T2-weighted images were resampled to the same resolution as the 3D DTI dataset by tri-linear interpolation. T2 map was obtained via Log-linear fitting. Magnetization transfer images (Mt) were also acquired using the multiple slice RARE sequence with TE of 10 ms, TR of 6500 ms, 2 signal averages, echo train length of 4, and a native resolution of 117 × 117 × 600 μm3. A 3 second block pulse with a power of 2.5 μT and an offset frequency of -6 kHz from water was used as the saturation pulse. Because of the long saturation pulse, only two axial images, capturing the genu and splenium of the corpus callosum, were acquired. Co-registered axial images with no saturation pulse (M0) were also acquired, and maps of magnetization transfer ratio (MTR) were calculated using the expression MTR = 1-Mt/M0.
Ex vivo MRI
DTI of postmortem specimens was also performed on the 9.4 Tesla NMR spectrometer using a 15 mm diameter volume coil as the radiofrequency transmitter and receiver. Diffusion tensor data were acquired using the diffusion weighted 3D GRASE sequence with the following parameters: TE of 33 ms, TR of 900 ms, bandwidth of 100 kHz, and 4 signal averages. The imaging field of view and matrix size were 13.0 mm × 10.0 mm × 18.4 mm and 128 × 96 × 180 respectively, and the native resolution was approximately 100 × 100 × 100 μm3. The spectral data were apodized by a symmetric trapezoidal function with 10% ramp widths on either side of the trapezoid and zero-filled before Fourier transformation. For DTI, six diffusion weighted images (b-value 1700 s/mm2) and two non diffusion-weighted images were acquired with δ = 3 ms, Δ = 15 ms. The total imaging time was 11 hours. The signal-to-noise ratios in the corpus callosum measured in the non diffusion weighted images were greater than 40 for all experiments.
Image Processing
For both in vivo and ex vivo results, average diffusion-weighted image (aDW) was obtained by taking the mean value for each pixel using the six diffusion-weighted images. Signals from skull tissues in the aDW images were manually removed. Total brain volumes (from the rostral end of the nose bulbs to the caudal end of the cerebellum) were obtained from these skull-stripped images by multiplying the size of each voxel by the number of voxels in the brain. Diffusion tensors were calculated using a log-linear fitting method . Fractional anisotropy (FA), primary eigenvector (v1), λ∥(the primary eigenvalue), and λ⊥ (the average of the secondary and tertiary eigenvalues) were calculated on a voxel-by-voxel basis from the diffusion tensor using DTIStudio (http://www.mristudio.org) (22). The in vivo and ex vivo aDW images were first rigidly aligned to our in vivo and ex vivo MRI based atlases , respectively, using the six-parameter rigid registration function in the automated image registration (AIR) package (23,24). Average in vivo and ex vivo T2-weighted, aDW, and FA images of the control mouse brains were obtained following the procedure described in using large deformation diffeomorphic metric mapping (LDDMM) , which uses the tissue contrasts in aDW and FA images to ensure good alignment of both overall brain shape and internal white matter structures. These images were used as the template images in the following procedures.
Mappings between individual subject images at every time point and template images were obtained using a dual channel (aDW+FA) LDDMM (Fig.1A). The derived mappings were then applied to the T2, FA, diffusivity, and high resolution T2-weighted images, from which averaged T2-weighted, T2 map, FA, λ∥ and λ⊥ images were generated at each time points. The mapping between the in vivo and ex vivo baseline template images were also obtained using dual channel (aDW+FA) LDDMM. At each time point, the tensor data were also normalized and averaged. The orientation of each tensor was aligned using the methods described by Xu et al. (25). Colormap images were generated by combining the primary eigenvector and FA map, both calculated from the average tensor data, into RGB images. In the colormap image, red indicates that the primary orientation of water diffusion is along the left-right axis, green for the rostral-caudal axis, and blue for the dorsal-ventral axis.
FIG. 1.
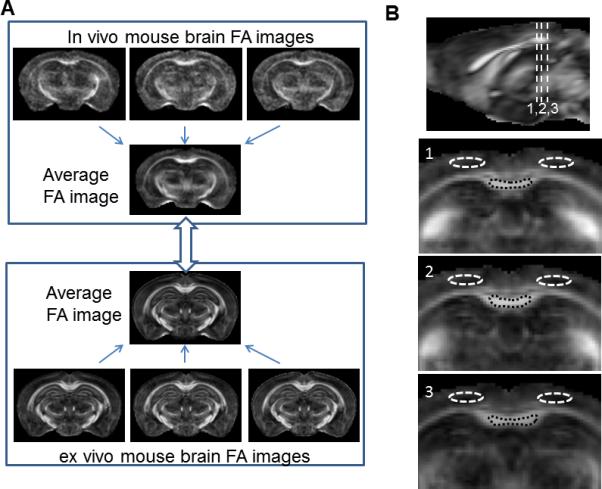
Normalization of in vivo and ex vivo mouse brain images and definitions of regions of interest (ROIs) for the caudal corpus callosum and neighboring cerebral cortex. a: In vivo and ex vivo average baseline (0 week) mouse brain images were generated from multiple subject images using dual contrast (aDW+FA) LDDMM. b: three dimensional ROIs for the caudal corpus callosum and cortical regions above the corpus callosum were manually defined in the in vivo average baseline FA image, as shown at the three coronal levels in the figure.
Three dimensional regions of interest (ROIs) were manually placed in the in vivo FA template image (Fig. 1B), one for the caudal corpus callosum and the other for the cortical region above the corpus callosum. The two ROIs were then applied to the in vivo images from individual subject co-registered to the in vivo template using LDDMM. Using the mapping between the in vivo and ex vivo baseline template images, the ROIs were transformed and applied to the ex vivo images from individual subjects co-registered to the ex vivo baseline template, with minor adjustments made to the ROIs to ensure the ROIs agree with tissue boundaries in the normalized ex vivo images. The mean T2, FA, and diffusivity values in each ROI were obtained. For the MTR images, ROIs for the caudal CC and cortical regions were manually placed in individual images because they were not aligned to the templates.
Statistical Analysis
Differences in T2, MTR, FA, and diffusivity values between the baseline (0 week) and other time points were tested in the two ROIs using the nonparametric Wilcoxon test. Potential changes in total brain volume due to perfusion fixation were tested using the paired Student's t-test, and potential differences in brain volume between baseline and other time points were tested using the Student's t-test. All statistical tests were performed using IDL (ITT Visual Information Solutions, Inc., www.ittvis.com) with p < 0.05 (after corrections for multiple comparisons) as the threshold for statistical significance. For the normalized in vivo λ⊥ images, a Z score with respect to the baseline data was computed at each pixel in the corpus callosum as
Where x and y denote data from two time points, one of which is the 0 week time point, Nx and Ny are the numbers of subject, and Wx is the rank sum of the data collected at the 0 week time point.
Immunohistochemistry
Following MR imaging, brains were dissected out of the skull. With the aid of a brain matrix, the brains were cut coronally at the approximate level of the lesion (between the base of the optic nerve and the mammillary bodies). These were embedded together such that the flat cut surface of both halves of the brain would serve as the cutting face of the tissue block. This tissue was then processed for paraffin embedding by routine procedures. Seven micron thick sections were cut and stained for myelin (Luxol Fast Blue, CNPase), axon markers (SMI-32 for hypo-phosphorylated neurofilament , and amyloid pre-cursor protein (APP)), and neuroinflammatory markers (iba-1 for activated microglia). For immunohistochemistry, tissue preparation and staining were performed as described in (26). Images of the caudal corpus callosum were acquired at 10x using a BX41 microscope equipped with a DP70 camera (Olympus).
RESULTS
In vivo T2 and MT imaging of demyelination and remyelination in the corpus callosum of cuprizone treated mice
In vivo T2 and MT MRI can readily be used to detect demyelination and remyelination in the caudal corpus callosum (CC) (Fig. 2). At the 4, 6, and 8 week time points, both T2 and MTR values in the caudal CC were significantly different from the baseline level (week 0). Both values returned to the baseline level after the 10 week time point (6 week cuprizone diet + 4 week normal diet). The increase in T2 in the caudal CC was especially obvious at the 4 week time point. The neighboring cortical region showed no significant change in T2 and MTR values over time. Histology of the same animals (Fig. 3) revealed pathology in the caudal CC as described in previous reports (17,27). Both LFB and CNPase stained histological images showed complete demyelination in the caudal CC at the 4 and 6 week time points. Iba-1 and APP stained images showed activation of microglia and accumulation of APP, which indicate the presence of tissue inflammation and abnormal axonal fast transport, respectively, in the caudal CC mostly at the 4 week time point.
FIG. 2.
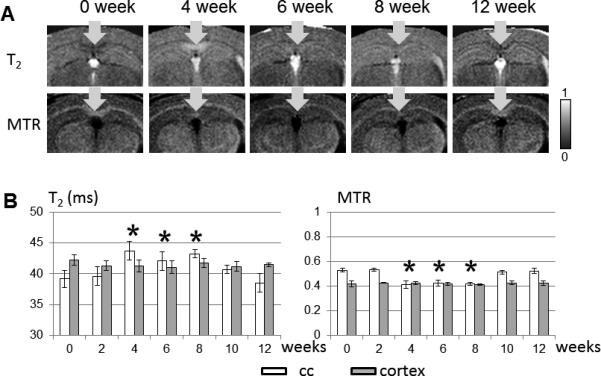
In vivo single subject coronal T2-weighted and MTR images of the caudal corpus callosum (a) and T2 and MTR values of the caudal corpus callosum and cortical ROIs over time (b). * indicates that a value is significant different from the baseline value (0 week) with p < 0.05 after correction for multiple comparison. The error bars show the standard deviations of the measurements (n=5 at each time point).
FIG. 3.
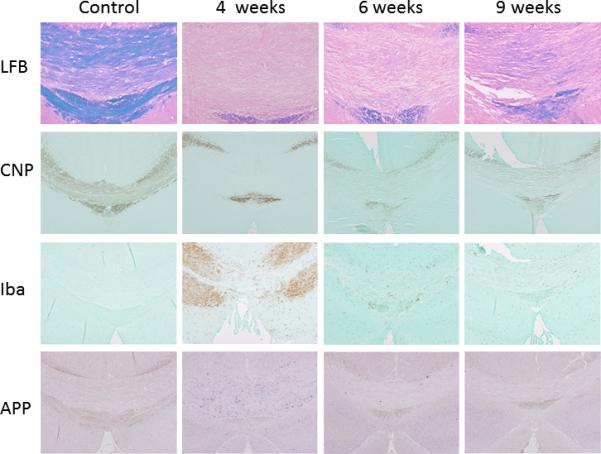
Luxol Fast Blue (LFB), CNPase (CNP), Iba-1 (Iba), and APP stained histological images of caudal mouse corpus callosum at baseline and the 4, 6, and 9 week time points.
In vivo and ex vivo diffusion tensor images of cuprizone induced demyelination and remyelination in the caudal corpus callosum
Using LDDMM, in vivo and ex vivo mouse brain images collected at various time points were normalized to their respective control templates (Figs. 4 and 5). In the control mouse brain (0 week), there was no significant difference between in vivo and ex vivo FA values measured in the caudal CC, but both λ∥ and λ⊥ decreased significantly in the ex vivo samples from their in vivo values (Table 2). From 4 to 8 weeks, ex vivo FA values in the caudal CC declined significantly from the 0 week value (Table 2), which can be appreciated in the average ex vivo FA images (Fig. 5), whereas in vivo FA values in the same period decreased slightly from the 0 week level, not significantly different from the baseline FA value. Ex vivo λ∥ and λ⊥ measured in the normal caudal CC decreased to approximately 40% of the in vivo values (Fig. 6B-C and Table 2). At the 4 week time point, in vivo λ∥ value of the caudal CC decreased significantly (~24% decrease with respect to the baseline, Table 2), whereas ex vivo λ∥ values in the caudal CC showed no significant change from the baseline. From 6 to 8 weeks, in vivo λ⊥ in the caudal CC increased significantly (up to 60% increase with respect to the baseline value, Table 2). Ex vivo λ⊥ in the caudal CC also increased significantly at the 4, 6, and 8 week time points (up to 100% increase with respect to the baseline value, Table 2). A significant difference between in vivo and ex vivo FA values was detected at the 6 week time point (Table 2, after correction for multiple comparisons). No significant correlation was found between λ⊥ measured in vivo and ex vivo (Fig. 6D) in the cuprizone treated animals at 4 to 8 week time points. At the 12 week time point, in vivo and ex vivo FA and diffusivity values in the remyelinated caucal CC (17) returned to their baseline levels (0 week), and there was no significant difference between in vivo and ex vivo FA values (Table 2). Total brain volumes measured ex vivo were slightly larger (≤3%, p < 0.0001) than in vivo brain volumes, while no significant difference in brain volume, either in vivo or ex vivo, was found between the 0 week and the 4, 6, 8, and 12 week time points (Table 2).
FIG. 4.
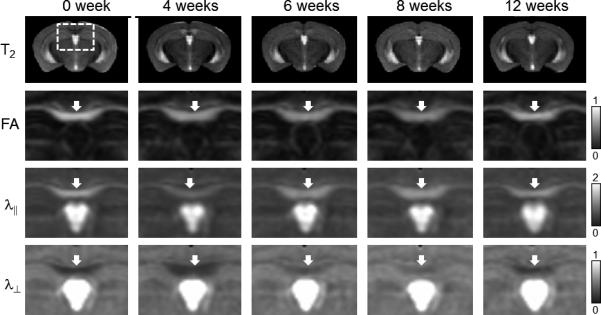
Average in vivo T2, FA, λ∥, and λ⊥ images of the cuprizone treated mouse brains. Coronal images are shown in the figure. White arrows indicate the locations of the caudal corpus callosum. The unit for the λ∥ and λ⊥ are x10-3 mm2/s.
FIG. 5.
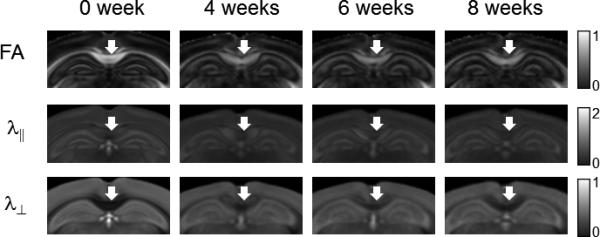
Average ex vivo FA, λ∥, and λ⊥ images of the cuprizone treated mouse brains. Coronal images are shown in the figure. White arrows indicate the locations of the caudal corpus callosum. The unit for the λ∥ and λ⊥ are x10-3 mm2/s.
Table 2.
FA, parallel diffusivity (λ∥), and perpendicular diffusivity (λ⊥) measured in the caudal corpus callosum of cuprizone treated mice and the standard deviations of the measurements at several time points using in vivo and ex vivo DTI.
| Time (weeks) | in vivo DTI (% change w.r.t. baseline) | ex vivo DTI (% change w.r.t. baseline) | ||||||
|---|---|---|---|---|---|---|---|---|
| Brain volume (mm3) | FA | λ∥ (×10-3 mm2/s) | λ⊥ (×10-3 mm2/s) | Brain volume (mm3) | FA | λ∥ (×10-3 mm2/s) | λ⊥ (×10-3 mm2/s) | |
| 0 (baseline) | 431.3 ± 13.3 | 0.65 ± 0.10 | 1.14 ± 0.08 | 0.32 ± 0.08 | 445.0 ± 7.1 | 0.66 ± 0.03 | 0.45 ± 0.12† | 0.13 ± 0.03† |
| 4 | 422.2 ± 3.6 | 0.57 ± 0.13 (90%) | 0.87 ± 0.19* (76%) | 0.37 ± 0.15 (116%) | 438.1 ± 10.2 | 0.43 ± 0.02* (65%) | 0.49 ± 0.05† (101%) | 0.24 ± 0.03*† (184%) |
| 6 | 426.3 ± 13.8 | 0.55 ± 0.04 (87%) | 1.10 ± 0.09 (96%) | 0.46 ± 0.06* (144%) | 439.0 ± 8.4 | 0.40 ± 0.02*† (61%) | 0.48 ± 0.05† (107%) | 0.26 ± 0.03*† (200%) |
| 8 | 435.8 ± 5.6 | 0.53 ± 0.09 (84%) | 1.20 ± 0.09 (105%) | 0.52 ± 0.06* (162%) | 442.6 ± 9.2 | 0.44 ± 0.03* (66%) | 0.42 ± 0.02† (93%) | 0.20 ± 0.02*† (154%) |
| 12 | 429.9 ± 15.1 | 0.58 ± 0.04 (89%) | 1.06 ± 0.11 (93%) | 0.39 ± 0.07 (122%) | 433.3 ± 12.9 | 0.66 ± 0.03 (100%) | 0.50 ± 0.06† (111%) | 0.16± 0.03† (123%) |
indicates the value is significant different from the baseline value (p < 0.05)
indicates the ex vivo measurement is significant different from corresponding in vivo measurement.
FIG. 6.
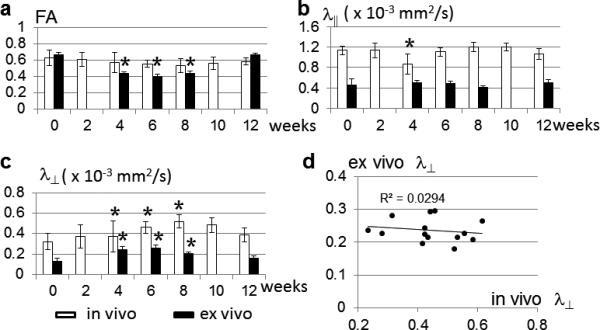
a-c: In vivo and ex vivo FA, λ∥, and λ⊥ measured in the caudal corpus callosum at several time points. * indicates significant difference from the baseline values (0 week) with p < 0.05 after correction for multiple comparison. The error bars show the standard deviations of the measurements (n=5 at each time point). d: There is no significant correlation between perpendicular diffusivities measured in vivo and ex vivo in this model.
Mapping in vivo and ex vivo diffusion tensor images of the mouse brain
With the normalized 3D data, the spatial and temporal patterns of signal changes in the CC were examined in the mid-sagittal average FA and colormap images (Fig. 7A). In both in vivo and ex vivo average colormap images, the primary orientation of water diffusion in the CC, estimated using DTI, remained along the left-right axis (red in the colormap images) over time. The accuracy of LDDMM is demonstrated by overlaying the boundary of the mid-sagittal CC defined in the baseline average images (0 week) on the average in vivo images at the 4 and 6 week time points. While the mapping of in vivo DTI data appeared accurate, mapping of ex vivo images showed small mismatches in the shape of CC between average ex vivo images at baseline and later time points (Fig. 7A). The mismatches were likely caused by changes in ex vivo FA values in the CC. Because of these mismatches, the ROIs for the CC, which were initially defined in the in vivo average FA images and transformed to the ex vivo average FA images by LDDMM, were carefully inspected and modified to fit the caudal CC in the ex vivo images at each time point. The color-coded Z score in the CC showed that increases in λ⊥ were most apparent in the caudal part of the CC between 6 and 8 weeks (indicated by the white arrows in Fig. 7B), and gradually returned to baseline afterwards. This pattern agreed with the rostrocaudal gradient of demyelination in the corpus callosum as indicated by LFB staining of the mouse corpus callosum at 6 weeks after cuprizone treatment (Fig. 7C).
FIG. 7.
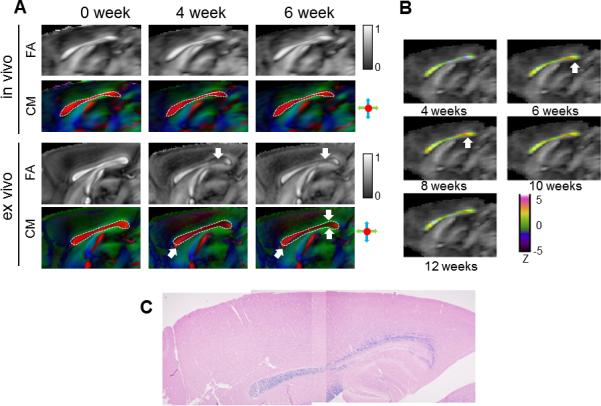
a: Average in vivo and ex vivo FA and colormap (CM) images of cuprizone treated mouse brains at baseline, 4 and 6 week time points. The images were from the mid-sagittal plane. In both the in vivo and ex vivo images, the boundary of the corpus callosum in the mid-sagittal plane was delineated in the 0 week average CM images and overlaid on CM images at the 4 and 6 week time points. White arrows indicate the reduced FA in the ex vivo FA images at the 4 and 6 week time points and shape mismatches in the ex vivo images between baseline and later time points. b: Average in vivo FA images overlaid with Z scores of λ⊥ in the corpus callosum from the 4 to 12 week time points. In the pseudo-colored images, red and orange indicate increases in λ⊥, blue and purple indicate decrease in λ⊥, and green indicate no apparent change in λ⊥, with respect to the baseline level. c: LBF stained stained histological image of mid-sagittal corpus callosum at the 6 week time point.
DISCUSSIONS
The cuprizone model has been well characterized as a model to study demyelination and remyelination in the brain (17,28,29). Previous histological studies have shown that extensive death of oligodendrocytes can be found at 1 week after exposure to cuprizone, and profound demyelination (90%) can be consistently observed at 4-5 weeks after the start of a cuprizone diet (18). Partial remyelination can be observed in 50% of the axons at 6 weeks. If switched back to a normal diet at 6 weeks after the start of cuprizone diet, 90% of the axons are remyelinated by the 10th week. Several studies (27,29) and the iba-1 immunohistochemistry presented in this study showed evidence of tissue inflammation, e.g. activation of microglia, as well as vasogenic edema (30,31) near the caudal CC, mostly at the 4 week time point. The relatively high reproducibility of the cuprizone model makes it well suited for studying the mechanisms of demyelination and remyelination in the brain and testing new treatments.
Using MRI to monitor axon and myelin pathology in the cuprizone model has been reported before. In this study, the temporal changes of T2 and MTR in the caudal CC (Fig. 2) agree with existing reports on demyelination and remyelination in the cuprizone mouse model (32,33). The presence of inflammation and edema may explain the strongly enhanced T2 signals at 4 weeks, which declined to a moderately enhanced level at the 6 and 8 week time points, while MTR remains relatively stable from 4 to 8 weeks (Fig. 2). Both in vivo and ex vivo DTI had been used to characterize the cuprizone model. Ex vivo DTI revealed significantly decreased diffusion anisotropy and increased λ⊥ in the demyelinated corpus callosum in this model (34). In comparison, in vivo DTI, in a separate study of the same model, showed significantly increased λ⊥ but no apparent change in diffusion anisotropy (35). The normalization of ex vivo FA and λ⊥ to their baseline levels at the 12 week time point in the mostly remyelinated caudal CC (17), has been described before (34) and indicates that ex vivo DTI is sensitive to remyelination in this model. The difference between in vivo and ex vivo diffusion anisotropy in the cuprizone model is intriguing and may help us to better define the capability of in vivo and ex vivo DTI in detecting and monitoring demyelination and remyelination. In order to quantify the difference, in vivo and ex vivo data were collected from the same group of animals, using the same pulse sequence and similar parameters, albeit at different b values and resolutions, to ensure proper comparisons of the two.
Significant reduction in ex vivo diffusivity compared to in vivo data has been reported before in the normal mouse brain (13,36). Potential factors contributing to this reduction include changes in tissue temperature and micro-structural properties, e.g., decreased extra-cellular space and increased membrane permeability, caused by cell death and chemical fixation (12). In this study, ex vivo DTI was performed with specimen temperature maintained at 37 °C to minimize the influences of temperature. The ex vivo λ∥ and λ⊥ values in the normal CC obtained here (0.45 × 10⁻³ mm2/s and 0.13 × 10⁻³ mm2/s, respectively) were indeed higher than values in a previous report (0.28 × 10⁻³ mm2/s and 0.10 × 10⁻³ mm2/s, respectively) measured at room temperature (~21 °C) (34), but still significantly lower than in vivo measurements (1.14 × 10⁻³ mm2/s and 0.32 × 10⁻³ mm2/s, respectively). Because the λ∥ and λ⊥ in normal CC were reduced by similar percentages in the perfusion fixed specimens, in vivo and ex vivo FA values of the normal CC showed no significant difference, as previously reported by Sun et al.(13). The results suggest that temperature change can only account for a fraction of the difference and microstructural changes associated with fixation may play a crucial role here. The exact microstructural changes that lead to the reduction of ex vivo diffusivity, however, remain unknown.
Our study confirmed that in vivo and ex vivo FA values in the demyelinated corpus callosum were significantly different (Table 2, the 6 week time point). The difference between in vivo and ex vivo FA values at the 6 week time point was mainly due to the dramatic increase in ex vivo λ⊥ (~ 100% with respect to the baseline value) compared to the moderate increase in in vivo λ⊥ (~44% with respect to the baseline value), whereas both in vivo and ex vivo λ⊥ stayed at the baseline level (Table 2). The dramatic increase in ex vivo λ⊥ might reflect the combined effects of demyelination and increased membrane permeability after PFA fixation, because an increase in the permeability of the axon membrane, which is one of the remaining barriers to water diffusion perpendicular to the axons (37) in the demyelinated caudal CC, will likely result in an increase in λ⊥. The normalization of ex vivo FA at the 12 week time point to its corresponding in vivo FA values also supports the notion that the integrity of myelin is important for preserving diffusion anisotropy in PFA fixed mouse brain white matter structures at its level seen in vivo. More interestingly, the results at the 4 week time point showed conflicting changes in in vivo and ex vivo λ∥ and λ⊥ measurements. The major pathological events at this time point include severe loss of myelin, inflammation, vasogenic edema, and abnormalities in axon morphology and functions but no significant loss of axon (27,34,35). While it is relatively straightforward to ascribe the decreased in vivo λ∥ at the 4 week time point to axon pathology, such as axonal swelling and beading (27), and the increased ex vivo λ⊥ at the 6 week time point to demyelination, it is difficult to explain why ex vivo λ∥ and in vivo λ⊥ failed to capture the same pathology at the 4 week time point. One possibility is that the presence of inflammation and edema reduced the sensitivity of in vivo λ⊥ to myelin loss, as activated microglia and astrocytes might form barriers to water diffusion and suppress potential increases in in vivo λ⊥. The change in membrane permeability after PFA fixation may also explain the unchanged ex vivo λ∥ at the 4 week time point, as the increased membrane permeability might have reduced the restrictive effects of axon pathology on ex vivo λ∥ compared to in vivo λ∥.
In this study, the ex vivo specimens were perfusion fixed with 4% PFA for 12 hours and then immersed in PBS. Immersion in PBS increases tissue T2 and SNR of the diffusion MRI results (12). It is known that different fixatives and fixation protocols may change tissue microstructure differently and therefore likely to alter the outcomes of diffusion MRI (12,38). While previous reports showed that fixatives cause tissue shrinkage (39,40), we found small but significant increases in total brain volumes, probably reflect an increase in tissue water content as a result of the relatively long immersion in PBS. Future studies on the effects of different fixation protocols on tissue microstructure and diffusion MRI signals are necessary.
This study also touched on one technical issue regarding mapping based analysis of brain images. With 3D data and advanced image mapping tools, multiple MR contrast images in this study were normalized to common baseline template images, which allowed relatively consistent placement of ROIs and voxel based examination of the spatial and temporal profiles of changes in MR signals in the CC. However, it is necessary to note that image mapping tools have their limitations. In this study, in vivo and ex vivo images were normalized to the templates using dual channel (aDW+FA) LDDMM, which constructs mappings based on whole brain contrast presented in the aDW images and white matter contrast in the FA images. While normalization of the in vivo images appeared accurate, normalization of the ex vivo images of mice with severe demyelination in the CC was not, mainly due to the changes in FA in the CC with respect to normal mouse brains. We therefore had to adjust the ROIs in the normalized ex vivo images to fit their designated structures. While this limitation prevented voxel based analysis on the ex vivo data, the location of the ROIs should remain relatively consistent between different time points and between in vivo and ex vivo data.
In summary, the results suggest that PFA fixation can significantly alter tissue microstructure and diffusion MR measurements and affect their capability to detect white matter pathology. Because most histological measurements are obtained from chemically fixed post-mortem specimen and DTI is sensitive to changes in tissue microstructure, either due to pathology or fixation, it is necessary to consider the differences between in vivo and ex vivo DTI measurements, which may vary with underlying pathological conditions even in the relatively simple mouse cuprizone model. Our results suggest that, in the cuprizone model, ex vivo λ⊥ is a more reliable indicator of demyelination than in vivo λ⊥, while in vivo λ∥ is a more reliable indicator of axonal injury than ex vivo λ∥.
Acknowledgments
This study was supported by National Institutes of Health NS070909, NS059529, NS065306, AG20012, EB003543, ES012665, and NMSS Collaborative Center Award, NMSS TR-3760-A-3
REFERENCES
- 1.Basser PJ, Mattiello J, LeBihan D. MR diffusion tensor spectroscopy and imaging. Biophys J. 1994;66(1):259–267. doi: 10.1016/S0006-3495(94)80775-1. [DOI] [PMC free article] [PubMed] [Google Scholar]
- 2.Le Bihan D. Looking into the functional architecture of the brain with diffusion MRI. Nat Rev Neurosci. 2003;4(6):469–480. doi: 10.1038/nrn1119. [DOI] [PubMed] [Google Scholar]
- 3.Mori S, Zhang J. Principles of diffusion tensor imaging and its applications to basic neuroscience research. Neuron. 2006;51(5):527–539. doi: 10.1016/j.neuron.2006.08.012. [DOI] [PubMed] [Google Scholar]
- 4.Basser P, Pierpaoli C. Microstructural and physiological features of tissues elucidated by quantitative-dfifusion-tensor MRI. J Magn Reson B. 1996;111:209–219. doi: 10.1006/jmrb.1996.0086. [DOI] [PubMed] [Google Scholar]
- 5.Neil J, Miller J, Mukherjee P, Huppi PS. Diffusion tensor imaging of normal and injured developing human brain - a technical review. NMR Biomed. 2002;15(7-8):543–552. doi: 10.1002/nbm.784. [DOI] [PubMed] [Google Scholar]
- 6.Pierpaoli C, Barnett A, Pajevic S, Chen R, Penix LR, Virta A, Basser P. Water diffusion changes in Wallerian degeneration and their dependence on white matter architecture. Neuroimage. 2001;13(6 Pt 1):1174–1185. doi: 10.1006/nimg.2001.0765. [DOI] [PubMed] [Google Scholar]
- 7.Horsfield MA, Jones DK. Applications of diffusion-weighted and diffusion tensor MRI to white matter diseases - a review. NMR Biomed. 2002;15(7-8):570–577. doi: 10.1002/nbm.787. [DOI] [PubMed] [Google Scholar]
- 8.Song SK, Sun SW, Ramsbottom MJ, Chang C, Russell J, Cross AH. Dysmyelination revealed through MRI as increased radial (but unchanged axial) diffusion of water. Neuroimage. 2002;17(3):1429–1436. doi: 10.1006/nimg.2002.1267. [DOI] [PubMed] [Google Scholar]
- 9.Song SK, Sun SW, Ju WK, Lin SJ, Cross AH, Neufeld AH. Diffusion tensor imaging detects and differentiates axon and myelin degeneration in mouse optic nerve after retinal ischemia. Neuroimage. 2003;20(3):1714–1722. doi: 10.1016/j.neuroimage.2003.07.005. [DOI] [PubMed] [Google Scholar]
- 10.Budde MD, Xie M, Cross AH, Song SK. Axial diffusivity is the primary correlate of axonal injury in the experimental autoimmune encephalomyelitis spinal cord: a quantitative pixelwise analysis. J Neurosci. 2009;29(9):2805–2813. doi: 10.1523/JNEUROSCI.4605-08.2009. [DOI] [PMC free article] [PubMed] [Google Scholar]
- 11.DeBoy CA, Zhang J, Dike S, Shats I, Jones M, Reich DS, Mori S, Nguyen T, Rothstein B, Miller RH, Griffin JT, Kerr DA, Calabresi PA. High resolution diffusion tensor imaging of axonal damage in focal inflammatory and demyelinating lesions in rat spinal cord. Brain. 2007;130(Pt 8):2199–2210. doi: 10.1093/brain/awm122. [DOI] [PubMed] [Google Scholar]
- 12.Shepherd TM, Thelwall PE, Stanisz GJ, Blackband SJ. Aldehyde fixative solutions alter the water relaxation and diffusion properties of nervous tissue. Magn Reson Med. 2009;62(1):26–34. doi: 10.1002/mrm.21977. [DOI] [PMC free article] [PubMed] [Google Scholar]
- 13.Sun SW, Neil JJ, Song SK. Relative indices of water diffusion anisotropy are equivalent in live and formalin-fixed mouse brains. Magn Reson Med. 2003;50(4):743–748. doi: 10.1002/mrm.10605. [DOI] [PubMed] [Google Scholar]
- 14.Pattany PM, Puckett WR, Klose KJ, Quencer RM, Bunge RP, Kasuboski L, Weaver RG. High-resolution diffusion-weighted MR of fresh and fixed cat spinal cords: evaluation of diffusion coefficients and anisotropy. AJNR Am J Neuroradiol. 1997;18(6):1049–1056. [PMC free article] [PubMed] [Google Scholar]
- 15.D'Arceuil HE, Westmoreland S, de Crespigny AJ. An approach to high resolution diffusion tensor imaging in fixed primate brain. Neuroimage. 2007;35(2):553–565. doi: 10.1016/j.neuroimage.2006.12.028. [DOI] [PubMed] [Google Scholar]
- 16.Guilfoyle DN, Helpern JA, Lim KO. Diffusion tensor imaging in fixed brain tissue at 7.0 T. NMR Biomed. 2003;16(2):77–81. doi: 10.1002/nbm.814. [DOI] [PubMed] [Google Scholar]
- 17.Matsushima GK, Morell P. The neurotoxicant, cuprizone, as a model to study demyelination and remyelination in the central nervous system. Brain Pathol. 2001;11(1):107–116. doi: 10.1111/j.1750-3639.2001.tb00385.x. [DOI] [PMC free article] [PubMed] [Google Scholar]
- 18.Stidworthy MF, Genoud S, Suter U, Mantei N, Franklin RJ. Quantifying the early stages of remyelination following cuprizone-induced demyelination. Brain Pathol. 2003;13(3):329–339. doi: 10.1111/j.1750-3639.2003.tb00032.x. [DOI] [PMC free article] [PubMed] [Google Scholar]
- 19.Smith BR, Huff DS, Johnson GA. Magnetic resonance imaging of embryos: an Internet resource for the study of embryonic development. Comput Med Imaging Graph. 1999;23(1):33–40. doi: 10.1016/s0895-6111(98)00061-5. [DOI] [PubMed] [Google Scholar]
- 20.Benveniste H, Blackband S. MR microscopy and high resolution small animal MRI: applications in neuroscience research. Prog Neurobiol. 2002;67(5):393–420. doi: 10.1016/s0301-0082(02)00020-5. [DOI] [PubMed] [Google Scholar]
- 21.Aggarwal M, Mori S, Shimogori T, Blackshaw S, Zhang J. Three-dimensional diffusion tensor microimaging for anatomical characterization of the mouse brain. Magn Reson Med. 2010;64(1):249–261. doi: 10.1002/mrm.22426. [DOI] [PMC free article] [PubMed] [Google Scholar]
- 22.Jiang H, van Zijl PC, Kim J, Pearlson GD, Mori S. DtiStudio: resource program for diffusion tensor computation and fiber bundle tracking. Comput Methods Programs Biomed. 2006;81(2):106–116. doi: 10.1016/j.cmpb.2005.08.004. [DOI] [PubMed] [Google Scholar]
- 23.Woods RP, Grafton ST, Holmes CJ, Cherry SR, Mazziotta JC. Automated image registration: I. General methods and intrasubject, intramodality validation. J Comput Assist Tomogr. 1998;22(1):139–152. doi: 10.1097/00004728-199801000-00027. [DOI] [PubMed] [Google Scholar]
- 24.Woods RP, Grafton ST, Watson JD, Sicotte NL, Mazziotta JC. Automated image registration: II. Intersubject validation of linear and nonlinear models. J Comput Assist Tomogr. 1998;22(1):153–165. doi: 10.1097/00004728-199801000-00028. [DOI] [PubMed] [Google Scholar]
- 25.Xu D, Mori S, Shen D, van Zijl PC, Davatzikos C. Spatial normalization of diffusion tensor fields. Magn Reson Med. 2003;50(1):175–182. doi: 10.1002/mrm.10489. [DOI] [PubMed] [Google Scholar]
- 26.Zhang J, Jones M, DeBoy CA, Reich DS, Farrell JA, Hoffman PN, Griffin JW, Sheikh KA, Miller MI, Mori S, Calabresi PA. Diffusion tensor magnetic resonance imaging of Wallerian degeneration in rat spinal cord after dorsal root axotomy. J Neurosci. 2009;29(10):3160–3171. doi: 10.1523/JNEUROSCI.3941-08.2009. [DOI] [PMC free article] [PubMed] [Google Scholar]
- 27.Xie M, Tobin JE, Budde MD, Chen CI, Trinkaus K, Cross AH, McDaniel DP, Song SK, Armstrong RC. Rostrocaudal Analysis of Corpus Callosum Demyelination and Axon Damage Across Disease Stages Refines Diffusion Tensor Imaging Correlations With Pathological Features. J Neuropathol Exp Neurol. 2010;69(7):704–716. doi: 10.1097/NEN.0b013e3181e3de90. [DOI] [PMC free article] [PubMed] [Google Scholar]
- 28.Kipp M, Clarner T, Dang J, Copray S, Beyer C. The cuprizone animal model: new insights into an old story. Acta Neuropathol. 2009;118(6):723–736. doi: 10.1007/s00401-009-0591-3. [DOI] [PubMed] [Google Scholar]
- 29.Liu L, Belkadi A, Darnall L, Hu T, Drescher C, Cotleur AC, Padovani-Claudio D, He T, Choi K, Lane TE, Miller RH, Ransohoff RM. CXCR2-positive neutrophils are essential for cuprizone-induced demyelination: relevance to multiple sclerosis. Nat Neurosci. 2010;13(3):319–326. doi: 10.1038/nn.2491. [DOI] [PMC free article] [PubMed] [Google Scholar]
- 30.Carlton WW. Studies on the induction of hydrocephalus and spongy degeneration by cuprizone feeding and attempts to antidote the toxicity. Life Sci. 1967;6(1):11–19. doi: 10.1016/0024-3205(67)90356-6. [DOI] [PubMed] [Google Scholar]
- 31.Harsan LA, Steibel J, Zaremba A, Agin A, Sapin R, Poulet P, Guignard B, Parizel N, Grucker D, Boehm N, Miller RH, Ghandour MS. Recovery from chronic demyelination by thyroid hormone therapy: myelinogenesis induction and assessment by diffusion tensor magnetic resonance imaging. J Neurosci. 2008;28(52):14189–14201. doi: 10.1523/JNEUROSCI.4453-08.2008. [DOI] [PMC free article] [PubMed] [Google Scholar]
- 32.Merkler D, Boretius S, Stadelmann C, Ernsting T, Michaelis T, Frahm J, Bruck W. Multicontrast MRI of remyelination in the central nervous system. NMR Biomed. 2005;18(6):395–403. doi: 10.1002/nbm.972. [DOI] [PubMed] [Google Scholar]
- 33.Zaaraoui W, Deloire M, Merle M, Girard C, Raffard G, Biran M, Inglese M, Petry KG, Gonen O, Brochet B, Franconi JM, Dousset V. Monitoring demyelination and remyelination by magnetization transfer imaging in the mouse brain at 9.4 T. MAGMA. 2008;21(5):357–362. doi: 10.1007/s10334-008-0141-3. [DOI] [PMC free article] [PubMed] [Google Scholar]
- 34.Song SK, Yoshino J, Le TQ, Lin SJ, Sun SW, Cross AH, Armstrong RC. Demyelination increases radial diffusivity in corpus callosum of mouse brain. Neuroimage. 2005;26(1):132–140. doi: 10.1016/j.neuroimage.2005.01.028. [DOI] [PubMed] [Google Scholar]
- 35.Sun SW, Liang HF, Trinkaus K, Cross AH, Armstrong RC, Song SK. Noninvasive detection of cuprizone induced axonal damage and demyelination in the mouse corpus callosum. Magn Reson Med. 2006;55(2):302–308. doi: 10.1002/mrm.20774. [DOI] [PubMed] [Google Scholar]
- 36.Sun SW, Neil JJ, Liang HF, He YY, Schmidt RE, Hsu CY, Song SK. Formalin fixation alters water diffusion coefficient magnitude but not anisotropy in infarcted brain. Magn Reson Med. 2005;53(6):1447–1451. doi: 10.1002/mrm.20488. [DOI] [PubMed] [Google Scholar]
- 37.Beaulieu C. The basis of anisotropic water diffusion in the nervous system - a technical review. NMR Biomed. 2002;15(7-8):435–455. doi: 10.1002/nbm.782. [DOI] [PubMed] [Google Scholar]
- 38.Shepherd TM, Flint JJ, Thelwall PE, Stanisz GJ, Mareci TH, Yachnis AT, Blackband SJ. Postmortem interval alters the water relaxation and diffusion properties of rat nervous tissue--implications for MRI studies of human autopsy samples. Neuroimage. 2009;44(3):820–826. doi: 10.1016/j.neuroimage.2008.09.054. [DOI] [PMC free article] [PubMed] [Google Scholar]
- 39.Boonstra H, Oosterhuis JW, Oosterhuis AM, Fleuren GJ. Cervical tissue shrinkage by formaldehyde fixation, paraffin wax embedding, section cutting and mounting. Virchows Arch A Pathol Anat Histopathol. 1983;402(2):195–201. doi: 10.1007/BF00695061. [DOI] [PubMed] [Google Scholar]
- 40.Quester R, Schroder R. The shrinkage of the human brain stem during formalin fixation and embedding in paraffin. J Neurosci Methods. 1997;75(1):81–89. doi: 10.1016/s0165-0270(97)00050-2. [DOI] [PubMed] [Google Scholar]