Abstract
Purpose
We previously developed and validated the Cancer of the Prostate Risk Assessment (CAPRA) score to predict prostate cancer recurrence based on pre-treatment clinical data. We aimed to develop a similar post-surgical score with improved accuracy via incorporation of pathologic data.
Methods
We analyzed 3837 prostatectomy patients in the CaPSURE national disease registry. Cox regression was used to determine the predictive power of preoperative prostate specific antigen (PSA), pathologic Gleason score (pGS), surgical margins (SM), extracapsular extension (ECE), seminal vesicle invasion (SVI), and lymph node invasion (LNI). Points were assigned based on the relative weights of these variables in predicting recurrence. The new post-surgical score (CAPRA-S) was tested and compared to a commonly-cited nomogram with proportional hazards analysis, the concordance (c) index, calibration plots, and decision-curve analysis.
Results
16.8% of the men recurred; actuarial progression-free probability at 5 years was 78.0%. The CAPRA-S was determined by adding up to three points for PSA, up to three for pGS, one point each for ECE and LNI, and two points each for SM and SVI. The hazard ratio for each point increase in CAPRA-S score was 1.54 (95% CI 1.49–1.59), indicating a 2.4-fold increase in risk for each two point increase in score. The CAPRA-S c-index was 0.77, substantially higher than 0.66 for the pre-treatment CAPRA score and comparable to 0.76 for the nomogram. The CAPRA-S score performed better in both calibration and decision curve analyses.
Conclusions
The CAPRA-S offers good discriminatory accuracy, calibration, and ease of calculation for clinical and research settings.
Introduction
An estimated 217,730 men will be diagnosed with prostate cancer in the United States in 2010, a figure accounting for 28% of all male cancer diagnoses. 32,050 deaths are anticipated, representing the second highest mortality burden of all cancers among men, but a comparatively small figure relative to the number of diagnoses.1 Risk assessment of prostate cancer is therefore essential, to identify both those men at high risk of cancer mortality who require aggressive, often multimodal, therapy, and those who are at relatively low risk and might be spared the potential impact of therapy on quality of life.
We have previously developed the UCSF Cancer of the Prostate Risk Assessment (CAPRA), a pre-treatment score based on patient age, prostate specific antigen (PSA), biopsy Gleason score, clinical T stage, and percent of biopsy cores positive.2 The CAPRA score predicts risk of cancer recurrence with accuracy as least as good as other pre-treatment risk prediction instruments,3, 4 yet can be calculated easily, without need for paper tables or computer software. The CAPRA score has been externally validated in US3, 5 and European4, 6 multi-institutional studies, with accuracy ranging from 0.66 to 0.81 and higher accuracy generally seen in academic compared to community-based cohorts). More recently, the score was demonstrated to predict recurrence with rapid PSA doubling time7 and was the first shown to predict metastasis, cancer-specific mortality, and all-cause mortality from time of diagnosis across multiple treatment modalities.8 Moreover, it outperforms competing nomograms in terms of calibration and decision curve analysis.4, 9 A similar instrument intended for patients receiving primary androgen deprivation therapy has been published recently.10
Three of the variables defining the CAPRA score, like other pre-treatment instruments11 —biopsy Gleason score, clinical T stage, and percent of biopsy cores positive—are by nature approximations and may therefore under- or over-estimate true grade and extent of cancer. An advantage therefore offered by radical prostatectomy is that additional prognostic information may be gleaned from the pathologic Gleason score (pGS), surgical margin (SM) status, and presence or absence of extracapsular extension (ECE), seminal vesicle invasion (SVI), and/or lymph node involvement (LNI). These additional data have proved helpful in previously reported risk instruments.11, 12 We aimed to develop a postoperative analog to the CAPRA score which would incorporate these variables and improve the accuracy of the prediction, without sacrificing the overall simplicity of the scoring system.
Patients and Methods
Analytic dataset and definition of variables
The Cancer of the Prostate Strategic Urologic Research Endeavor (CaPSURE™) is a national disease registry accruing men with biopsy-proven prostate adenocarcinoma, recruited from 40 urology practices, primarily community-based, across the United States. Informed consent is obtained from each patient under institutional review board supervision. Patients are treated according to their physicians’ usual practices, and are followed until time of death or withdrawal from the study. Additional details have been reported previously.13, 14 Eligibility for inclusion in the study was limited to men with prostate cancer diagnosed since 1992 who underwent prostatectomy as primary treatment and had at least six months of followup recorded in the registry. Those with clinically advanced disease (>cT3aN0M0) pre-operatively were ineligible, as were those had received neoadjuvant or adjuvant hormonal and/or radiation.
Detailed reporting of staging variables (ECE, SVI, SM) is variable among pathology reports accessioned to CaPSURE. In the main analysis, ECE, SVI, or SM reported as “unable to assess” were assumed to be negative; in a sensitivity analysis, cases without complete data for all variables were dropped. To examine whether cases with missing pathologic data (ECE, SVI, SM) differed from cases with complete data, we compared these groups with respect to their distributions of the original preoperative CAPRA score using a Wilcoxon rank-sum statistic. In all cases, patients with no lymphadenectomy performed were assumed to have negative LNI. Patients missing pathologic Gleason score and/or preoperative PSA were excluded.
The definition of biochemical recurrence was either 2 consecutive PSA values over 0.2 ng/ml15 or any secondary treatment at least six months following surgery (treatment within six months was assumed to be adjuvant). Men not experiencing recurrence—including those dying of other causes—were censored at date of the last available PSA.
Building the CAPRA post-Surgical (CAPRA-S) score
Our goal was to develop an instrument which would reflect the additional accuracy yielded by the pathologic data while preserving the straightforward and intuitive 0–10 scoring structure of the CAPRA score, with each predictor weighted by easy-to-recall integers, such that the possible scores would cover a broad range of recurrence risk. Candidate predictor variables were fit into a multivariable Cox proportional hazards regression model predicting likelihood of recurrence. Preoperative PSA and pGS were coded via 3 binary indicators contrasting low, medium, and high levels with very low risk levels, with cut-points similar to those used to define the CAPRA score (see Table 1). SM, ECE, SVI, and LNI were all dichotomous. All candidate variables were statistically significant independent predictors, so all were retained in the model.
Table 1.
Results of Cox proportional hazards analysis of variables considered for postoperative CAPRA-S score, illustrating number (N) of patients at each level, the regression coefficient (β) and hazard ratio (HR) for recurrence, given with the standard error (SE) and 95% confidence interval (95% CI) for the HR.
| N (%) | β | HR | (95% CI) | P | |
|---|---|---|---|---|---|
| PSA ≤6 ng/ml | 2152 (56.1) | ref | |||
| PSA 6.01–10 ng/ml | 1087 (27.3) | 0.40 | 1.49 | (1.22–1.82) | |
| PSA 10.01–20 ng/ml | 470 (12.2) | 1.06 | 2.87 | (2.33–3.54) | |
| PSA >20 ng/ml | 128 (3.3) | 1.32 | 3.72 | (2.83–4.90) | <0.001 |
|
| |||||
| pGS 2–6 | 2141 (55.8) | ref | |||
| pGS 3+4 | 1161 (30.3) | 0.37 | 1.44 | (1.19–1.75) | |
| pGS 4+3 | 298 (7.8) | 0.74 | 2.09 | (1.62–2.69) | |
| pGS 8–10 | 237 (6.2) | 1.21 | 3.35 | (2.64–4.24) | <0.001 |
|
| |||||
| SM+ (vs SM−) | 1032 (26.9) | 0.85 | 2.35 | (2.00–2.76) | <0.001 |
|
| |||||
| ECE (vs no ECE) | 538 (14.0) | 0.40 | 1.49 | (1.24–1.80) | <0.001 |
|
| |||||
| SVI (vs no SVI) | 180 (4.7) | 0.83 | 2.30 | (1.83–2.89) | <0.001 |
|
| |||||
| LNI (vs no LNI) | 23 (0.6) | 0.54 | 1.72 | (1.06–2.75) | 0.027 |
pGS = pathologic Gleason sum, ECE = extracapsular extension, SVI = seminal vesicle invasion, LNI = lymph node invasion, SM+/− = surgical margin positive/negative.
The log hazard ratio parameter (β) estimates generated by the model were used to determine each indicator’s points to be assigned toward the new CAPRA post-Surgical (CAPRA-S) score, with points assigned per increment of β such that a 0–10 score would be obtained. Taking a similar approach as with the original CAPRA score 5, we achieved this goal by dividing each β by 0.45 and rounding to the nearest integer. Using the same thresholds as the original CAPRA score, the CAPRA-S score was also categorized in three groups at low (CAPRA-S 0–2), intermediate (CAPRA-S 3–5), and high (CAPRA-S ≥6) risk of recurrence.5 We illustrated the relationships with progression-free probability of the continuous and grouped CAPRA-S score using Kaplan-Meier plots.
The new CAPRA-S instrument’s predictive accuracy was first assessed via Cox analysis. The assumption of proportionality was examined via plots of the complementary log-log hazard and Schoenfeld residuals versus time, both of which demonstrated essentially parallel lines; a LOWESS smoothed mean drawn through the latter plot was horizontal. Confidence intervals (CIs) for the model were calculated with bootstrap correction. As a sensitivity analysis, the model was rerun with SM, ECE, and SVI data points labeled “unable to assess” considered missing rather than negative. As a measure of the variability of the score across its range, hazard ratios were estimated made between each adjacent pair of CAPRA-S scores (1 vs 0, 2 vs 1, etc.).
Given the possibility of overfitting in evaluating the new score’s performance, a ten-fold cross-validated dataset was created to determine Kaplan-Meier estimates and 95% CI of the observed estimate of 5-year progression-free probability. To evaluate model discrimination, Harrell’s c-index was calculated for the CAPRA-S score as a continuous variable, as was a bootstrap-corrected estimate of the c-index in a sample of 100 datasets drawn with replacement from the original set. The latter is a nearly unbiased estimate of the external predictive discrimination.16 As a comparison, the c-index was also calculated for the postoperative nomogram published by Stephenson et al.12
Model calibration at 5 years’ follow-up was examined graphically by plotting Kaplan-Meier estimates in the cross-validated dataset versus the model-predicted estimate for each level of the CAPRA-S score, with CIs based on the standard error of the log cumulative hazard. Calibration was also assessed via the Hosmer-Lemeshow chi-squared statistic on 5 degrees of freedom, after combining levels ≥7 of the CAPRA-S score so that at least 20 patients remained at risk in each level. This statistic is calculated by summing over CAPRA-S levels the squared differences between the observed and predicted progression-free probabilities, divided by the predicted estimates. Predicted and observed 5-year PGP estimates from the postoperative nomogram were also plotted. Finally, decision curve analysis was used to compare the nomogram to the CAPRA-S score, based on progression-free survival analysis at 5 years using the cross-validated dataset.17
In addition to prediction of progression, the ability of the continuous CAPRA-S score to predict prostate cancer-specific mortality was assessed via competing risks regression.18 Cause of death in CaPSURE is ascertained from review of death certificates and annual query to the National Death Index.8
Results
A total of 5507 men participating in CaPSURE and diagnosed since 1992 underwent radical prostatectomy. Thirty men were excluded for clinically advanced disease (T3b or N1) preoperatively, 554 for receiving neoadjuvant or adjuvant therapy, 345 for missing pGS or preoperative PSA, and 741 for less than 6 months of followup after surgery; 3837 men thus constituted the main analytic dataset. Those 686 (17.8%) men with ECE, SVI, and/or SM reported as “unable to assess” were not statistically different from the 3151 (82.2%) not missing these data in terms of preoperative CAPRA score (p=0.52).
Overall, 644 (16.8%) men undergoing prostatectomy recurred by PSA (N=478) or second treatment (N=166) criteria. Among men recurring, failures occurred at a mean ± standard deviation (SD) of 29 ± 24 and median of 23 months after surgery, and patients not failing were censored at a mean ± SD of 44 ± 29 and median of 37 months. A total of 1843 and 795 men, respectively, were at risk at 3 and 5 years; the 3- and 5-year actuarial progression-free probability rates for the whole cohort were 85.1% (95% CI 83.8–86.3) and 78.0% (76.2–80.0).
Table 1 summarizes the results of the model used to build the CAPRA-S score. All variables included in the model were statistically significant predictors of biochemical recurrence according to likelihood ratio statistics. Based on the log-hazard ratio parameter estimates from the model, up to three points may be assigned based on preoperative PSA, up three points for pGS, one point each for ECE and LNI, and two points each for SM+ and SVI (figure 1). Although the maximum score theoretical score is therefore 12, there were only seven men with CAPRA-S scores of 10, four with scores of 11, and none with scores of 12. For this reason scores over 9 were combined to a “CAPRA-S ≥9” category. The CAPRA-S score distribution is given in table 2.
Figure 1.
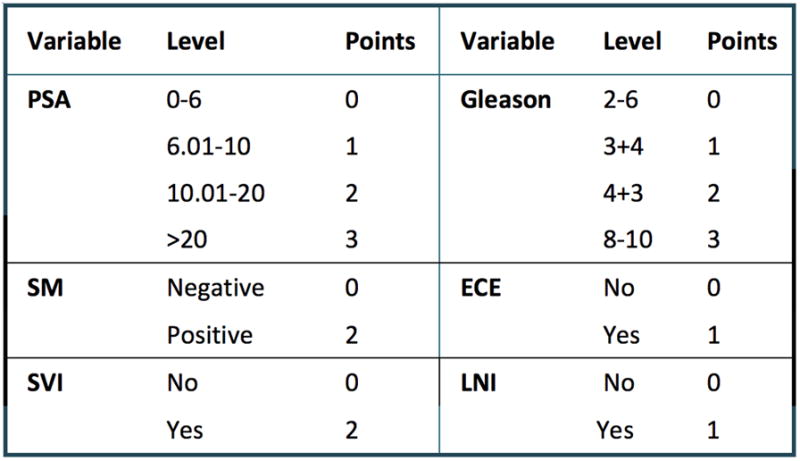
The CAPRA-S score. Points are assigned for each variable: up to 3 for prostate specific antigen (PSA) level in ng/ml, up to 3 for pathologic Gleason score, 2 each for positive surgical margin (SM) and seminal vesicle invasion (SVI), and 1 each for extracapsular extension (ECE) and lymph node invasion (LNI). Points are summed to yield the CAPRA-S score.
Table 2.
Results of survival analysis of CAPRA-S score, both as a continuous and a categorized variable, illustrating number (N) and % of patients at each score, and the hazard ratio (HR) for progression given with the bootstrap-corrected 95% confidence interval (95%CI) for the HR. Comparisons are given at each CAPRA-S score level relative to CAPRA-S 0 and relative to the prior score (i.e. CAPRA-S 1 vs 0, 2 vs 1, etc.). Actuarial progression-free probability at each score level at 3 and 5 years is given with 95% CI. NS = not significant.
| CAPRA-S | N (%) | Comparison to CAPRA-S 0 | Comparison to prior level | Progression-free probability (95% CI) | |||
|---|---|---|---|---|---|---|---|
| HR (95% CI) | P | HR (95% CI) | P | 3-year | 5-year | ||
| (continuous) | 3787 | 1.54 (1.50–1.59) | <0.001 | ||||
|
| |||||||
| 0 | 1042 (27.2) | ref | 96.3 (94.8 97.4) | 94.5 (92.3 96.1) | |||
| 1 | 826 (21.5) | 1.59 (1.06–2.39) | 0.024 | 1.59 (1.06–2.38) | 0.024 | 95.3 (93.2 96.7) | 91.0 (87.7 93.4) |
| 2 | 669 (17.4) | 3.39 (2.34–4.90) | <0.001 | 2.12 (1.54–2.94) | <0.001 | 89.8 (86.9 92.1) | 83.3 (79.2 86.6) |
|
| |||||||
| 3 | 499 (13.0) | 6.01 (4.18–8.63) | <0.001 | 1.77 (1.35–2.33) | <0.001 | 80.7 (76.5 84.3) | 72.8 (67.5 77.3) |
| 4 | 336 (8.8) | 6.77 (4.57–10.0) | <0.001 | 1.13 (0.84–1.51) | NS | 74.9 (69.3 79.6) | 70.2 (63.9 75.5) |
| 5 | 213 (5.6) | 13.0 (9.01–18.8) | <0.001 | 1.92 (1.43–2.58) | <0.001 | 63.1 (55.5 69.8) | 42.5 (33.4 51.3) |
|
| |||||||
| 6 | 103 (2.7) | 18.9 (12.7–28.0) | <0.001 | 1.45 (1.06–1.98) | 0.023 | 49.2 (38.3 59.2) | 25.9 (16.0 36.9) |
| 7 | 70 (1.8) | 19.5 (12.5–30.5) | <0.001 | 1.03 (0.67–1.59) | NS | 50.9 (37.5 62.8) | 26.9 (15.5 39.7) |
| 8 | 40 (1.0) | 33.4 (20.9–53.5) | <0.001 | 1.71 (1.03–2.82) | 0.026 | 26.9 (12.8 43.2) | 12.3 (2.8 29.4) |
| ≥9 | 39 (1.0) | 64.2 (40.5–101) | <0.001 | 1.92 (1.18–3.12) | 0.01 | 7.3 (1.4 19.9) | 0 |
The mean hazard ratio (HR) for CAPRA-S as a continuous variable was 1.54 (95% CI 1.49–1.59), consistent with a 2-point increase in score representing on average a 2.4-fold increase in risk (1.542 = 2.4). The HRs at each individual are summarized in table 2. Pairwise comparisons among adjacent CAPRA-S scores (CAPRA-S 1 vs 0, 2 vs 1, etc) were all statistically significant except for the comparisons of CAPRA-S 4 vs. 3 and 7 vs. 6. The HRs for pairwise comparisons are also summarized in table 2.
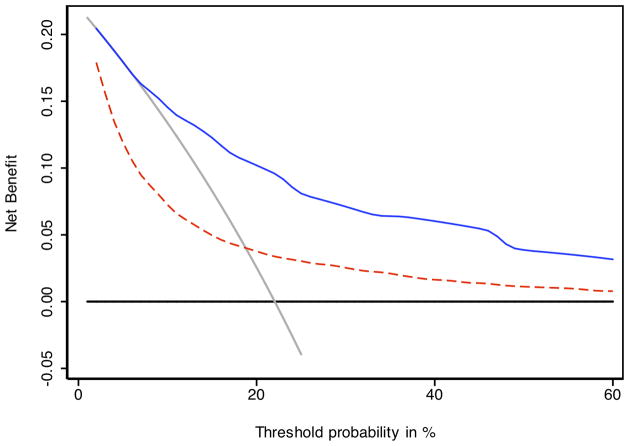
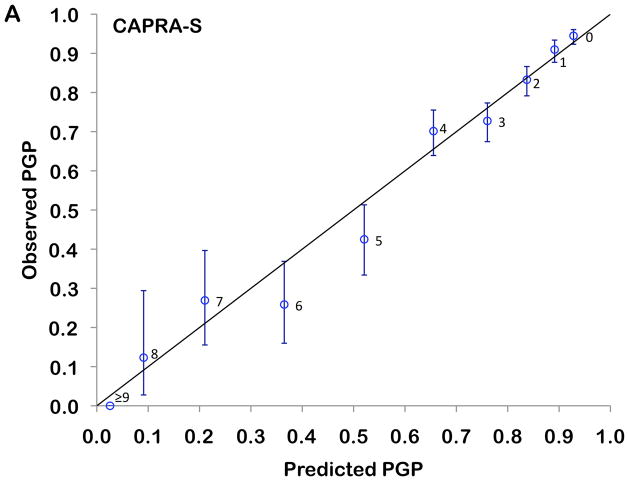
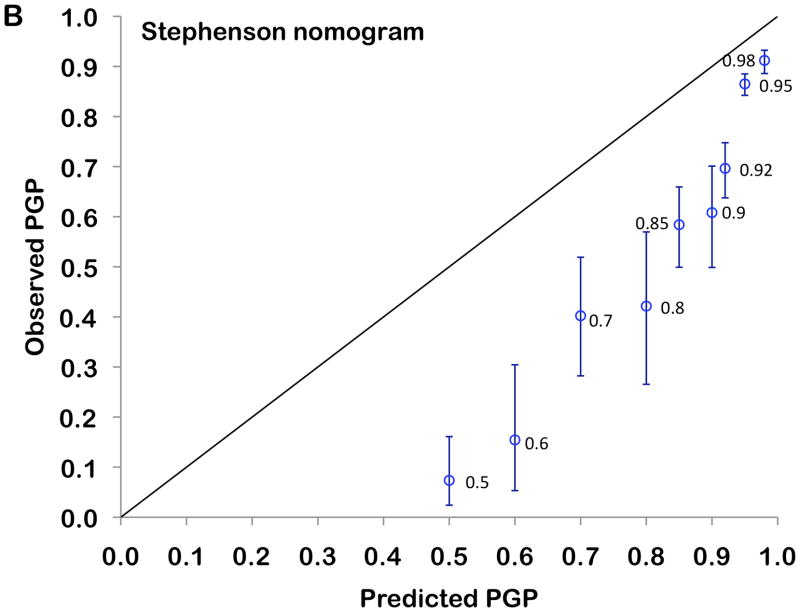
The 3- and 5-year Kaplan-Meier progression-free probability estimates are presented in table 2 and illustrated in figure 2A. Figure 2B presents the corresponding estimates for patients with CAPRA-S scores grouped as 0–2, 3–5, and ≥6. The bootstrap-corrected c-index for the 10-level CAPRA-S is 0.77 (95% CI, 0.75–0.79); by comparison in this sample the c-index for the original CAPRA score is 0.69. Treating the unknown or “unable to assess” pathologic data as missing rather than negative decreased the analytic sample to 3151. The c-index increased slightly to 0.79, and the HR for each point increase in CAPRA-S to 1.57 (1.52–1.63). The c-index for the Stephenson nomogram, by comparison, was minimally lower at 0.76. Figure 3 presents the results of the decision curve analysis between the two instruments. In this dataset, the CAPRA-S score predictions result in greater net benefit across the range of risk thresholds compared to the nomogram predictions. Although the model calibrates very well at 5 years’ follow-up (Hosmer-Lemeshow p=1.0), there is some evidence of lack of fit at higher CAPRA-S scores, which included relatively few patients (Figure 4A). The nomogram, on the other hand (figure 4B) is consistently over-optimistic in its predictions relative to outcomes in CaPSURE.
Figure 2.
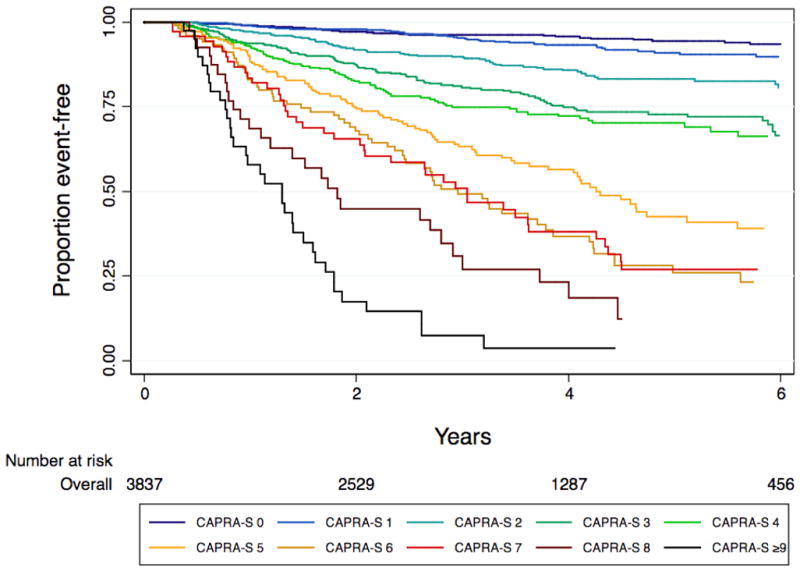
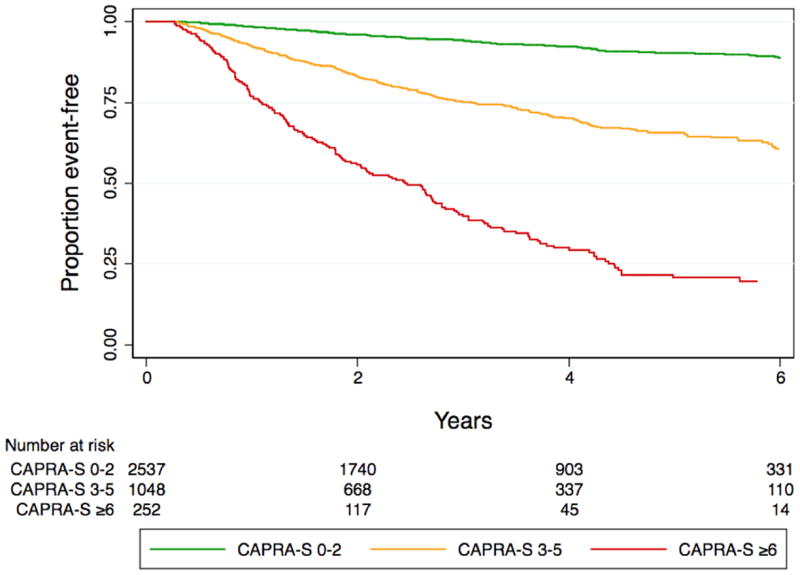
A. Biochemical progression-free probability following radical prostatectomy, stratified by CAPRA-S score. B. Biochemical progression-free probability following radical prostatectomy, stratified by grouped CAPRA-S score: 0–2 indicates relatively low-risk, 3–5 intermediate-risk, and ≥6 high-risk disease in terms of likelihood of biochemical progression.
Figure 3.
Decision curve analysis comparing CAPRA-S to postoperative nomogram. The solid blue line indicates the CAPRA-S score predictions, the dashed red line the nomogram predictions. Across the various threshold probabilities, CAPRA-S has greater net benefit (i.e., the net increase in the proportion of patients who would be appropriately identified for adjuvant treatment using the prediction model) than the nomogram. The gray line represents the assumption that all patients would recur, the black line that none would recur. The segment of the nomogram curve which falls below the gray line suggests suboptimal calibration—specifically, over-optimistic prediction—at low predicted levels of risk.
Figure 4.
Calibration plot comparing observed (Kaplan-Meier estimates and 95% confidence intervals) with predicted (model-based) progression-free probabilities (PGP) at 5 years’ follow-up. The 45° reference line represents perfect calibration, and labels at each point indicate the score level assessed. Panel A: CAPRA-S, Panel B: Stephenson nomogram
Forty men died of prostate cancer at a median of 7.6 years, and 234 died of other causes at a median of 7.1 years during the observation period; the remainder were censored with respect to mortality. On competing risks analysis, the subhazard ratio for cancer-specific mortality for each single point increase in CAPRA-S score was 1.42 (95% CI 1.27–1.60).
Discussion
Radical prostatectomy accounted for half of primary treatment selection among all patients enrolled in CaPSURE between 1990 and 2008.19 Population-based data estimate that approximately one-third of prostate cancer patients in the United States undergo the procedure.20 A subset of these will experience biochemical recurrence, of whom a fraction will progress to clinical recurrence and/or metastases and face disease-specific mortality. Postoperative PSA kinetics may help identify which patients are at greatest risk,21 but require multiple PSA assessments, potentially delaying interventions such as radiation or androgen ablation which have greater benefit with earlier administration for selected patients.22–24 Conversely, many patients with limited adverse pathologic features will not progress following surgery and could be spared the additional morbidity of further treatment.25
A recent review identified eight previously published instruments for prediction of biochemical outcomes following prostatectomy.11 A set of lookup tables, not included in this review has also been published.26 Of these, the only externally validated models based on standard clinical and pathological variables with published accuracy estimates are a prediction formula by Bauer et al.,27 the postoperative nomogram originally developed by Kattan et al28 and the updated version published by Stephenson et al..12 The latter, while based on a recurrence definition using a PSA threshold of 0.4 ng/ml rather than 0.2 ng/ml, incorporates similar variables as the CAPRA-S: preoperative PSA, pGS, SM status, ECE, SVI, LNI, and adds year of surgery. This instrument had a c-index of 0.86 for the development set, and 0.81 and 0.77–0.78 for validation studies in the same institution and another academic institution, respectively, and tended to overestimate somewhat the likelihood of progression-free probability for patients at the higher end of the risk spectrum.12
The bootstrap-corrected c-index for the CAPRA-S score in this study is 0.77, which indicates good discriminatory accuracy. Moreover, the scoring system requires no paper tables or software, and with practice can be determined rapidly from memory. An individual patient’s likelihood of recurrence 3 and 5 years after surgery can be estimated from the figures given in Table 2. However, the absolute risks will vary across cohorts and surgical series, for which reason the CAPRA-S score in meant to be used primarily as a measure of relative risk. Additional validation studies will be required to determine how consistently the absolute risk predictions are calibrated across different clinical contexts.
Of note, two previous papers have performed direct head-to-head comparisons of the pre-treatment CAPRA score to popular nomograms: a U.S. study compared the CAPRA score to the original Kattan preoperative nomogram 3, and a European study compared it to the updated preoperative nomogram published by Stephenson et al..4 In both analyses the accuracy of the CAPRA score was similar to that of the nomograms, while the European study found that the CAPRA score performed better both in terms of calibration and in decision curve analysis.4
Likewise, in the present analysis, the CAPRA-S score and postoperative nomogram have similar discrimination as calculated by the c-index, but the CAPRA-S score performs better in calibration and decision curve analyses. This finding may reflect the application of a nomogram derived from a high-volume surgeon’s experience to broader community practice. We previously observed this phenomenon in analyzing the performance of the Kattan preoperative nomogram in CaPSURE29; in that study the preoperative nomogram was also somewhat over-optimistic when applied to the community-based data, though the miscalibration was not as great as we observe with the postoperative nomogram in this current analysis.
The CAPRA-S scores, while still concentrated among the lower scores, are more broadly distributed than the original pre-treatment CAPRA scores. The CAPRA-S score thus should be quite useful in practice for helping patients understand their risk of recurrence and the possible utility of adjuvant therapy. The score should also be applicable as a composite measure of disease risk in the research setting, both for consistent identification of eligible patients, and for risk-based subgroup classification of trial results. The CaPSURE data are multi-institutional and largely community-based, so should be robust in terms of external applicability.
Several caveats should be noted. First, completeness of pathologic data is variable in CaPSURE, reflecting the nature of the registry, with multiple clinicians contributing data, including pathology reports written to varying standards by an unknown number of pathologists. However, the sensitivity analysis is reassuring that the model is robust, and bootstrap correction of the confidence intervals on the parameter estimates supports the credibility of the results. We expected LNI to be more strongly predictive of recurrence; its relatively minor contribution to the CAPRA-S score likely reflects the very low prevalence of LNI in the dataset. This finding is typical of U.S. surgical series in which a relatively limited lymphadenectomy is usually performed; in series including higher risk patients, in which extended template lymph node dissection is employed, the prevalence of LNI is substantially higher.30–32 Many patients did not have a lymphadenectomy performed, so excluding those with unknown LNI status would be problematic. Of note, in the postoperative nomogram, LNI also contributes relatively few points—comparable to SM but less important than ECE or SVI.12
There is a degree of overlap between adjacent scores, particularly CAPRA-S scores 6 and 7. However, while the incremental increase in risk with increasing CAPRA-S score is not entirely smooth, the analysis of the score as a continuous variable and the pairwise comparisons presented confirm that in general each two point increase in CAPRA-S score indicates at least a doubling of risk of recurrence. The a priori establishment of thresholds for dividing the CAPRA-S scores among low-risk (0–2), intermediate-risk (3–5), and high-risk (6–10) should facilitate use of the score as a risk stratification tool in the clinical research setting. Like other U.S. surgical cohorts, CaPSURE includes mostly men at relatively low risk of progression, so the interpretation of the CAPRA-S score at higher risk levels may be less reliable.
Our definition of recurrence included the one favored by the American Urological Association Prostate Guidelines for Localized Prostate Cancer.15 However, biochemical recurrence does not necessarily correlate with ultimate mortality from prostate cancer.33 This analysis does indicate that the CAPRA-S score predicts prostate cancer-specific mortality. However, important future directions will include both external validation and assessment of the CAPRA-S score’s performance in predicting cause-specific and overall mortality with larger numbers of patients ultimately reaching these endpoint—and additional head-to-head comparisons of CAPRA-S against other postoperative risk models in terms of accuracy, discrimination, and calibration. These studies are planned in the near future, and will include cohorts with greater representation of men with relatively high-risk disease.
Incorporating pathological information, the CAPRA-S score in predicting disease recurrence after prostatectomy, yet remains straightforward to calculate. No nomogram or scoring system can replace individualized clinician-patient decision-making, which must consider life expectancy, utilities for quality of life outcomes, and treatment preferences. However, we believe that given the accuracy and ease of use of the CAPRA-S score, this instrument will prove a useful tool both to inform decision-making after prostatectomy and to classify patients for future studies of adjuvant therapy.
Acknowledgments
CaPSURE is supported in part by Abbott Labs (Abbott Park, IL), and is additionally funded internally by the UCSF Department of Urology. This work was also supported by National Institutes of Health/National Cancer Institute University of California-San Francisco SPORE Special Program of Research Excellence P50CA89520. No sponsor had any role in the design and conduct of the study; collection, management, analysis, and interpretation of the data; or preparation, review, or approval of the manuscript.
References
- 1.Jemal A, Siegel R, Xu J, Ward E. Cancer Statistics, 2010. CA Cancer J Clin. 2010;60:277–300. doi: 10.3322/caac.20073. [DOI] [PubMed] [Google Scholar]
- 2.Cooperberg MR, Pasta DJ, Elkin EP, Litwin MS, Latini DM, Du Chane J, et al. The University of California, San Francisco Cancer of the Prostate Risk Assessment score: a straightforward and reliable preoperative predictor of disease recurrence after radical prostatectomy. J Urol. 2005;173(6):1938–42. doi: 10.1097/01.ju.0000158155.33890.e7. [DOI] [PMC free article] [PubMed] [Google Scholar]
- 3.Zhao KH, Hernandez DJ, Han M, Humphreys EB, Mangold LA, Partin AW. External validation of University of California, San Francisco, Cancer of the Prostate Risk Assessment score. Urology. 2008;72(2):396–400. doi: 10.1016/j.urology.2007.11.165. [DOI] [PubMed] [Google Scholar]
- 4.Lughezzani G, Budaus L, Isbarn H, Sun M, Perrotte P, Haese A, et al. Head-to-head comparison of the three most commonly used preoperative models for prediction of biochemical recurrence after radical prostatectomy. Eur Urol. 2010;57:562–8. doi: 10.1016/j.eururo.2009.12.003. [DOI] [PubMed] [Google Scholar]
- 5.Cooperberg MR, Freedland SJ, Pasta DJ, Elkin EP, Presti JC, Jr, Amling CL, et al. Multiinstitutional validation of the UCSF cancer of the prostate risk assessment for prediction of recurrence after radical prostatectomy. Cancer. 2006;107(10):2384–91. doi: 10.1002/cncr.22262. [DOI] [PubMed] [Google Scholar]
- 6.May M, Knoll N, Siegsmund M, Fahlenkamp D, Vogler H, Hoschke B, et al. Validity of the CAPRA score to predict biochemical recurrence-free survival after radical prostatectomy. Results from a European multicenter survey of 1,296 patients. J Urol. 2007;178(5):1957–62. doi: 10.1016/j.juro.2007.07.043. [DOI] [PubMed] [Google Scholar]
- 7.Schroeck FR, Aronson WJ, Presti JC, Jr, Terris MK, Kane CJ, Amling CL, et al. Do nomograms predict aggressive recurrence after radical prostatectomy more accurately than biochemical recurrence alone? BJU Int. 2009;103(5):603–8. doi: 10.1111/j.1464-410X.2008.08118.x. [DOI] [PMC free article] [PubMed] [Google Scholar]
- 8.Cooperberg MR, Broering JM, Carroll PR. Risk assessment for prostate cancer metastasis and mortality at the time of diagnosis. J Natl Cancer Inst. 2009;101(12):878–87. doi: 10.1093/jnci/djp122. [DOI] [PMC free article] [PubMed] [Google Scholar]
- 9.Vickers A. Prediction models in urology: are they any good, and how would we know anyway? Eur Urol. 2010;57:571–73. doi: 10.1016/j.eururo.2009.12.026. [DOI] [PMC free article] [PubMed] [Google Scholar]
- 10.Cooperberg MR, Hinotsu S, Namiki M, Ito K, Broering J, Carroll PR, et al. Risk assessment among prostate cancer patients receiving primary androgen deprivation therapy. J Clin Oncol. 2009;27(26):4306–13. doi: 10.1200/JCO.2008.21.5228. [DOI] [PMC free article] [PubMed] [Google Scholar]
- 11.Shariat SF, Karakiewicz PI, Roehrborn CG, Kattan MW. An updated catalog of prostate cancer predictive tools. Cancer. 2008;113(11):3075–99. doi: 10.1002/cncr.23908. [DOI] [PubMed] [Google Scholar]
- 12.Stephenson AJ, Scardino PT, Eastham JA, Bianco FJ, Jr, Dotan ZA, DiBlasio CJ, et al. Postoperative nomogram predicting the 10-year probability of prostate cancer recurrence after radical prostatectomy. J Clin Oncol. 2005;23(28):7005–12. doi: 10.1200/JCO.2005.01.867. [DOI] [PMC free article] [PubMed] [Google Scholar]
- 13.Lubeck DP, Litwin MS, Henning JM, Stier DM, Mazonson P, Fisk R, et al. The CaPSURE database: a methodology for clinical practice and research in prostate cancer. CaPSURE Research Panel. Cancer of the Prostate Strategic Urologic Research Endeavor. Urology. 1996;48(5):773–7. doi: 10.1016/s0090-4295(96)00226-9. [DOI] [PubMed] [Google Scholar]
- 14.Cooperberg MR, Broering JM, Litwin MS, Lubeck DP, Mehta SS, Henning JM, et al. The contemporary management of prostate cancer in the United States: lessons from the cancer of the prostate strategic urologic research endeavor (CaPSURE), a national disease registry. J Urol. 2004;171(4):1393–401. doi: 10.1097/01.ju.0000107247.81471.06. [DOI] [PubMed] [Google Scholar]
- 15.Cookson MS, Aus G, Burnett AL, Canby-Hagino ED, D’Amico AV, Dmochowski RR, et al. Variation in the definition of biochemical recurrence in patients treated for localized prostate cancer: the American Urological Association Prostate Guidelines for Localized Prostate Cancer Update Panel report and recommendations for a standard in the reporting of surgical outcomes. J Urol. 2007;177(2):540–5. doi: 10.1016/j.juro.2006.10.097. [DOI] [PubMed] [Google Scholar]
- 16.Harrell FE, Jr, Lee KL, Mark DB. Multivariable prognostic models: issues in developing models, evaluating assumptions and adequacy, and measuring and reducing errors. Stat Med. 1996;15(4):361–87. doi: 10.1002/(SICI)1097-0258(19960229)15:4<361::AID-SIM168>3.0.CO;2-4. [DOI] [PubMed] [Google Scholar]
- 17.Vickers AJ, Elkin EB. Decision curve analysis: a novel method for evaluating prediction models. Med Decis Making. 2006;26(6):565–74. doi: 10.1177/0272989X06295361. [DOI] [PMC free article] [PubMed] [Google Scholar]
- 18.Fine JP, Gray RJ. A proportional hazards model for the subdistribution of competing risk. J Amer Statist Assoc. 1999;94(446):496–509. [Google Scholar]
- 19.Cooperberg MR, Broering JM, Carroll PR. Time trends and local variation in primary treatment of localized prostate cancer. J Clin Oncol. 2010;28(7):1117–23. doi: 10.1200/JCO.2009.26.0133. [DOI] [PMC free article] [PubMed] [Google Scholar]
- 20.Penson DF, Chan JM. Prostate cancer. J Urol. 2007;177(6):2020–9. doi: 10.1016/j.juro.2007.01.121. [DOI] [PubMed] [Google Scholar]
- 21.Freedland SJ, Humphreys EB, Mangold LA, Eisenberger M, Dorey FJ, Walsh PC, et al. Risk of prostate cancer-specific mortality following biochemical recurrence after radical prostatectomy. JAMA. 2005;294(4):433–9. doi: 10.1001/jama.294.4.433. [DOI] [PubMed] [Google Scholar]
- 22.Messing EM, Manola J, Yao J, Kiernan M, Crawford D, Wilding G, et al. Immediate versus deferred androgen deprivation treatment in patients with node-positive prostate cancer after radical prostatectomy and pelvic lymphadenectomy. Lancet Oncol. 2006;7(6):472–9. doi: 10.1016/S1470-2045(06)70700-8. [DOI] [PubMed] [Google Scholar]
- 23.Thompson IM, Tangen CM, Paradelo J, Lucia MS, Miller G, Troyer D, et al. Adjuvant radiotherapy for pathological T3N0M0 prostate cancer significantly reduces risk of metastases and improves survival: long-term followup of a randomized clinical trial. J Urol. 2009;181(3):956–62. doi: 10.1016/j.juro.2008.11.032. [DOI] [PMC free article] [PubMed] [Google Scholar]
- 24.Stephenson AJ, Scardino PT, Kattan MW, Pisansky TM, Slawin KM, Klein EA, et al. Predicting the outcome of salvage radiation therapy for recurrent prostate cancer after radical prostatectomy. J Clin Oncol. 2007;25(15):2035–41. doi: 10.1200/JCO.2006.08.9607. [DOI] [PMC free article] [PubMed] [Google Scholar]
- 25.Thompson IM, Tangen CM, Klein EA. Is there a standard of care for pathologic stage T3 prostate cancer? J Clin Oncol. 2009;27(18):2898–9. doi: 10.1200/JCO.2008.20.9460. [DOI] [PubMed] [Google Scholar]
- 26.Han M, Partin AW, Zahurak M, Piantadosi S, Epstein JI, Walsh PC. Biochemical (prostate specific antigen) recurrence probability following radical prostatectomy for clinically localized prostate cancer. J Urol. 2003;169(2):517–23. doi: 10.1097/01.ju.0000045749.90353.c7. [DOI] [PubMed] [Google Scholar]
- 27.Bauer JJ, Connelly RR, Seterhenn IA, Deausen J, Srivastava S, McLeod DG, et al. Biostatistical modeling using traditional preoperative and pathological prognostic variables in the selection of men at high risk for disease recurrence after radical prostatectomy for prostate cancer. J Urol. 1998;159(3):929–33. [PubMed] [Google Scholar]
- 28.Kattan MW, Wheeler TM, Scardino PT. Postoperative nomogram for disease recurrence after radical prostatectomy for prostate cancer. J Clin Oncol. 1999;17(5):1499–507. doi: 10.1200/JCO.1999.17.5.1499. [DOI] [PubMed] [Google Scholar]
- 29.Greene KL, Meng MV, Elkin EP, Cooperberg MR, Pasta DJ, Kattan MW, et al. Validation of the Kattan preoperative nomogram for prostate cancer recurrence using a community based cohort: results from Cancer of the Prostate Strategic Urological Research Endeavor (CaPSURE) J Urol. 2004;171(6 Part 1):2255–59. doi: 10.1097/01.ju.0000127733.01845.57. [DOI] [PubMed] [Google Scholar]
- 30.Burkhard FC, Bader P, Schneider E, Markwalder R, Studer UE. Reliability of preoperative values to determine the need for lymphadenectomy in patients with prostate cancer and meticulous lymph node dissection. Eur Urol. 2002;42(2):84–90. doi: 10.1016/s0302-2838(02)00243-9. discussion 90–2. [DOI] [PubMed] [Google Scholar]
- 31.Touijer K, Rabbani F, Otero JR, Secin FP, Eastham JA, Scardino PT, et al. Standard vs Limited Pelvic Lymph Node Dissection for Prostate Cancer in Patients With a Predicted Probability of Nodal Metastasis Greater Than 1% J Urol. 2007;178:120–24. doi: 10.1016/j.juro.2007.03.018. [DOI] [PubMed] [Google Scholar]
- 32.Mattei A, Fuechsel FG, Bhatta Dhar N, Warncke SH, Thalmann GN, Krause T, et al. The template of the primary lymphatic landing sites of the prostate should be revisited: results of a multimodality mapping study. Eur Urol. 2008;53(1):118–25. doi: 10.1016/j.eururo.2007.07.035. [DOI] [PubMed] [Google Scholar]
- 33.Sartor O. Endpoints in prostate cancer clinical trials. Urology. 2002;60(3 Suppl 1):101–7. doi: 10.1016/s0090-4295(02)01585-6. [DOI] [PubMed] [Google Scholar]


