

Abstract
Since the development and prognosis of alcohol-induced liver disease (ALD) vary significantly with genetic background, identification of a genetic background-independent noninvasive ALD biomarker would significantly improve screening and diagnosis. This study explored the effect of genetic background on the ALD-associated urinary metabolome using the Ppara-null mouse model on two different backgrounds, C57BL/6 (B6) and 129/SvJ (129S), along with their wild-type counterparts. Reversed-phase gradient UPLC-ESI-QTOF-MS analysis revealed that urinary excretion of a number of metabolites, such as, ethylsulfate, 4-hydroxyphenylacetic acid, 4-hydroxyphenylacetic acid sulfate, adipic acid, pimelic acid, xanthurenic acid, and taurine were background-dependent. Elevation of ethyl-β-D-glucuronide and N-acetylglycine was found to be common signature of the metabolomic response to alcohol exposure in wild-type as well as in Ppara-null mice of both strains. However, increased excretion of indole-3-lactic acid and phenyllactic acid was found to be a conserved feature exclusively associated with the alcohol-treated Ppara-null mouse on both backgrounds that develop liver pathologies similar to the early stages of human ALD. These markers reflected the biochemical events associated with early stages of ALD pathogenesis. The results suggest that indole-3-lactic acid and phenyllactic acid are potential candidates for conserved and pathology-specific high-throughput noninvasive biomarkers for early stages of ALD.
Keywords: Metabolomics, alcohol, Ppara-null mouse, genetic background, liver disease, UPLC-ESI-QTOF mass spectrometry, biomarker
1. Introduction
Genetic composition is an intrinsic property that interacts with extrinsic factors such as food, environment, life-style, and xenobiotics to define the human phenotype. Unlike these extrinsic factors that can be controlled or manipulated to a certain degree, the genetic trait inherently predisposes individuals or groups of individuals to particular phenotypes. The etiology and pathogenesis of diseases and disorders are often dependent on genetic variation. It is therefore not surprising that identification of genetic background-independent diagnostic and predictive molecular signatures associated with diseases and disorders remains quite challenging to translational research.
Alcoholism is a common problem worldwide. The 2011 status report by the World Health Organization (WHO) (http://www.who.int/mediacentre/news/releases/2011/alcohol_20110211/en/index.html) stated “almost 4% of all deaths worldwide are attributed to alcohol, greater than deaths caused by HIV/AIDS, violence or tuberculosis.” Alcohol consumption is on the rise in developing as well as in developed countries including the United States1. However, epidemiological studies have revealed a significant variation in the propensity to, severity, and outcome of alcoholism depending on genetic background and composition1-9. Polymorphisms in genes related to alcohol metabolism was shown to affect incidence and physiological impacts of alcoholism6, 8, 10. Apart from the neuropsychiatric effects, a significant portion of alcohol-related deaths are due to the development of alcoholic liver disease (ALD) and it is a leading cause for lifestyle-associated deaths in the Unites States11. In 2003, around half of all liver disease-related deaths were attributed to alcohol consumption12. Genetic background and polymorphism were shown to significantly affect the development and outcome of alcoholic liver disease as well2, 3, 7, 13, 14. ALD pathogenesis can be characterized into three stages; steatosis, alcoholic hepatitis, and fibrosis/cirrhosis1. Approximately 90% of alcoholics develop fatty liver (steatosis) that resolves upon abstinence from alcohol1. However, steatosis is not a benign condition and with continuation of heavy drinking, the risk of developing cirrhosis was found to increase up to 37%15. Cirrhosis is a fatal condition with overall 5-year survival rate as low as 35%. Patients with liver cirrhosis have also been found to be at increased risk of developing liver cancer16, 17 also adding to the mortality rate. However, at earlier stages (steatosis) ALD is often asymptomatic but reversible and patients can recover completely1, 9, 18. Detection of the disease at this stage is of key importance to improve the therapeutic outcome, quality of life, and reduce the mortality as well as healthcare burden. However, due to the heterogeneous influence of genetic background on disease onset, progress, and clinical symptoms, the most prudent strategy to prevent fatal consequences is to routinely monitor alcoholics for ALD onset. Unfortunately, the most commonly used diagnostic tools for assessment of liver damage (liver enzyme levels) are nonspecific to etiology9, 18. This leaves liver biopsy as the only way of confirmatory diagnosis of the disease9, 18, 19. However, the invasiveness and complications associated with biopsy20 precludes it as a viable tool for routine screening and diagnosis of large number of patients. Therefore, an early, noninvasive, high-throughput genetic background-independent ALD-specific biomarker is highly warranted.
The nuclear receptor peroxisome proliferator-activated receptor alpha (PPARα) is a key regulator of the genes involved in lipid metabolism21, 22. Earlier, chronic alcohol treatment of the peroxisome proliferator-activated receptor alpha knockout (Ppara-null) mouse has been shown to result in development of liver pathology remarkably similar to the early stages of the human ALD while the wild-type animals remained protected from such liver damage23. Recently, mass spectrometry-based metabolomic analysis has revealed changes in the urinary excretion of metabolites in the alcohol-fed Ppara-null mice on the 129/SvJ (129S) background24. The use of ultra-performance liquid chromatography coupled with electrospray ionization quadrupole time-of-flight mass spectrometry (UPLC-ESI-QTOFMS) platform in identification of these metabolites makes them amenable to high-throughput analysis. In addition, several other studies have also demonstrated that global analysis using mass spectrometry25, 26 as well as NMR27 can aid in the identification of changes in metabolic profiles associated with alcohol exposure and liver damage. While these metabolites hold potential to serve as high-throughput noninvasive biomarkers for the early stage of the disease, their dependence on genetic background has yet to be tested. Earlier studies have shown that the difference in genetic background of the 129S and C57BL/6 (B6) mice results in considerable differences between them with respect to intrinsic physiological functions28 as well as the biochemical response and outcome of xenobiotic insults29, 30. Since the metabolome is the final outcome of intertwined interactions between genes, transcripts, proteins, and metabolites, it is highly susceptible to variation in genetic background. However, etiologically and pathologically identical diseases may have some conserved metabolic fingerprint that result from the underlying molecular events. In order to identify genetic background-independent conserved ALD biomarkers, the urinary metabolomic changes in wild-type and Ppara-null mice of B6 and 129S background was investigated. A combination of UPLC-ESI-QTOFMS and chemometrics showed that although there were considerable differences in the metabolomic responses of the B6 and 129S mice to chronic alcohol exposure, ALD pathogenesis was associated with conserved changes in the urinary metabolome.
2. Materials and Methods
2.1. Chemicals
HPLC grade solvents were purchased from Fisher Scientific (Hampton, NH). All compounds of highest grades available were obtained from Sigma-Aldrich (St. Louis, MO).
2.2. Animals and Treatments
Male 6- to 8-week-old Ppara-null mice on B6 (C57BL/6N-Ppara<tm1Gonz>/N) and 129S (129S4/SvJae-Ppara<tm1Gonz>/N) background as well as their wild-type counterparts (four mice per group) were fed ad libitum a 4% alcohol-containing liquid diet (Lieber-DeCarli Diet, Dyets, Inc., Bethlehem, PA). Control mice were fed ad libitum an isocaloric diet supplemented with maltose dextran (Dyets, Inc.). Mice were euthanized after one month on the alcohol diet, serum collected, and portions of liver harvested for histology. After biochemical and histological evaluation of the model and ensuring that all mice were tolerating the liquid diet, mice were transferred to the urinary metabolomics protocol at two months. Urine samples were collected monthly from mice placed individually in Nalgene metabolic cages (Tecniplast USA, Inc., Exton, PA) over 24 hours and stored at -80°C in glass vials until analyzed. All mice were acclimated to the metabolic cages by placing them in the metabolic cages before the actual sample collection. All animal studies were approved by the Georgetown University Animal Care and Use Committee.
2.3 Histology
Liver tissues were immediately formalin-fixed, paraffin-embedded, sectioned, and stained with hematoxylin and eosin (HE) following a standard protocol. The HE-stained liver sections were examined under an Olympus BX41 microscope.
2.4. Biochemistry
Liver and serum triglycerides were estimated using a colorimetric assay kit from Wako (Richmond, VA). The serum AST and ALT activities were measured using VetSpec™ kits (Catachem Inc, Bridgeport, CT) following the manufacturer's instruction.
2.5. Preparation of Urine Samples and UPLC-ESI-QTOFMS Analysis
Urine samples were deproteinated using Sirroco™ protein precipitation plates (Waters Corp., Milford, MA) after addition of one volume of 50% aqueous acetonitrile containing internal standards (50 μM 4-nitrobenzoic acid and 1 μM debrisoquine) and deproteinated extracts were collected into 96-well collection plates according to the manufacturer's instructions. A 5 μL aliquot of supernatant was injected into a Waters UPLC-ESI-QTOFMS system (Milford, MA). An Acquity UPLC BEH C18 column (1.7μm, 2.1×50mm, Waters Corp.) was used to separate urinary constituents. The mobile phase was comprised of 0.1% aqueous formic acid (A) and acetonitrile containing 0.1% formic acid (B). The gradient elution was performed over 10 minutes at a flow rate of 0.5 ml using: 2% B for 0.5 min, 2-20% B in 4 min, 20-95% B in 8 min, 95-99% B in 8.1 min, holding at 99%B up to 9.0 min, bringing back to 2% at 9.1 min and holding at 2% till end. Column temperature was maintained at 40°C throughout the run. The QTOF Premier mass spectrometer was operated in electrospray ionization positive (ESI+) and negative (ESI-) mode using sulfadimethoxine as the lock mass for accurate mass calibration in real time. Capillary and cone voltages were maintained at 3 kV and 20 V, respectively. Source and desolvation temperatures were set, respectively, at 120 °C and 350 °C. Nitrogen was used as both cone gas (50 L/h) and desolvation gas (600 L/h), and argon was used as collision gas. Collision energy ranging from 10 to 40 eV was applied for MS/MS fragmentation of target ions. All urine samples were analyzed in a randomized fashion to avoid complications due to artifacts related to injection order and changes in instrument efficiency. MassLynx software (Waters Corp.) was used to acquire the chromatogram and mass spectrometric data in centroid format.
2.6. Multivariate Data Analysis
Centroided and integrated raw mass spectrometric data were processed using MarkerLynx software (Waters Corp., Milford, MA). The individual ion intensities were normalized with respect to the total ion count (TIC) to generate a data matrix that consisted of the retention time, m/z value, and the normalized peak area. This data matrix was analyzed by SIMCA-P+12 software (Umetrics, Kinnelon, NJ). Principal components analysis (PCA) of the Pareto-scaled data31 was performed to check unsupervised segregation of the metabolome. The supervised orthogonal projection to latent structures (OPLS) model was used to concentrate group discrimination into the first component with remaining unrelated variation contained in subsequent components. The magnitude of the parameter p(corr)[1] obtained from the OPLS analysis correlates with the group discriminating power of a variable. A list of ions showing considerable group discriminating power (-0.8 > p(corr)[1] or p(corr)[1] > 0.8) was generated from the loadings S-plot for metabolic pathway analysis. However, only the ions that were consistently attenuated on alcohol treatment throughout the study, at least in case of one genotype of the respective background, were selected for further identification and quantitation.
2.7. Metabolic Pathway Analysis
The effect of alcohol treatment on the potential metabolic pathways was analyzed with the help of the MassTRIX website32 (http://metabolomics.helmholtz-muenchen.de/masstrix/) using the above list of ions that contributed consistently to the separation of the metabolome as described earlier24.
2.8. Identification of Urinary Biomarkers
Seven Golden Rules33 was used to calculate elemental compositions considering a mass error less than 5 ppm. Possible candidates for the ions were also searched using metabolomics databases34, 35. Finally, identities of the ions were confirmed by comparison of retention time and fragmentation pattern with authentic standards. Sulfate conjugates were confirmed by the disappearance of the peak corresponding to the metabolite following treatment of the urine samples with sulfatase enzyme (Sigma-Aldrich, St. Louis, MO) as described earlier 24.
2.9. Quantitation of Urinary Metabolites
An Acquity® UPLC system coupled with a XEVO triple-quadrupole tandem mass spectrometer (Waters Corp.) was used to quantitate urinary metabolites by multiple reaction monitoring (MRM). A number of MRM transitions were chosen to detect each compound according to their fragmentation patterns using authentic standards. Standard compounds were mixed together to optimize the condition for separation and detection of the metabolites from a complex mixture such as urine. Debrisoquine (0.5 μM) was used as the internal standard. Finally, following MRM transitions were monitored for the respective compounds: debrisoquine (176→134; ESI+), phenylalanine (166→120; ESI+), phenyllactic acid (165→103; ESI-), suberic acid (173→111; ESI-), N-hexanoylglycine (174→76; ESI+), indole-3-lactic acid (206→118; ESI+), indole-3-pyruvic acid (204→130; ESI+), tryptophan (205→118; ESI+), xanthurenic acid (206→160, ESI-), N-acetylglycine (116→74, ESI-), taurine (124→80, ESI-), 2-hydroxyphenylacetic acid (151→107; ESI-), 4-hydroxyphenylacetic acid (151→107; ESI-), adipic acid (147→101; ESI+), pimelic acid (159→97; ESI-) and creatinine (114→86; ESI+). An Acquity UPLC BEH C18 column (1.7μm, 2.1×50mm, Waters Corp.) was used to separate mixture of authentic standards as well urine samples. The mobile phase was comprised of 0.1% aqueous formic acid (A) and acetonitrile containing 0.1% formic acid (B). The gradient elution was performed over 6 minutes at a flow rate of 0.3 ml using: 1-99% B in 4 min, holding at 99%B up to 5.0 min, bringing back to 1% at 5.5 min and holding at 1% till end. Column temperature was maintained at 40°C throughout the run. The area under the peak for each metabolite was divided by that for the internal standard to calculate response and serial dilution was performed to generate a standard calibration plot of response vs. concentration. Serially diluted urine samples containing 0.5 μM debrisoquine were analyzed in the same fashion as that of authentic compounds. The quantitative abundances were calculated from the response using the linear range of detection of the calibration plot (see supplementary material for details). All analyses were performed using TargetLynx software (Waters Corp.)
2.10. Statistics
All values are presented as mean ± standard error of the mean (SEM). One-way ANOVA with Bonferroni's correction for multiple comparisons were performed using GraphPad Prism 4 software and P < 0.05 was considered statistically significant.
3. Results
3.1. Histology and Biochemistry
Liver histology (see supplementary Figure S1A) showed an increase in steatosis in livers of the alcohol-treated B6 Ppara-null mice compared to their counterparts on control diet, whereas no such change was observed in the wild-type mice. Subsequent triglyceride measurements (Figure 1A) showed a clear although not statistically significant trend indicating increase in fat deposition in livers of B6 Ppara-null mice after one month of alcohol treatment. No such increase was observed in alcohol-fed wild-type mice on B6 background. In addition, there were no significant changes in the serum ALT, AST, and triglyceride levels of these mice after one month of alcohol treatment (see Supplementary Figure S1). These observations were similar to those reported earlier for alcohol treatment of wild-type and Ppara-null mice on the 129S background23, 24.
Figure 1.

Biochemistry and multivariate data analysis. (A) Liver triglyceride levels in the control (filled triangles) and alcohol-treated (filled diamonds) wild-type mice on the B6 background after one month. The triglyceride levels in their Ppara-null counterparts are represented by empty triangles and diamonds, respectively. (B) Scores scatter plot from unsupervised Principal components analysis (PCA) of the urinary metabolomic signature showing segregation of metabolic fingerprints of control (solid diamonds) and alcohol-treated (empty diamonds) Ppara-null mice on the B6 background at two months. (C) Scores scatter plot from PCA of the urinary metabolomic signature showing distinct metabolic phenotypes (metabotype) associated with chronic alcohol treatment of wild-type and Ppara-null mice on the B6 background at 6 months. The solid triangles, empty triangles, solid diamonds, and empty diamonds represent the control wild-type, control Ppara-null, alcohol-treated wild-type and alcohol-treated Ppara-null mice, respectively. (D) PCA scores scatter plot showing distinct metabotype associated with the mice on the B6 (boxes) and 129S (squares) background throughout the duration of the study irrespective of alcohol exposure status. (E) PCA scores scatter plot illustrating the underlying genetic background-related differences in metabolic traits of the alcohol-treated Ppara-null mice on the B6 or 129S background at 6months. (F) Loadings S-plots from the supervised orthogonal projection to latent structures (OPLS) analysis of the metabolic signatures (at six months) for the selection of candidate markers of chronic alcohol exposure in Ppara-null mice on the B6 background. Each triangle represents an ion characterized by unique mass and retention time. The p(corr)[1] values represent the interclass difference and w(1) values indicate the relative abundance of the ions. Ions shown in boxes represent the potential markers that showed consistent contribution to the interclass difference during alcohol exposure (see Table S2). Those in the upper right and lower left quadrants respectively represent ions with elevated and depleted abundance in the urine of the alcohol-treated B6 Ppara-null mice. Representative results from the positive electrospray ionization (ESI+) mode metabolomic analysis are shown here. Negative electrospray ionization (ESI-) mode also showed similar patterns (data not shown).
3.2. Metabolomic Analysis
Unsupervised principal components analysis (PCA) of the metabolic signature showed that alcohol exposed wild-type and Ppara-null mice generated distinct metabotypes (metabolic phenotypes). The urinary metabolome of control and alcohol-treated Ppara-null (Figure 1B) as well as wild-type (see Supplementary Figure S2A) mice on the B6 background were found to segregate well after two months. Metabolomic analysis of B6 mice after six months of alcohol treatment also showed clear segregation of the mice according to their genotype and alcohol exposure status indicating distinct metabotypes associated with alcohol treatment of the wild-type and Ppara-null mice (Figure 1C). However, the metabolic fingerprints of the B6 and 129S mice were different irrespective of their genotype and alcohol exposure status (Figure 1D). After six months of alcohol treatment, both wild-type and Ppara-null mice on the B6 background had a different metabotype than their 129S counterparts (Figure 1E, Supplementary Figure S2C). Nevertheless, during the course of alcohol treatment, the urinary metabolome of mice from both backgrounds showed a shift in the same direction indicating some underlying similarity in the metabolic response to alcohol exposure (Figure 1D, arrow).
The supervised OPLS model was used to identify metabolic changes associated with alcohol exposure and to explore background-independent responses. The loadings S-plot for OPLS analysis of control and alcohol-treated Ppara-null (Figure 1F) and wild-type mice (Supplementary Figure S2D) on the B6 background at six months were used to select ions that contributed significantly (p(corr)[1] < -0.8 or p(corr)[1] > 0.8) to the separation of the metabolome in response to alcohol treatment. The trend plots for time-dependent changes in the relative abundance of these ions were examined to screen only those with consistent contribution to the separation of the metabolome during the course of the study. For example, ions P1 and P4 were elevated, while P14 and P16 were depleted in both Ppara-null (Figure 1F, Table S2) and wild-type mice (Figure S2C, Table S1) on the B6 background. Ions P2 and P23 were elevated, while P24 and P25 depleted (Figure 1F, Table S2) exclusively in Ppara-null mice on B6 background. These ions potentially represent metabolic changes associated with ALD pathogenesis in alcohol-treated B6 Ppara-null mice. A list of ions involved in the metabolic response to alcohol exposure in wild-type and Ppara-null mice of B6 background is presented in Table S1 and Table S2, respectively. These were compared to the list of ions contributing to the separation of the metabolome in the129S mouse24 to detect potential biomarkers of alcohol exposure that are independent of genetic background. In keeping with the consistent differences in their overall metabolomic signature, a large number of markers present in the B6 mice were absent in 129S mice and vice versa (see supplementary Table S3 and S4). However, ions such as P1, N1, and N2 were found to be markers of alcohol exposure in both wild-type and Ppara-null mice irrespective of their backgrounds. Table 1 and Table 2 list such ions that were detected and represent the background-independent metabolic signature of alcohol exposure in the wild-type and Ppara-null mice, respectively. Interestingly, ions such as P2 and N17 were found to be consistently elevated exclusively in the alcohol-treated Ppara-null mice irrespective of the background. These ions potentially represent genetic background-independent metabolic responses associated with ALD pathogenesis.
Table 1. List of Background-independent Metabolites for Chronic Alcohol Exposure in Wild-type Mice.
| Marker | RTb | m/z | Trend | Identity | Possible Origin |
|---|---|---|---|---|---|
| N1 a | 0.6 | 221.066 | ↑ | Ethyl-β-D-glucuronide | Alcohol metabolism |
| N1a | 0.6 | 203.056 | ↑ | (N1-H2O) | Alcohol metabolism |
| N1b | 0.6 | 341.017 | ↑ | (N1+2HCO2H+CO) | Alcohol metabolism |
| N2 | 0.9 | 116.035 | ↑ | N-acetylglycine | Alcohol metabolism |
| P1 | 0.6 | 245.063 | ↑ | Ethyl-β-D-glucuronide + Na+ | Alcohol metabolism |
| P1a | 0.6 | 199.023 | ↑ | (P1-HCO2H) | Alcohol metabolism |
| P1b | 0.6 | 181.013 | ↑ | (P1-HCO2H-H2O) | Alcohol metabolism |
| P1c | 0.6 | 159.03 | ↑ | (P1-HCO2H-H2O-Na+ +H+) | Alcohol metabolism |
‘N’ indicates marker detected in negative mode and ‘P’ indicates marker detected in positive mode.
RT (retention time) in minutes.
Table 2. List of Background-independent Metabolites for Chronic Alcohol Exposure in Ppara-null Mice.
| Marker | RTb | m/z | Trend | Identity | Possible Origin |
|---|---|---|---|---|---|
| N1 a | 0.6 | 221.066 | ↑ | Ethyl-β-D-glucuronide | Alcohol metabolism |
| N1a | 0.6 | 203.056 | ↑ | (N1-H2O) | Alcohol metabolism |
| N1b | 0.6 | 341.017 | ↑ | (N1+2HCO2H+CO) | Alcohol metabolism |
| N2 | 0.9 | 116.035 | ↑ | N-acetylglycine | Alcohol metabolism |
| N3 | 3.7 | 204.066 | ↑ | Indole-3-lactic acid | Tryptophan Metabolism |
| N17 | 3.3 | 165.055 | ↑ | Phenyllactic acid | Phenylalanine metabolism |
| P1 | 0.6 | 245.063 | ↑ | Ethyl-β-D-glucuronide + Na+ | Alcohol metabolism |
| P1a | 0.6 | 199.023 | ↑ | (P1-HCO2H) | Alcohol metabolism |
| P1b | 0.6 | 181.013 | ↑ | (P1-HCO2H-H2O) | Alcohol metabolism |
| P1c | 0.6 | 159.03 | ↑ | (P1-HCO2H-H2O-Na+ +H+) | Alcohol metabolism |
| P2 | 3.7 | 206.081 | ↑ | Indole-3-lactic acid | Tryptophan Metabolism |
| P2a | 3.7 | 188.071 | ↑ | P2-H2O | Tryptophan Metabolism |
| P2b | 3.7 | 160.076 | ↑ | P2-HCO2H | Tryptophan Metabolism |
‘N’ indicates marker detected in negative mode and ‘P’ indicates marker detected in positive mode.
RT (retention time) in minutes.
3.3. Metabolic Pathway Analysis
The ions contributing to the difference in the metabolic responses to alcohol exposure in wild-type and Ppara-null mice of B6 background were analyzed using MassTRIX in order to identify possible metabolic pathways affected by the alcohol treatment. The positive mode ionization data showed that metabolites related to tryptophan metabolism were upregulated following chronic alcohol exposure (Figure 2A). The number of potentially elevated tryptophan metabolites in Ppara-null mice gradually increased compared to that in the wild-type mice during the course of treatment. Analysis of the negative mode ionization data revealed that potential phenylalanine metabolites were also elevated in response to alcohol exposure in the wild-type mice (Figure 2B). However, while the number of elevated metabolites belonging to this pathway decreased with time in wild-type mice, the corresponding number of metabolites increased in Ppara-null mice. It is noteworthy that these observations with respect to the difference between the wild-type and Ppara-null mice are similar to that found in mice of the 129S background24 and indicated that modulations in the tryptophan and phenylalanine metabolic pathway may bear some genetic background-independent signature of alcohol exposure in Ppara-null mice.
Figure 2.
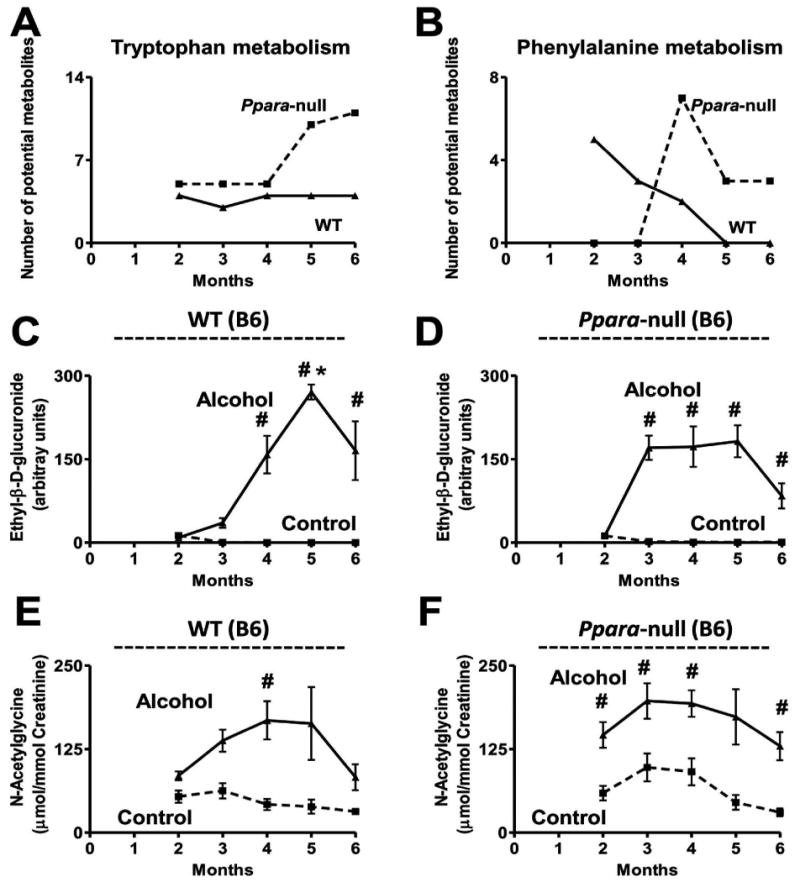
Effect of chronic alcohol consumption on tryptophan, phenylalanine, and alcohol metabolism in B6 mice. Variation in the number of putative metabolites, predicted by MassTRIX analysis, elevated in (A) tryptophan metabolism detected in ESI+ mode and (B) phenylalanine metabolism detected in ESI- mode, during alcohol treatment. The solid and dotted lines represent the response of the wild-type and Ppara-null mice, respectively. (C) Variation in the urinary abundance of ethyl-β-D-glucuronide in the control (dotted line) and alcohol-treated (solid line) wild-type and (D) Ppara-null mice. (E) Variation in the urinary excretion of N-acetylglycine in the control (dotted line) and alcohol-treated (solid line) wild-type and (F) Ppara-null mice. Oneway ANOVA with Bonferroni's correction for multiple comparisons was used to estimate statistical significance of the variation of the metabolites on alcohol-treatment. One-way ANOVA with Bonferroni's correction for multiple comparisons was used to estimate statistical significance of the variation of the metabolites on alcohol-treatment within same background. #, significantly different (P < 0.05) from control mice of same genotype and *, significantly different (P < 0.05) from alcohol-treated Ppara-null mice.
3.4. Identification and Quantitation of Metabolites
Ion N1 was identified as the deprotonated form of ethyl-β-D-glucuronide (C8H14O7) by comparison with an authentic standard. The urinary abundance of this metabolite in the control mice was negligible (Figure 2C and 2D). Similar to the 129S mice, the urinary abundance of the alcohol metabolite increased in alcohol-treated mice of the B6 background after 3 months of alcohol treatment. Unlike the 129S mice, there was no significant difference between alcohol-treated wild-type and Ppara-null mice of the B6 background with respect to excretion of this metabolite except for a 5-fold higher abundance in the urine of Ppara-null mice compared to their wild-type counterparts at 3 months (p < 0.0005). However, unlike the 129S mice, the B6 mice did not show any elevation in the excretion of ethylsulfate on alcohol-treatment (data not shown).
The ion N2 was identified as N-acetylglycine by comparison with an authentic standard. This ion was elevated in both wild-type and Ppara-null mice of B6 as well as 129S background. The wild-type B6 mice showed a gradual elevation of this metabolite in the urine reaching 5-fold by four months (p < 0.05) in response to alcohol treatment (Figure 2E). The Ppara-null B6 mice showed a 2-fold elevation in the urinary excretion of this metabolite until four months and an increased to 3-fold by six months (p < 0.005) in response to alcohol treatment (Figure 2F). Urinary N-acetylglycine excretion in the wild-type 129S mice (Supplementary Figure S3A) on control diet was negligible. The alcohol-treated wild-type 129S mice showed a 8-to-10-fold increase in the excretion of this metabolite starting from 2 months of alcohol treatment (p < 0.05) (Supplementary Figure S3A). Alcohol-treated Ppara-null mice also showed increased excretion of this metabolite reaching a 15-fold elevation after five months (p < 0.0005) (Supplementary Figure S3B). The excretion of this metabolite in the alcohol-treated Ppara-null mice of the 129S background was 12- and 7-fold higher after five (p < 0.0005) and six (p < 0.005) months of treatment, respectively, compared to their wild-type counterparts.
Comparison of retention time and fragmentation pattern of N19 with authentic standard identified the ion as N-hexanoylglycine. The urinary excretion of this metabolite in control B6 Ppara-null mice (Supplementary Figure S3C) was 2-to-5-fold higher (p < 0.05) than the wild-type counterparts (Supplementary Figure S3D). The alcohol-treated Ppara-null B6 mice also showed 3-to-5-fold higher (p < 0.05) urinary excretion of the metabolite than their wild-type counterparts. The urinary excretion of this metabolite was found to increase only marginally (not statistically significant) after alcohol treatment of wild-type mice (Supplementary Figure S3C). However, alcohol-treated Ppara-null mice showed 1.5-fold elevation (p < 0.05) of the metabolite at four and five months compared to the mice on control diet (Supplementary Figure S3D). The urinary excretion of this metabolite in the control and alcohol-treated Ppara-null 129S mice (Supplementary Figure S3E) was also found to be 6-to-70 (p < 0.05, except at three and six months) and 3-to-10-fold higher compared to their wild-type counterparts (Supplementary Figure S3F). The alcohol-treated Ppara-null B6 mice also showed a nine-fold elevation (p < 0.005) in urinary excretion of the metabolite than the wild-type counterparts after five months. Alcohol treatment was found to result in result in marginal elevation in excretion of this metabolite except a 3-fold elevation (p < 0.005) in the Ppara-null mice at six months (Supplementary Figure S3E and S3F).
N22, which was identified as taurine, showed the opposite trend of modulation in urinary excretion in case of B6 and 129S mice in response to alcohol treatment. Taurine excretion in the urine of B6 mice tended to decrease after alcohol treatment (Figure 3A and 3B). In addition, it was noted that the taurine concentrations in the control as well as alcohol treated wild-type B6 mice were 2- to 3-fold (p < 0.05) lower than in their Ppara-null counterparts. On the other hand, wild-type 129S mice showed approximately 2-fold increase in taurine excretion following alcohol-treatment (Figure 3C). The alcohol-treated Ppara-null 129S mice showed 1.5-fold increase in urinary excretion after two months (p < 0.005) which increased to 5-fold at three months followed by a steady 2-fold elevation 4 month onwards (p < 0.005) (Figure 3D). There was no significant difference in taurine excretion between the wild-type and Ppara-null 129S mice on control diet. However, the alcohol-treated Ppara-null mice showed 1.5-fold (p < 0.05) elevation in taurine excretion compared to their wild-type counterparts.
Figure 3.
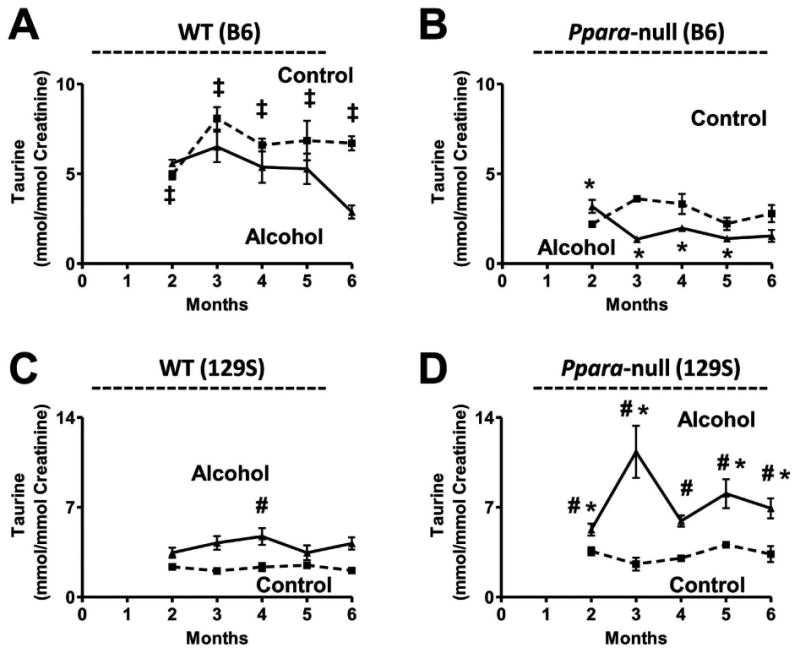
Genetic background-dependent changes in taurine excretion. Depletion of urinary taurine excretion in (A) wild-type and (B) Ppara-null mice on the B6 background in response to chronic alcohol consumption. Elevation in urinary taurine excretion in (C) wild-type and (D) Ppara-null mice on the 129S background in response to chronic alcohol consumption. Dotted and solid lines represent the variation in the urinary excretion of taurine in control and alcohol diet-fed mice of the respective genotypes and backgrounds. One-way ANOVA with Bonferroni's correction for multiple comparisons was used to estimate statistical significance of the variation of the metabolites on alcohol-treatment within same background. ‡, significantly different (P < 0.05) from the Ppara-null mice of same treatment group; #, significantly different (P < 0.05) from control mice of same genotype and *, significantly different (P < 0.05) from alcohol-treated wild-type mice.
Excretion of 2-hydroxyphenylacetic acid was found to be depleted 3- and 2- fold after four (p < 0.0005) and five (p < 0.005) months of alcohol treatment, respectively, in the urine of alcohol-treated wild-type B6 mice compared to the mice on control diet (Figure 4A). The urinary excretion of this metabolite was also found to decrease by 3- and 2- fold after three (p < 0.005) and four (p < 0.005) months of alcohol treatment, respectively, in the urine of alcohol-treated wild-type B6 mice compared to control mice.
Figure 4.

Genetic background-dependent changes in the urinary excretion of aromatic amino acid metabolites. Lower urinary excretion of 2-hydroxyphenylacetic acid in (A) wild-type and (B) Ppara-null mice on the B6 background. Variation in the urinary excretion of xanthurenic acid in (C) wild-type and (D) Ppara-null mice on the B6 background as well as that in the (E) wild-type and (F) Ppara-null mice on the 129S background. Dotted and solid lines respectively represent the variation in the urinary excretion of the metabolite in control diet and alcoholic diet-treated mice of the respective genotype and background. One-way ANOVA with Bonferroni's correction for multiple comparisons was used to estimate statistical significance of the variation of the metabolites on alcohol-treatment within same background. #, significantly different (P < 0.05) from control mice of same genotype.
MRM-based quantitation revealed that there was no consistent elevation in the excretion of 4-hydroxyphenylacetic acid in the urine of alcohol-treated wild-type B6 mice (Supplementary Figure S4B) except for a 4- and 3.5-fold elevation at four (p < 0.005) and five (p < 0.0005) months, respectively. However, unlike that in case of the 129S mice, there was no effect on the urinary excretion of this metabolite on alcohol treatment of Ppara-null B6 mice (Supplementary Figure S4B). In addition, although the urinary abundance of its sulfate conjugate, 4-hydroxyphenylacetic acid sulfate, was unaffected by alcohol treatment in B6 mice, the urinary abundance of the sulfate conjugate in the wild-type mice was generally higher than that in the Ppara-null mice (Supplementary Figure S4C and S4D).
Ion P21 was identified as xanthurenic acid by comparison with an authentic standard. This metabolite was found to elevated by 1.5-fold (p < 0.05) in the urine of alcohol-treated Ppara-null B6 mice while the alcohol-treated wild-type B6 mice showed a 2-fold (p < 0.0005) depletion compared to their respective counterparts on control-diet. The urinary excretion of this metabolite was also elevated in response to alcohol treatment in the Ppara-null B6 mice by 2.5- and 2-fold at four (p < 0.005) and six (p < 0.05) months, respectively. However, the wild-type B6 mice did not show any significant increase in the urinary excretion of the metabolite except for a 1.5-fold (p < 0.05) elevation at four months. The alcohol treatment was found to cause only marginal elevation in the abundance of this metabolite in the urine of 129S mice. The elevation of this metabolite in response to alcohol treatment was insignificant except for a 1.5-fold increase in both wild-type (p < 0.05) and Ppara-null (p < 0.005) mice at four months.
The urinary excretion of pimelic acid (Supplementary Figure S5A and S5B) as well as adipic acid (data not shown) in B6 mice were found to be unaffected by alcohol treatment. Suberic acid excretion in wild-type B6 mice was also unaffected by alcohol treatment (Supplementary Figure S5C and S5D). The Ppara-null B6 mice showed only marginal but statistically insignificant decrease in the urinary excretion of suberic acid in response to alcohol treatment. The urinary excretion of suberic acid was also unaffected in 129S mice on alcohol treatment. However, control 129S Ppara-null mice were found to have 3-fold elevated excretion of suberic acid (p < 0.05) compared to their wild-type counterparts (Supplementary Figure S5E and S5F). Similarly, alcohol-treated 129S Ppara-null mice were found to have 6- to 12-fold elevated excretion of suberic acid (p < 0.05, except at four and five months) compared to their wild-type counterparts.
The urinary excretion of indole-3-lactic acid (P2) in the wild-type B6 mice was unaffected by alcohol-treatment (Figure 5A). However, it was significantly elevated in Ppara-null mice in response to chronic alcohol treatment (Figure 5B). The urinary excretion of indole-3-lactic acid was elevated by 1.5-, 2-, and 2-fold after two (p < 0.005), five (p < 0.0005) and six (p < 0.0005) months of alcohol treatment, respectively. The indole-3-lactic levels in the alcohol-treated Ppara-null urines were also 2-fold higher (p < 0.05) than that in the alcohol-treated wild-type mice during this period. However, no significant change in the urinary excretion of tryptophan (Supplementary Figure S6A and S6B) or indole-3-pyruvic acid (Supplementary Figure S6C and S6D) was detected in the alcohol-treated Ppara-null mice compared to the control or alcohol-treated wild-type mice.
Figure 5.
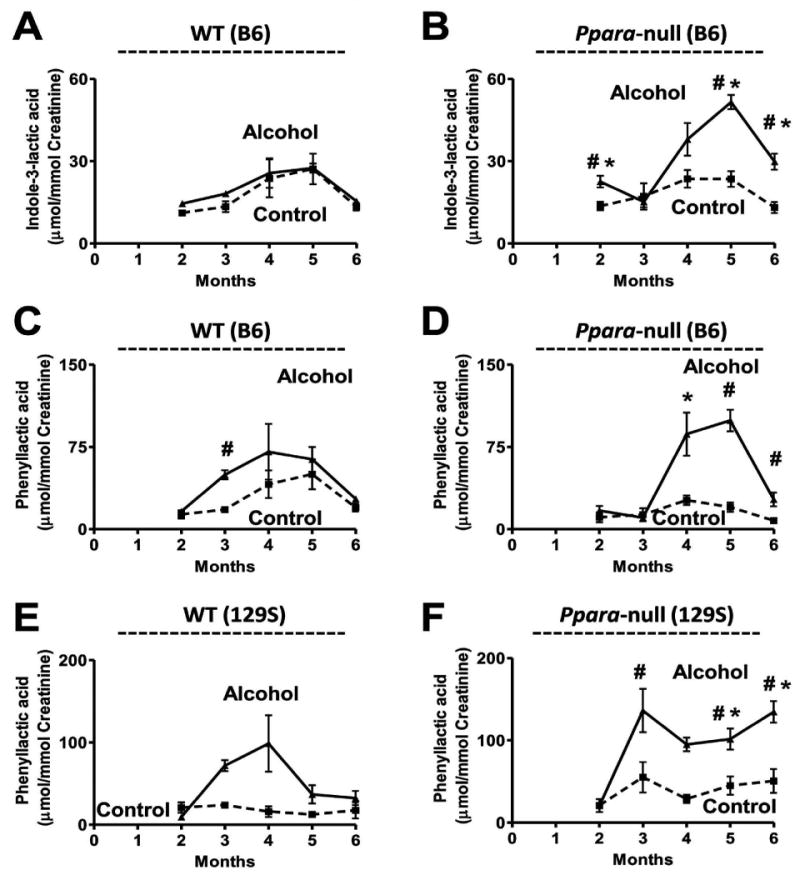
Genetic background-independent elevation of phenylalanine and tryptophan metabolites in mouse model of ALD. Variation in the urinary excretion of indole-3-lactic acid in (A) wild-type and (B) Ppara-null mice on the B6 background. Variation in the urinary excretion of phenyllactic acid in (C) wild-type and (D) Ppara-null mice on the B6 background as well as that in the (E) wild-type and (F) Ppara-null mice on the 129S background. Dotted and solid lines respectively represent the variation in the urinary excretion of the metabolite in control diet and alcoholic diet-treated mice of the respective genotype and background. One-way ANOVA with Bonferroni's correction for multiple comparisons was used to estimate statistical significance of the variation of the metabolites on alcohol-treatment within same background. ‡, significantly different (P < 0.05) from the Ppara-null mice of same treatment group; #, significantly different (P < 0.05) from control mice of same genotype and *, significantly different (P < 0.05) from alcohol-treated wild-type mice.
The ion N17 (retention time = 3.3 min, m/z = 165.055-) was identified as phenyllactic acid by comparing the retention time and fragmentation pattern with authentic standard. Chronic alcohol treatment of B6 Ppara-null mice were found to elevate the urinary excretion of this metabolite by 4-, 5- and 3.5-fold after four, five (p < 0.05), and six (p < 0.005) months of alcohol treatment compared to the control mice (Figure 5D). The B6 wild-type mice on the other hand, did not show any significant increase in the abundance except a 2.5-fold elevation (p < 0.0005) at three months (Figure 5C). Interestingly, this metabolite was also found to increase in the urine of alcohol-treated 129S Ppara-null mice. The urinary excretion of this metabolite was elevated by 2-fold after three and five months (p < 0.05) and 3-fold after six months (p < 0.005) of alcohol-treatment in Ppara-null mice compared to control mice. The abundance of this metabolite in the urine of alcohol-treated 129S Ppara-null mice was also 3- and 4.5-fold higher than alcohol-treated wild-type mice after five (p < 0.005) and six (p < 0.0005) months of alcohol treatment, respectively. However, the excretion of phenylalanine was found to be unaffected in the alcohol-treated Ppara-null mice of both B6 (Supplementary Figure S7B) and 129S (Supplementary Figure S7D) background compared to the control mice.
In summary, these results showed that, unlike that observed in case of 129S mice24, there was no significant change in the urinary excretion of 2-hydroxyphenylacetic acid, 4-hydroxyphenylacetic acid, 4-hydroxyphenylacetic acid sulfate, pimelic acid, and adipic acid on alcohol treatment of Ppara-null mice on B6 background. In addition, modulation of taurine excretion was opposite in alcohol-treated B6 and 129S mice. However, the change in excretion of ethyl-β-D-glucuronide, phenyllactic acid, and indole-3-lactic acid due to chronic alcohol exposure was similar between mice of B6 and 129S background.
4. Discussion
Both histology and liver triglyceride measurements revealed an increase in lipid deposition in the alcohol-treated Ppara-null mice after one month indicating the onset of steatosis. This suggested that, similar to the mice of 129S background23, 24, alcohol-treated B6 Ppara-null mice also served as a model for early stages of ALD development. However, no statistically significant increase in liver enzyme activities that are commonly used to assess liver damage could be detected at this point. On the other hand, mass spectrometry-based metabolomic analysis was able to clearly segregate the control mice from their alcohol-treated counterparts from the start of the metabolomics study (two months of alcohol treatment). It should be noted that apart from the presence of alcohol metabolites, changes in the abundances of endogenous metabolites contributed significantly to the segregation of the metabolome. Additionally, the metabolomic signature also revealed distinct metabolic responses to alcohol treatment in wild-type and Ppara-null B6 mice. However, it is interesting and important to note in this study that the B6 and 129S had intrinsic differences in their urinary metabolomes. The fact that such differences existed despite maintaining the mice under near-identical conditions (food, cages, temperature, and humidity), and were not overshadowed by gene deletion (PPARα knockout) and/or xenobiotic (alcohol) exposure, testifies to the importance of genetic background in defining the metabotype.
In keeping with the differences in genetic background of the B6 and 129S mice, a number of metabolites were differentially modulated in response to alcohol. In fact, alcohol metabolism itself was different between these two strains of mice. Unlike the 129S mice, the B6 mice showed no elevation in ethylsulfate. Although ethyl-β-D-glucuronide was elevated in B6 mice, no significant difference between the wild-type and Ppara-null mice, similar to that in case of 129S mice24, was observed with respect to the excretion of the glucuronide conjugate. However, N-acetyglycine was significantly elevated in the Ppara-null mice of both B6 and 129S background in response to alcohol treatment. Earlier studies have reported elevation of N-acetyglycine on alcohol intake in mice26. Alcohol is either oxidized in liver to acetic acid via acetaldehyde or converted to phase II metabolites, such as ethylsulfate and ethylglucuronide. Apart from its participation in numerous metabolic pathways, such as glycolysis, Krebs cycle, fatty acid biosynthesis, and amino acid metabolism in the form of acetyl-CoA, acetic acid can also undergo conjugation, presumably by glycine transferases, to be converted and excreted as N-acetylglycine leading to an increase in the urinary abundance of the metabolite in alcohol-treated mice.
Taurine is a sulfur-containing amino acid that is produced via oxidation of cysteine. Alcohol consumption is known to result in the formation of reactive oxygen species (ROS) causing increase in oxidative stress36, 37. Here, taurine was found to be elevated in the urine of alcohol-treated 129S Ppara-null mice. On the other hand, B6 mice showed a marginal decrease in taurine excretion on alcohol treatment. An earlier study demonstrated that ROS generation was significantly higher and the expression of antioxidant response genes, such as glutathione synthetase (GSS) and superoxide dismutases (SOD), significantly lower in the liver of 129S mice compared to the B6 mice in response to high-fat diet although strains developed comparable liver pathologies29. Thus, increased taurine excretion in the 129S mice might be a result of higher ROS production in the 129S mice. In addition, the fact that alcohol-treated 129S Ppara-null mice showed a significantly higher elevation in taurine levels compared to the wild-type mice is a manifestation of elevated ROS production in alcohol-treated Ppara-null mice as reported earlier22. On the other hand, the inherent elevated expression of anti-oxidant response genes in B6 mice29 might be responsible for the reduction in ROS levels and cysteine oxidation. Thus, taurine excretion appears to be a metabolomic signature of the background-dependent variation in defense mechanism against alcohol-induced oxidative stress.
Although they could be produced via phenylalanine and tyrosine metabolism, 2-hydroxyphenylacetatic acid and 4-hydroxyphenylacetatic acid levels were found to be influenced by gut microbes in a recent study using germ-free mice38. Thus, the observed differences between the B6 and 129S mice with respect to the excretion of these metabolites in response to chronic alcohol treatment might be a reflection of characteristic differences in the gut microbiome. The difference in the gut microbial metabolism in B6 and 129S is also evident from the differential modulation of a number of phase II metabolites. The gut microbiome has been shown to play a significant role in influencing the abundance of glycine-, taurine-, glucuronide-, and sulfate-conjugates38, 39. The present results showed that the excretion of N-hexanoylglycine, ethyl sulfate, and 4-hydroxyphenylacetatic acid sulfate was different not only between the two strains, but also between wild-type and Ppara-null mice of same background. These results are in line with the growing body of evidence on the role of that metagenome in defining biochemical traits and controlling pathophysiological processes.
MassTRIX analysis showed that the tryptophan metabolism was differentially affected in Ppara-null mice on chronic alcohol exposure compared to their wild-type counterparts on both B6 and 129S backgrounds. A number of genes involved in tryptophan metabolism are regulated by PPARα40. Tryptophan is metabolized to 3-hydroxy-L-kynurenine in three steps with intermediate formation of L-formylkynurenine and L-kynurenine. This metabolite may either undergo hydrolysis to produce 3-hydroxy anthranilate or deamination to produce 4-(2-amino-3-hydroxyphenyl)-2,4-dioxobutanoate. 3-Hydroxyanthranilate is then oxidized to 2-amino-3-carboxymuconate semialdehyde which is converted to either NAD+ through quinolinic acid or acetyl Co-A. Earlier studies have shown that the activity of the first enzyme (ACMSD) involved in the catabolic process is regulated by PPARα41. In wild-type mice, suppression of this gene by PPARα promotes NAD+ biosynthesis41. On the other hand, upregulation of this gene in Ppara-null mice results in activation of the tryptophan catabolic pathway and impairs NAD+ biosynthesis. Impairment of NAD+ biosynthesis through quinolinic acid results in redistribution of fluxes through tryptophan metabolism, which is evident from the significant elevation of xanthurenic acid in B6 Ppara-null mice. Presumably, the build-up of 3-hydroxykynurenine as a result of impaired NAD+ biosynthesis increases the production of 4-(2-Amino-3-hydroxyphenyl)-2,4-dioxobutanoate, which undergoes spontaneous dehydration and cyclization to xanthurenic acid. However, 129S Ppara-null mice showed insignificant increase in the xanthurenic acid levels reflecting genetic background-dependent mechanism of redistribution of fluxes through tryptophan metabolic pathways.
NAD+ is an essential cofactor for the oxidation of fatty acid through both β- and ω-oxidation pathways. The impairment of NAD+ biosynthesis leaves Ppara-null mice more prone to fat deposition in the liver compared to their wild-type counterparts. Alcohol is oxidized stepwise by, mainly, alcohol dehydrogenase (EC 1.1.1.2) and aldehyde dehydrogenase (EC 1.2.1.3) to acetaldehyde and acetic acid, respectively (Figure 6). Both of these reactions are associated with concomitant reduction of NAD+ to NADH. Thus, chronic alcohol consumption leads to a drastic shift in the redox balance in Ppara-null mice and impairs fatty acid oxidation leading to fat deposition or steatosis as shown earlier in the 129S Ppara-null mice23 and indicated by increasing hepatic triglyceride content in B6 Ppara-null mice.
Figure 6.
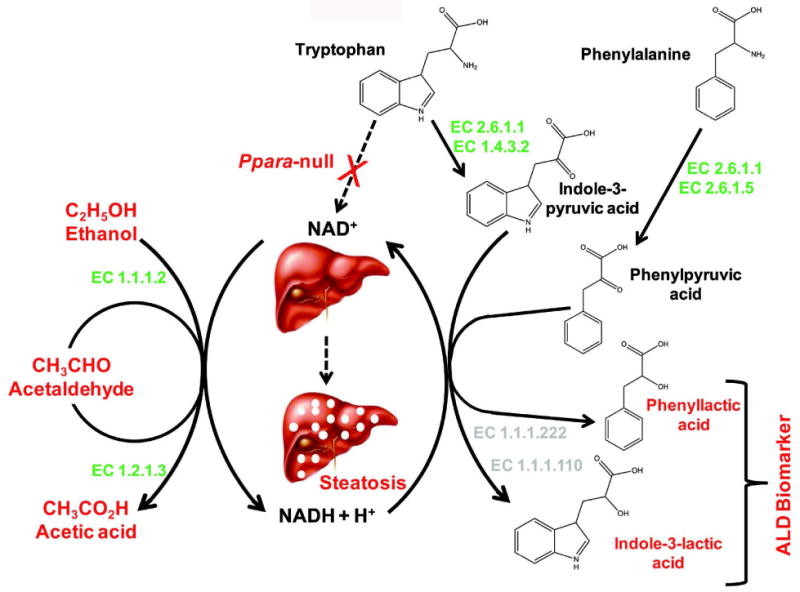
Biochemical mechanism behind elevation of genetic background-independent biomarkers of alcohol-induced liver disease in the alcohol-treated Ppara-null mice. Consumption of NAD+ for the oxidation of alcohol along with concomitant impairment of NAD+ biosynthesis leads in a marked shift in the redox balance and increase in NADH/NAD+ ratio. This results in significant impairment of fatty acid β-oxidation in Ppara-null mice leading to steatosis. The increase in aspartate aminotransferase activity (EC 2.6.1.1) associated with concurrent liver damage might help the deamination of phenylalanine and tryptophan to produce α-keto acids; phenylpyruvic acid and indole-3-pyruvic acid, respectively. The increase in NADH/NAD+ ratio subsequently drives the reduction α-keto acid intermediates to the corresponding α-hydroxy acids, i.e., phenyllactic acid and indole-3-lactic acid.
In the earlier study, elevated urinary excretion of indole-3-lactic acid was found to be associated with development of steatosis in 129S Ppara-null mice24. This metabolite was found to be elevated in the urine of alcohol-treated B6 Ppara-null mice as well. Indole-3-lactic acid is an α-hydroxy acid and the reduction product of deaminated tryptophan. The deamination of tryptophan is typically carried out by L-amino acid oxidase (EC 1.4.3.2). Earlier studies have shown that microbial as well as mammalian aspartate aminotransferases (EC 2.6.1.1) can also catalyze this reaction, albeit with low efficiency42, 43. However, aspartate aminotransferase is known to be elevated during alcohol-induced liver damage in the Ppara-null mice23. Thus, the unused tryptophan, resulting from impairment of NAD+ biosynthesis in Ppara-null mice41 and decrease in activity of tryptophan-2,3-doxygenase during chronic alcohol consumption44, could be converted to indole-3-pyruvic acid by the action of aspartate aminotransferase and/or L-amino acid oxidase (Figure 6). This α-keto acid intermediate would readily be reduced to indole-3-lactic acid due to build-up of NADH during chronic alcohol consumption. Thus, the increase in indole-3-lactic acid production appears to be related to the same biochemical events, i.e., impairment of NAD+ biosynthesis and an increase in the NADH/NAD+ ratio that leads to steatosis as well as an increase in aminotransferase activity that is associated with concurrent liver damage in both 129S and B6 mice. Although the enzymes responsible for interconversion of indole-3-lactic acid and indole-3-pyruvic acid, i.e., indolelactate dehydrogenase (EC 1.1.1.110) or (R)-4-hydroxyphenyllactate dehydrogenase (EC 1.1.1.222), have been characterized in microbes45, no mouse equivalent has been reported. However, the conversion of tryptophan to indole-3-lactate by the action of aminotranseferases and NADH-dependent aromatic lactate dehydrogenases, as proposed here (Figure 6), has already been documented in the protozoa Leishmania donovani46. Thus the observed elevation in indole-3-lactic acid excretion during ALD development in alcohol-treated Ppara-null mice suggests the possibility of existence of similar and hitherto unknown metabolic machinery in mammals.
In addition, another α-hydroxy acid, namely, phenyllactic acid was also found to be elevated in the urine of both B6 and 129S Ppara-null mice in response to chronic alcohol consumption. This is also the reduction product of corresponding deaminated aromatic amino acid, phenylalanine. Apart from tyrosine aminotransferase (EC 2.6.1.5), aspartate aminotransferase can also catalyze the deamination of phenylalanine to phenylpyruvic acid43, 47. However, the shift in the redox balance in the alcohol-treated Ppara-null mice would drive the reduction of this intermediate to phenyllactate by the action of (R)-4-hydroxyphenyllactate dehydrogenase (EC 1.1.1.222)48 as shown in Figure 6.
The exclusive elevation of α-hydroxy acids in the alcohol-treated Ppara-null mice strongly indicates to the existence of some common enzymatic pathway linked to process of alcohol-induced liver injury and steatosis. The fact that these were found to be elevated in a genetic background-independent manner further strengthens the proposed mechanistic association between the biochemical events. However, they also point to our lack of understanding of biochemical processes related to aromatic amino acid metabolism, particularly, under pathological conditions and, therefore, invite further studies.
5. Conclusions
In this study, alteration of a number of alcohol and endogenous metabolites in response to chronic alcohol consumption was found to be genetic background-dependent. In humans, response to chronic alcohol consumption widely varies between different populations and even within populations. These results indicate that metabolomic analysis can help to capture a wide-angle view of varying biochemical responses to alcohol. However, despite widespread genetic background-related differences in the metabolic response, the observation of conserved metabolic signatures of chronic alcohol consumption in Ppara-null mice i.e., elevation of indole-3-lactic acid and phenyllactic acid was remarkable. In addition, existing literature suggests that the production of these metabolites may be a simultaneous reflection of the elevation in liver enzymes as well change in the redox balance associated with ALD pathogenesis. One of the major drawbacks of the liver enzyme assays that are frequently used as assess liver damage is their non-specificity. The proposed mechanistic relation between the elevation of these urinary metabolites and the biochemical events associated with steatosis caused by chronic alcohol consumption in these mice consolidates their candidature as potential biomarkers and may, eventually, lead to the development of noninvasive diagnostic tests for early stages of ALD. However, it should be emphasized that the applicability of these biomarkers in humans and their specificity towards ALD has yet to be determined. Appropriate studies must be undertaken to test their validity in human ALD and their orthogonality to other liver diseses/disorders. Nevertheless, the ability of metabolomics to simultaneously capture genetic background-dependent variations in metabolism and reveal genetic background-independent metabolic signatures of steatosis offers a promising opportunity to identify robust early non-invasive biomarkers of ALD to improve the therapeutic outcome and quality of life.
Supplementary Material
Acknowledgments
This work was supported by the National Cancer Institute Intramural Research Program and the National Institute of Environmental Health Sciences grant (U01ES016013) to AJF and FJG.
Standard Abbreviations
- ALD
alcohol-induced liver disease
- PPARα
peroxisome proliferator-activated receptor alpha
- Ppara-null
peroxisome proliferator-activated receptor alpha knockout mouse model
- ALT
alanine aminotransferase
- AST
aspartate aminotransferase
- UPLC-ESI-QTOF-MS
ultraperformance liquid chromatography coupled with electrospray ionization quadrupole time-of-flight mass spectrometry
- ESI+
electrospray ionization in positive mode
- ESI-
electrospray ionization in negative mode
- MRM
multiple reaction monitoring
- PCA
principal components analysis
- OPLS
orthogonal projection to latent structures
- ANOVA
analysis of variance
- NAD+
oxidized nicotinamide adenine dinucleotide
- NADH
reduced nicotinamide adenine dinucleotide
Footnotes
Associated Content: Supporting Information: This material is available free of charge via the Internet at http://pubs.acs.org.
References
- 1.Mandayam S, Jamal MM, Morgan TR. Epidemiology of alcoholic liver disease. Semin Liver Dis. 2004;24(3):217–32. doi: 10.1055/s-2004-832936. [DOI] [PubMed] [Google Scholar]
- 2.Shibuya A, Yoshida A. Genotypes of alcohol-metabolizing enzymes in Japanese with alcohol liver diseases: a strong association of the usual Caucasian-type aldehyde dehydrogenase gene (ALDH1(2)) with the disease. Am J Hum Genet. 1988;43(5):744–8. [PMC free article] [PubMed] [Google Scholar]
- 3.Pirmohamed M, Kitteringham NR, Quest LJ, Allott RL, Green VJ, Gilmore IT, Park BK. Genetic polymorphism of cytochrome P4502E1 and risk of alcoholic liver disease in Caucasians. Pharmacogenetics. 1995;5(6):351–7. doi: 10.1097/00008571-199512000-00003. [DOI] [PubMed] [Google Scholar]
- 4.Tanaka F, Shiratori Y, Yokosuka O, Imazeki F, Tsukada Y, Omata M. High incidence of ADH2*1/ALDH2*1 genes among Japanese alcohol dependents and patients with alcoholic liver disease. Hepatology. 1996;23(2):234–9. doi: 10.1053/jhep.1996.v23.pm0008591846. [DOI] [PubMed] [Google Scholar]
- 5.Zintzaras E, Stefanidis I, Santos M, Vidal F. Do alcohol-metabolizing enzyme gene polymorphisms increase the risk of alcoholism and alcoholic liver disease? Hepatology. 2006;43(2):352–61. doi: 10.1002/hep.21023. [DOI] [PubMed] [Google Scholar]
- 6.Sherva R, Rice JP, Neuman RJ, Rochberg N, Saccone NL, Bierut LJ. Associations and interactions between SNPs in the alcohol metabolizing genes and alcoholism phenotypes in European Americans. Alcohol Clin Exp Res. 2009;33(5):848–57. doi: 10.1111/j.1530-0277.2009.00904.x. [DOI] [PMC free article] [PubMed] [Google Scholar]
- 7.Auguet T, Vidal F, Broch M, Olona M, Aguilar C, Morancho B, Lopez-Dupla M, Quer JC, Sirvent JJ, Richart C. Polymorphisms in the interleukin-10 gene promoter and the risk of alcoholism and alcoholic liver disease in Caucasian Spaniard men. Alcohol. 2010;44(3):211–6. doi: 10.1016/j.alcohol.2010.02.007. [DOI] [PubMed] [Google Scholar]
- 8.Linneberg A, Gonzalez-Quintela A, Vidal C, Jorgensen T, Fenger M, Hansen T, Pedersen O, Husemoen LL. Genetic determinants of both ethanol and acetaldehyde metabolism influence alcohol hypersensitivity and drinking behaviour among Scandinavians. Clin Exp Allergy. 2010;40(1):123–30. doi: 10.1111/j.1365-2222.2009.03398.x. [DOI] [PubMed] [Google Scholar]
- 9.O'Shea RS, Dasarathy S, McCullough AJ. Alcoholic liver disease. Am J Gastroenterol. 2010;105(1):14–32. doi: 10.1038/ajg.2009.593. [DOI] [PubMed] [Google Scholar]
- 10.Chen AC, Manz N, Tang Y, Rangaswamy M, Almasy L, Kuperman S, Nurnberger J, Jr, O'Connor SJ, Edenberg HJ, Schuckit MA, Tischfield J, Foroud T, Bierut LJ, Rohrbaugh J, Rice JP, Goate A, Hesselbrock V, Porjesz B. Single-nucleotide polymorphisms in corticotropin releasing hormone receptor 1 gene (CRHR1) are associated with quantitative trait of event-related potential and alcohol dependence. Alcohol Clin Exp Res. 2010;34(6):988–96. doi: 10.1111/j.1530-0277.2010.01173.x. [DOI] [PMC free article] [PubMed] [Google Scholar]
- 11.Hoyert DL, Heron MP, Murphy SL, Kung HC. Deaths: final data for 2003. Natl Vital Stat Rep. 2006;54(13):1–120. [PubMed] [Google Scholar]
- 12.Welte J, Barnes G, Wieczorek W, Tidwell MC, Parker J. Alcohol and gambling pathology among U.S. adults: prevalence, demographic patterns and comorbidity. J Stud Alcohol. 2001;62(5):706–12. doi: 10.15288/jsa.2001.62.706. [DOI] [PubMed] [Google Scholar]
- 13.Grove J, Brown AS, Daly AK, Bassendine MF, James OF, Day CP. The RsaI polymorphism of CYP2E1 and susceptibility to alcoholic liver disease in Caucasians: effect on age of presentation and dependence on alcohol dehydrogenase genotype. Pharmacogenetics. 1998;8(4):335–42. doi: 10.1097/00008571-199808000-00007. [DOI] [PubMed] [Google Scholar]
- 14.Wong NA, Rae F, Bathgate A, Smith CA, Harrison DJ. Polymorphisms of the gene for microsomal epoxide hydrolase and susceptibility to alcoholic liver disease and hepatocellular carcinoma in a Caucasian population. Toxicol Lett. 2000;115(1):17–22. doi: 10.1016/s0378-4274(00)00166-1. [DOI] [PubMed] [Google Scholar]
- 15.Teli MR, Day CP, Burt AD, Bennett MK, James OF. Determinants of progression to cirrhosis or fibrosis in pure alcoholic fatty liver. Lancet. 1995;346(8981):987–90. doi: 10.1016/s0140-6736(95)91685-7. [DOI] [PubMed] [Google Scholar]
- 16.Schutte K, Bornschein J, Malfertheiner P. Hepatocellular carcinoma--epidemiological trends and risk factors. Dig Dis. 2009;27(2):80–92. doi: 10.1159/000218339. [DOI] [PubMed] [Google Scholar]
- 17.Sherman M. Hepatocellular carcinoma: New and emerging risks. Dig Liver Dis. 2010;42 3:S215–22. doi: 10.1016/S1590-8658(10)60508-7. [DOI] [PubMed] [Google Scholar]
- 18.Levitsky J, Mailliard ME. Diagnosis and therapy of alcoholic liver disease. Semin Liver Dis. 2004;24(3):233–47. doi: 10.1055/s-2004-832937. [DOI] [PubMed] [Google Scholar]
- 19.Sharpe PC. Biochemical detection and monitoring of alcohol abuse and abstinence. Ann Clin Biochem. 2001;38(Pt 6):652–64. doi: 10.1258/0004563011901064. [DOI] [PubMed] [Google Scholar]
- 20.Cadranel JF, Rufat P, Degos F. Practices of liver biopsy in France: results of a prospective nationwide survey. For the Group of Epidemiology of the French Association for the Study of the Liver (AFEF) Hepatology. 2000;32(3):477–81. doi: 10.1053/jhep.2000.16602. [DOI] [PubMed] [Google Scholar]
- 21.Martin PG, Guillou H, Lasserre F, Dejean S, Lan A, Pascussi JM, Sancristobal M, Legrand P, Besse P, Pineau T. Novel aspects of PPARalpha-mediated regulation of lipid and xenobiotic metabolism revealed through a nutrigenomic study. Hepatology. 2007;45(3):767–77. doi: 10.1002/hep.21510. [DOI] [PubMed] [Google Scholar]
- 22.Rakhshandehroo M, Sanderson LM, Matilainen M, Stienstra R, Carlberg C, de Groot PJ, Muller M, Kersten S. Comprehensive analysis of PPARalpha-dependent regulation of hepatic lipid metabolism by expression profiling. PPAR Res. 2007;2007:26839. doi: 10.1155/2007/26839. [DOI] [PMC free article] [PubMed] [Google Scholar]
- 23.Nakajima T, Kamijo Y, Tanaka N, Sugiyama E, Tanaka E, Kiyosawa K, Fukushima Y, Peters JM, Gonzalez FJ, Aoyama T. Peroxisome proliferator-activated receptor alpha protects against alcohol-induced liver damage. Hepatology. 2004;40(4):972–80. doi: 10.1002/hep.20399. [DOI] [PubMed] [Google Scholar]
- 24.Manna SK, Patterson AD, Yang Q, Krausz KW, Li H, Idle JR, Fornace AJ, Jr, Gonzalez FJ. Identification of noninvasive biomarkers for alcohol-induced liver disease using urinary metabolomics and the Ppara-null mouse. J Proteome Res. 2010;9(8):4176–88. doi: 10.1021/pr100452b. [DOI] [PMC free article] [PubMed] [Google Scholar]
- 25.Loftus N, Barnes A, Ashton S, Michopoulos F, Theodoridis G, Wilson I, Ji C, Kaplowitz N. Metabonomic investigation of liver profiles of nonpolar metabolites obtained from alcohol-dosed rats and mice using high mass accuracy MSn analysis. J Proteome Res. 2011;10(2):705–13. doi: 10.1021/pr100885w. [DOI] [PMC free article] [PubMed] [Google Scholar]
- 26.Bradford BU, O'Connell TM, Han J, Kosyk O, Shymonyak S, Ross PK, Winnike J, Kono H, Rusyn I. Metabolomic profiling of a modified alcohol liquid diet model for liver injury in the mouse uncovers new markers of disease. Toxicol Appl Pharmacol. 2008;232(2):236–43. doi: 10.1016/j.taap.2008.06.022. [DOI] [PMC free article] [PubMed] [Google Scholar]
- 27.Fernando H, Kondraganti S, Bhopale KK, Volk DE, Neerathilingam M, Kaphalia BS, Luxon BA, Boor PJ, Shakeel Ansari GA. (1)H and (3)(1)P NMR lipidome of ethanol-induced fatty liver. Alcohol Clin Exp Res. 2010;34(11):1937–47. doi: 10.1111/j.1530-0277.2010.01283.x. [DOI] [PMC free article] [PubMed] [Google Scholar]
- 28.Nguyen PV, Abel T, Kandel ER, Bourtchouladze R. Strain-dependent differences in LTP and hippocampus-dependent memory in inbred mice. Learn Mem. 2000;7(3):170–9. doi: 10.1101/lm.7.3.170. [DOI] [PMC free article] [PubMed] [Google Scholar]
- 29.Syn WK, Yang L, Chiang DJ, Qian Y, Jung Y, Karaca G, Choi SS, Witek RP, Omenetti A, Pereira TA, Diehl AM. Genetic differences in oxidative stress and inflammatory responses to diet-induced obesity do not alter liver fibrosis in mice. Liver Int. 2009;29(8):1262–72. doi: 10.1111/j.1478-3231.2009.02036.x. [DOI] [PMC free article] [PubMed] [Google Scholar]
- 30.Liu J, Corton C, Dix DJ, Liu Y, Waalkes MP, Klaassen CD. Genetic background but not metallothionein phenotype dictates sensitivity to cadmium-induced testicular injury in mice. Toxicol Appl Pharmacol. 2001;176(1):1–9. doi: 10.1006/taap.2001.9262. [DOI] [PubMed] [Google Scholar]
- 31.Pearson K. On lines and planes of closest fit to systems of points in space. Philosophical Magazine. 1901;2(6):559–572. [Google Scholar]
- 32.Suhre K, Schmitt-Kopplin P. MassTRIX: mass translator into pathways. Nucleic Acids Res. 2008;36(Web Server issue):W481–4. doi: 10.1093/nar/gkn194. [DOI] [PMC free article] [PubMed] [Google Scholar]
- 33.Kind T, Fiehn O. Seven Golden Rules for heuristic filtering of molecular formulas obtained by accurate mass spectrometry. BMC Bioinformatics. 2007;8:105. doi: 10.1186/1471-2105-8-105. [DOI] [PMC free article] [PubMed] [Google Scholar]
- 34.Cui Q, Lewis IA, Hegeman AD, Anderson ME, Li J, Schulte CF, Westler WM, Eghbalnia HR, Sussman MR, Markley JL. Metabolite identification via the Madison Metabolomics Consortium Database. Nat Biotechnol. 2008;26(2):162–4. doi: 10.1038/nbt0208-162. [DOI] [PubMed] [Google Scholar]
- 35.Smith CA, O'Maille G, Want EJ, Qin C, Trauger SA, Brandon TR, Custodio DE, Abagyan R, Siuzdak G. METLIN: a metabolite mass spectral database. Ther Drug Monit. 2005;27(6):747–51. doi: 10.1097/01.ftd.0000179845.53213.39. [DOI] [PubMed] [Google Scholar]
- 36.Albano E. Alcohol, oxidative stress and free radical damage. Proc Nutr Soc. 2006;65(3):278–90. doi: 10.1079/pns2006496. [DOI] [PubMed] [Google Scholar]
- 37.Das SK, Vasudevan DM. Alcohol-induced oxidative stress. Life Sci. 2007;81(3):177–87. doi: 10.1016/j.lfs.2007.05.005. [DOI] [PubMed] [Google Scholar]
- 38.Wikoff WR, Anfora AT, Liu J, Schultz PG, Lesley SA, Peters EC, Siuzdak G. Metabolomics analysis reveals large effects of gut microflora on mammalian blood metabolites. Proc Natl Acad Sci U S A. 2009;106(10):3698–703. doi: 10.1073/pnas.0812874106. [DOI] [PMC free article] [PubMed] [Google Scholar]
- 39.Nicholson JK, Wilson ID. Opinion: understanding ‘global’ systems biology: metabonomics and the continuum of metabolism. Nat Rev Drug Discov. 2003;2(8):668–76. doi: 10.1038/nrd1157. [DOI] [PubMed] [Google Scholar]
- 40.Cariello NF, Romach EH, Colton HM, Ni H, Yoon L, Falls JG, Casey W, Creech D, Anderson SP, Benavides GR, Hoivik DJ, Brown R, Miller RT. Gene expression profiling of the PPAR-alpha agonist ciprofibrate in the cynomolgus monkey liver. Toxicol Sci. 2005;88(1):250–64. doi: 10.1093/toxsci/kfi273. [DOI] [PubMed] [Google Scholar]
- 41.Shin M, Kim I, Inoue Y, Kimura S, Gonzalez FJ. Regulation of mouse hepatic alpha-amino-beta-carboxymuconate-epsilon-semialdehyde decarboxylase, a key enzyme in the tryptophan-nicotinamide adenine dinucleotide pathway, by hepatocyte nuclear factor 4alpha and peroxisome proliferator-activated receptor alpha. Mol Pharmacol. 2006;70(4):1281–90. doi: 10.1124/mol.106.026294. [DOI] [PubMed] [Google Scholar]
- 42.Recasens M, Benezra R, Basset P, Mandel P. Cysteine sulfinate aminotransferase and aspartate aminotransferase isoenzymes of rat brain. Purification, characterization, and further evidence for identity. Biochemistry. 1980;19(20):4583–9. doi: 10.1021/bi00561a007. [DOI] [PubMed] [Google Scholar]
- 43.Yagi T, Kagamiyama H, Motosugi K, Nozaki M, Soda K. Crystallization and properties of aspartate aminotransferase from Escherichia coli B. FEBS Lett. 1979;100(1):81–4. doi: 10.1016/0014-5793(79)81135-7. [DOI] [PubMed] [Google Scholar]
- 44.Morland J. Effect of chronic ethanol treatment on tryptophan oxygenase, tyrosine aminotransferase and general protein metabolism in the intact and perfused rat liver. Biochem Pharmacol. 1974;23(1):21–35. doi: 10.1016/0006-2952(74)90310-4. [DOI] [PubMed] [Google Scholar]
- 45.Jean M, DeMoss RD. Indolelactate dehydrogenase from Clostridium sporogenes. Can J Microbiol. 1968;14(4):429–35. doi: 10.1139/m68-068. [DOI] [PubMed] [Google Scholar]
- 46.Leelayoova S, Marbury D, Rainey PM, Mackenzie NE, Hall JE. In vitro tryptophan catabolism by Leishmania donovani donovani promastigotes. J Protozool. 1992;39(2):350–8. doi: 10.1111/j.1550-7408.1992.tb01329.x. [DOI] [PubMed] [Google Scholar]
- 47.Owen TG, Hochachka PW. Purification and properties of dolphin muscle aspartate and alanine transaminases and thier possible roles in the energy metabolism of diving mammals. Biochem J. 1974;143(3):541–53. doi: 10.1042/bj1430541. [DOI] [PMC free article] [PubMed] [Google Scholar]
- 48.Bode R, Lippoldt A, Birnbaum D. Purification and properties of D-aromatic lactate dehydrogenase, an enzyme involved in the catabolism of the aromatic amino acids of Candida maltosa. Biochem Physiol Pflanz. 1986;181:189–198. [Google Scholar]
Associated Data
This section collects any data citations, data availability statements, or supplementary materials included in this article.