

Abstract
Objectives
To assess the relationship between sex hormones and natriuretic peptide levels in community-based adults
Background
Women have higher circulating natriuretic peptide concentrations than men, but the mechanisms for these sex-related differences and the impact of hormone therapy are unclear. Experimental studies suggest that androgens may suppress natriuretic peptide secretion.
Methods
We measured plasma N-terminal pro-B-type natriuretic peptide (NT-proBNP), total testosterone, and sex hormone binding globulin (SHBG) in 4,056 men and women (mean age 40±9 years) from the Framingham Heart Study Third Generation cohort. Sex/hormone status was grouped as: 1) men, 2) postmenopausal women not receiving hormone replacement therapy, 3) premenopausal women not receiving hormonal contraceptives, 4) postmenopausal women receiving hormone replacement therapy and 5) premenopausal women receiving hormonal contraceptives.
Results
Circulating NT-proBNP was associated with sex/hormone status (overall P<0.0001). Men had lower NT-proBNP than women of all menopause or hormone groups, and women receiving hormonal contraceptives had higher NT-proBNP than women who were not receiving hormone therapy (all P<0.0001). These relationships remained significant after adjusting for age, body mass index, and cardiovascular risk factors. Across sex/hormone status groups, FT decreased and SHBG increased in tandem with increasing NT-proBNP. In sex-specific analyses, NT-proBNP decreased across increasing quartiles of free testosterone in men (P for trend<0.01) and in women (P for trend<0.0001). Adjustment for FT markedly attenuated the association between sex/hormone status and NT-proBNP concentrations.
Conclusions
These findings suggest that lower circulating androgens and the potentiating effect of exogenous female hormone therapy contribute to the higher circulating NT-proBNP concentrations in women.
Keywords: natriuretic peptides, sex, hormones
INTRODUCTION
The importance of understanding the effects of sex and hormone therapy on the cardiovascular system is underscored by the pronounced sex differences in the prevalence of cardiovascular disease, the increase in cardiovascular events in women following menopause, and concerns regarding the safety of hormone replacement therapy (HRT) in postmenopausal women. (1–3) Studies of circulating cardiovascular biomarkers, such as the natriuretic peptides (NPs),(4–8) may provide a biologic basis to better understand these sex-related differences in cardiovascular risk. The NPs exert hormonal (vasodilation, natriuresis and aldosterone and endothelin suppression) and autocrine/paracrine (anti-hypertrophic, anti-fibrotic and pro-angiogenic) protective cardiovascular effects. Sex is one of the strongest determinants of circulating B-type NP (BNP) or N-terminal proBNP (NT-proBNP) in population-based studies, with women having consistently higher circulating levels than men.(4–7) Nonetheless, the mechanisms underlying the sex-based difference in circulating NPs have not been established. Further, the effect of menstrual status, menopausal status, or exogenous hormone therapy on plasma BNP concentrations in women remains unclear.(6,8–10)
Previous studies have suggested that sex hormones play an important role in the regulation of NPs.(11) On one hand, estrogens have been shown to exert a stimulating effect on the NP system,(9,12) and are therefore postulated to mediate the “NP excess” in women compared to men. On the other hand, recent experimental(13,14) and cross-sectional human data(8,15) suggest that androgens may exert an inhibitory effect on the NP system, thus accounting for the lower NP levels in men and potentially explaining the lack of cardiovascular protection in men compared with women.(8) However, prior clinical studies of the influence of androgens on NPs were limited to studying women(8,16) or children,(15) and did not fully characterize both endogenous (menstrual phase) and exogenous (hormone therapy) variations. Further, previous investigations did not include measures of insulin resistance, which is a potential confounder since hyperinsulinemia is known to be associated with both sex hormones (hyperandrogenemia) and lowered NP concentrations.(17–20)
We aimed to test the hypothesis that free testosterone is an important determinant of the relationship between sex and hormone status with circulating NPs in adults from the general population. Specifically, we hypothesized that higher free testosterone levels, in men compared to women, and in women with hormone therapy compared to those not receiving hormone therapy, may be related to lower circulating NPs. To achieve our aim, we measured testosterone and its primary binding protein, NP levels, and insulin measures in a large, community-based sample of predominantly middle-aged adults grouped by sex, menstrual status and the presence or absence of hormone therapy.
METHODS
Study sample
The Framingham Heart Study(21) is a community-based cohort investigation that began in 1948 with the recruitment of the Original Cohort, recruited a second generation in 1971 consisting of offspring of the Original Cohort and their spouses (Offspring Cohort), and most recently added a third generation in 2002 consisting of children of the Offspring Cohort (Third Generation Cohort). Participants of the youngest cohort (Third Generation Cohort), in whom plasma NT-proBNP concentrations were measured, were eligible for the current study. Those with prevalent heart failure (prior diagnosis of heart failure based on Framingham criteria(22)), myocardial infarction, or serum creatinine > 2 mg/dL were excluded from the present investigation (N=26). The index examinations took place during the period of April 2002 to July 2005. All women had menstrual histories recorded by trained physicians using standardized questionnaires, including details regarding reproductive history, first day of the last menstrual period, frequency and regularity of menstrual cycles, as well as current usage of any hormone therapy. Participants were instructed to bring all their current medications (taken within one month) with them to the examination, allowing verification by the examining physician. Anthropometric, blood pressure, and cardiovascular risk factor data were obtained at the index visit using standard protocols. All participants provided written informed consent and protocols were approved by the Boston University Medical Center Institutional Review Board.
Classification of sex/hormone status
Menopause was defined as the cessation of periods (in the absence of pregnancy) for at least 1 year due to naturally-occurring (as opposed to surgical or medical) causes. Among postmenopausal women, those receiving HRT were defined by self-reported current usage of female hormone therapy, as well as validation by direct assessment of all the participant’s current medications by the examining physician. Among premenopausal women, those receiving hormonal contraceptives (HC) were defined by self-reported current usage of hormone-containing oral pills, injections or implants for birth control or medical indications, as well as validation by direct assessment of all the participant’s current medications by the examining physician. Based on these definitions, sex/hormone status was classified into 5 categories (Figure 1):
Figure 1. Classification of sex/hormone status.

Flowchart illustrates the classification of sex/hormone status into: 1) Men; 2) Postmenopausal women not receiving hormone replacement therapy (HRT); 3) Premenopausal women not receiving hormonal contraceptives (HC); 4) Current HRT users; and 5) Current HC users. The age range of participants in each group is indicated in brackets.
Men
Postmenopausal women not receiving HRT
Premenopausal women not receiving HC
Postmenopausal women receiving HRT currently
Premenopausal women receiving HC currently
In secondary analyses, we estimated the menstrual phase (follicular versus luteal versus mid-cycle) at the index visit among premenopausal women with regular ongoing menstrual cycles (cycle lengths 28 to 30 days) who were not receiving HC. This determination was based on the fact that the interval from ovulation to menstruation (luteal phase) is fixed at 14 days, whereas the interval from the start of menstruation to ovulation (follicular phase) can vary depending on cycle length, as previously established (23) and widely applied in similar studies.(24–27) Thus, using the date of the examination, date of onset of the last menstrual period and menstrual cycle length (both specifically ascertained at the index examination), we derived the duration of the follicular phase in each regularly-cycling woman, allowing 4 days between the follicular and luteal phases for the mid-cycle phase. The calculated durations were then used to assess whether NT-proBNP measurement on the date of the index visit occurred in the follicular, mid-cycle, or luteal phase of the menstrual cycle.
Measurement of circulating NT-proBNP, testosterone, and SHBG
Venous blood was drawn under fasting conditions between 8–9 AM. Samples were immediately stored at −70 degrees Celsius and analyzed in batches in 2009, allowing minimization of interassay variability and effects of temporal drift in the laboratory measurements. Plasma NT-proBNP was measured using a standard immunoassay (Roche Diagnostics), with a measurement range of 5 ng/L to over 35,000 ng/L and intra-assay coefficient of variation of 2.7%. Serum total testosterone concentrations were quantified using a validated liquid chromatography-tandem mass spectrometry assay, with a lower detection limit of 2 ng/dl. Sex hormone binding globulin (SHBG) concentrations were measured using an immunofluorometric assay (DELFIA-Wallac, Inc., Turku, Finland). Total testosterone concentrations are influenced by multiple factors, such as obesity in men and oral contraceptive therapy in women, and may not reflect androgen activity. We thus calculated free testosterone (FT) using the law of mass action equation(28,29) and used FT in subsequent analyses.
Measurement of insulin resistance
Insulin resistance (IR) was calculated using the homeostatic model assessment (HOMA) equation: HOMA-IR = (FPG x FPI)/22.5, where FPG = fasting plasma glucose in mmol/l, and FPI = fasting plasma insulin in mU/l measured by ELISA (Linco Research, Millipore Bioscience Division).(30)
Statistical analyses
The association between log NT-proBNP and sex/hormone status was assessed using general linear models followed by pair-wise comparisons between sex/hormone status groups with Bonferroni correction. The model was adjusted for covariates known to influence NT-proBNP concentrations (age, body mass index, systolic blood pressure, diastolic blood pressure, serum creatinine, and presence of antihypertensive medications, diabetes mellitus and current smoking). We similarly assessed the association of log FT and log SHBG with sex/hormone status. Out of a total of 2165 women (Figure 1), menopause status was unclear or not due to natural causes in 186, HC usage was unknown in 341, and FT/SHBG measurements or clinical covariates were missing in a further 25, leaving 1613 women in the final multivariable models for sex/hormone status.
To assess the association between log NT-proBNP and circulating androgens, we used sex-pooled and sex-specific general linear models, where the dependent variable was log NT-proBNP and predictors were log FT or log SHBG (separately), hormone status (among women; categories 2–5 of sex/hormone status as defined above) and covariates (listed above). We tested for interaction between log FT or log SHBG and hormone status among women, and adjusted models for HOMA-IR among non-diabetics. To further assess the association between sex/hormone status, log NT-proBNP and circulating androgens, we analyzed multivariable models (sex-pooled and in women alone), where the dependent variable was log NT-proBNP and predictors sequentially included clinical covariates (listed above), sex/hormone status groups (defined above), and log FT. We assessed the beta coefficients for each sex/hormone status group, compared to the referent group of premenopausal women receiving HC, before and after adding log FT to the model. We also compared the Type I sum of squares to the Type III sum of squares values for the class variable sex/hormone status in order to assess the % variability in NT-proBNP due to sex/hormone status before (Type I sum of squares) and after (Type III sum of squares) the addition of log FT to the model, adjusting for all other covariates. Out of a total of 2165 women and 1891 men, FT measurements were available in 2144 women and 1880 men, while SHBG measurements were available in 2147 women and 1880 men. Of these, there were no missing clinical covariates (age, body mass index, systolic blood pressure, diastolic blood pressure, serum creatinine, antihypertensive medications, diabetes mellitus, and smoking) in 2123 women with FT measurements, 2126 women with SHBG measurements, and 1871 men. In addition to clinical covariates, HOMA-IR measurements were also available in 1857 women with FT measurements, 1859 women with SHBG measurements, and 1650 men.
In the subgroup of premenopausal women with regular menstrual cycles in the absence of HC, we compared log NT-proBNP concentrations among menstrual phases (follicular/mid-cycle/ luteal) using general linear models with Bonferroni correction in pair-wise comparisons between phases. We similarly compared log FT and log SHBG concentrations among menstrual phase groups. Models were adjusted for covariates known to influence NT-proBNP concentrations (listed above).
All analyses were performed using SAS software. Statistical significance was determined at a P value of <0.05 (or a Bonferroni-adjusted significance level required P < 0.05/ [number of possible comparisons] in cases of multiple comparisons). All authors had full access to the data and take responsibility for the integrity of the data.
RESULTS
Baseline characteristics
Characteristics of the study sample (N=4056, mean age 40 years) are shown in Table 1. As expected in a predominantly middle-aged, community-based sample, the prevalence of cardiovascular risk factors was low and the majority (83%) of women were premenopausal (Figure 1). Among premenopausal women, 23% (n=417) were currently receiving HC; while among postmenopausal women, 21% (n=40) were currently receiving HRT. HRT consisted predominantly of oral combination therapy with estrogen and progesterone (n=34, 85%). Of note, the age range of participants was relatively narrow, even among postmenopausal women.
Table 1.
Baseline characteristics
| All | Men | Women | |
|---|---|---|---|
| N | 4,056 | 1,891 | 2,165 |
| Age, years | 40±9 | 40±9 | 40±9 |
| Body mass index, kg/m2 | 26.9±5.6 | 28.0±4.7 | 26.0±6.1 |
| Systolic blood pressure, mmHg | 117±14 | 121±13 | 113±14 |
| Diastolic blood pressure, mmHg | 75±10 | 78±9 | 73±9 |
| Serum creatinine, mg/dl | 0.79±0.15 | 0.90±0.13 | 0.70±0.11 |
| Hypertension, % | 16 | 21 | 12 |
| Antihypertensive medications, % | 8 | 10 | 7 |
| Diabetes mellitus, % | 3 | 4 | 2 |
| Smoking, % | 17 | 18 | 16 |
| NT-proBNP, ng/L, Q2 (Q1, Q3) | 28.1 (14.1, 52.6) | 16.2 (8.1, 28.8) | 42.9 (25.7, 72.2) |
| Log NT-proBNP | 3.3 ± 1.0 | 2.7 ± 0.9 | 3.7 ± 0.8 |
| Free testosterone, pg/ml, Q2 (Q1, Q3) | 5.3 (2.1, 114.5) | 119.0 (95.0, 152.0) | 2.2 (1.4, 3.2) |
| Total testosterone, ng/dl, Q2 (Q1, Q3) | 49.6 (23.7, 600.2) | 617.7 (487.5, 786.1) | 24.6 (17.7, 34.3) |
| Sex hormone-binding globulin, nmol/l, Q2 (Q1, Q3) | 55.1 (35.2, 96.1) | 37.0 (26.7, 50.2) | 89.7 (58.7, 132.7) |
| HOMA-IR, Q2 (Q1, Q3) | 5.9 (4.2, 8.9) | 6.6 (4.7, 10.0) | 5.3 (3.9, 7.9) |
Values are mean±SD unless otherwise stated. Q2 (Q1, Q3) denote median (25th, 75th percentiles).
To convert free testosterone concentration to SI units (pmol/l), multiply values in pg/ml by 3.47; to convert total testosterone concentration to SI units (nmol/l), multiple values in ng/dl by 0.0347.
HOMA-IR, homeostatic model assessment of insulin resistance
Association between sex/hormone status and circulating NT-proBNP
Log NT-proBNP was strongly associated with sex/hormone status (age-adjusted P<0.0001; Figure 2A), with the lowest concentrations in men and highest concentrations in premenopausal women receiving HC. These relationships remained unchanged after adjusting for age, body mass index, systolic blood pressure, diastolic blood pressure, serum creatinine, and presence of antihypertensive medications, diabetes mellitus and smoking. In pair-wise comparisons, men had lower plasma NT-proBNP than women regardless of menopause status or hormone therapy (Bonferroni-corrected P<0.0001). Among premenopausal women, NT-proBNP was higher in those receiving HC (Bonferroni-corrected P<0.0001). Among postmenopausal women, there was no difference in circulating NT-proBNP between current HRT users and non-users (multivariable-adjusted P=0.39). In additional analyses including an interaction term between year of blood collection and gender, there was no evidence for an interaction.
Figure 2. Association of sex/hormone status with circulating NT-proBNP, testosterone and sex hormone-binding globulin.

[A] Columns and bars represent the age-adjusted least squares means and standard errors of log NT-proBNP by sex/hormone status (1=men, 2=postmenopausal women not receiving hormone replacement therapy [HRT], 3=premenopausal women not receiving hormonal contraceptives [HC], 4=postmenopausal HRT users and 5=premenopausal HC users). P value for the association between NT-proBNP and sex/hormone status overall; for pair-wise comparisons within sex/hormone status groups please refer to the text.
[B] Bivariate plot showing the age-adjusted least squares means and standard errors of log free testosterone (FT; horizontal axis) and log NT-proBNP (vertical axis) in each sex/hormone status group.
[C] Bivariate plot showing the age-adjusted least squares means and standard errors of log sex hormone-binding globulin (SHBG; horizontal axis) and log NT-proBNP (vertical axis) in each sex/hormone status group.
Association between circulating NT-proBNP, FT, and SHBG
As expected, men had the highest FT concentrations, whereas women receiving HC had the lowest FT and highest SHBG concentrations. Across sex/hormone status groups, FT decreased and SHBG increased in tandem with increasing NT-proBNP (Figure 2B–C).
In sex-stratified analyses, NT-proBNP was lower in the highest quartiles of FT in both men (Figure 3A) and women (Figure 3B). Log NT-proBNP was inversely related to log FT and directly related to log SHBG both men and women (Table 2). After adjusting for age, body mass index, systolic blood pressure, diastolic blood pressure, serum creatinine, antihypertensive medications, diabetes, and smoking, the association between log NT-proBNP and log FT was significant in women (P<0.0001) but not men (P=0.78). Each unit increase in log FT was associated with a 20% decrease in NT-proBNP among women, adjusting for clinical covariates. Results were similar after further adjusting for HOMA-IR among non-diabetics. In both sexes, log NT-proBNP was related to log SHBG in multivariable analyses (P<0.0001). Each unit increase in log SHBG was associated with a 19% increase in NT-proBNP among men, and a 40% increase in NT-proBNP among women, adjusting for clinical covariates. There was no interaction between menopause or hormone status and log FT or log SHBG.
Figure 3. Association between circulating NT-proBNP and free testosterone.
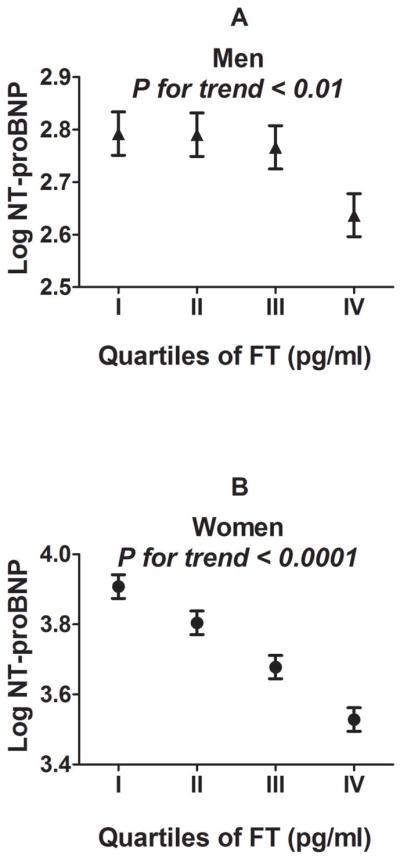
Least squares means and standard errors of log NT-proBNP are shown for each sex-specific quartile (I-IV) of free testosterone (FT) in men (triangles; A) and women (circles; B) respectively.
Table 2.
Association between circulating NT-proBNP, testosterone and sex hormone-binding globulin
| Men | Women | |||
|---|---|---|---|---|
| Association with log NT-proBNP | Beta* (SE) | P value | Beta* (SE) | P value |
|
Entire sample Single variable |
||||
| Log free testosterone | −0.30 (0.11) | 0.007 | −0.54 (0.05) | <0.0001 |
| Log sex hormone-binding globulin | 0.23 (0.03) | <0.0001 | 0.23 (0.02) | <0.0001 |
|
| ||||
|
Entire sample Multivariable† |
||||
| Log free testosterone | −0.03 (0.11) | 0.78 | −0.47 (0.06) | <0.0001 |
| Log sex hormone-binding globulin | 0.12 (0.03) | <0.0001 | 0.25 (0.02) | <0.0001 |
|
| ||||
|
Non-diabetics only Multivariable‡ |
||||
| Log free testosterone | −0.05 (0.12) | 0.65 | −0.45 (0.06) | <0.0001 |
| Log sex hormone-binding globulin | 0.13 (0.03) | 0.0001 | 0.24 (0.02) | <0.0001 |
Beta coefficients represent the mean change in log NT-proBNP per 1 SD difference in log free testosterone or log sex hormone-binding globulin; For single variable analyses, N=1880 in men (both models); 2144 in women (model containing log free testosterone); and 2147 in women (model containing log sex hormone-binding globulin).
Adjusted for age, body mass index, systolic blood pressure, diastolic blood pressure, serum creatinine, antihypertensive medications, diabetes mellitus, and smoking; N=1871 in men (both models); 2123 in women (model containing log free testosterone); and 2126 in women (model containing log sex hormone-binding globulin).
Adjusted for age, body mass index, systolic blood pressure, diastolic blood pressure, serum creatinine, antihypertensive medications, smoking and homeostatic model assessment of insulin resistance; N=1650 in men (both models); 1857 in women (model containing log free testosterone); and 1859 in women (model containing log sex hormone-binding globulin).
In the entire sample, sex/hormone status explained 38% of the variability in NT-proBNP in multivariable models adjusted for age, body mass index, systolic blood pressure, diastolic blood pressure, serum creatinine, and presence of antihypertensive medications, diabetes mellitus and smoking. This effect was larger than the contribution of any other clinical covariate. The addition of log FT to multivariable models adjusted for age, body size and cardiovascular risk factors led to attenuation of the differences in log NT-proBNP among sex/hormone status groups (Table 3). After adding log FT to the multivariable model, clinical sex/hormone status only explained 1% of the variability of NT-proBNP.
Table 3.
Multivariable models assessing the association between sex/hormone status, androgens and NT-proBNP concentrations
| Model without FT | Model with FT | |||
|---|---|---|---|---|
| Association with log NT-proBNP | Beta* (SE) | P value | Beta* (SE) | P value |
| Entire sample (N=3484) | ||||
| Men | −1.12 (0.05) | <0.0001 | −0.51 (0.14) | 0.0004 |
| Postmenopausal women without HRT | −0.46 (0.09) | <0.0001 | −0.35 (0.09) | 0.0001 |
| Premenopausal women without HC | −0.25 (0.05) | <0.0001 | −0.14 (0.05) | 0.008 |
| Postmenopausal women with HRT | −0.34 (0.14) | 0.015 | −0.24 (0.14) | 0.083 |
| Premenopausal women with HC | Referent | Referent | Referent | Referent |
| Log FT | - | - | −0.27 (0.06) | <0.0001 |
|
| ||||
| Women only (N=1613) | ||||
| Postmenopausal women without HRT | −0.35 (0.09) | 0.0001 | −0.17 (0.10) | 0.073 |
| Premenopausal women without HC | −0.22 (0.05) | <0.0001 | −0.05 (0.06) | 0.385 |
| Postmenopausal women with HRT | −0.25 (0.14) | 0.069 | −0.09 (0.14) | 0.499 |
| Premenopausal women with HC | Referent | Referent | Referent | Referent |
| Log FT | - | - | −0.43 (0.07) | <0.0001 |
FT, free testosterone; HRT, hormone replacement therapy; HC, hormonal contraceptives
Beta coefficients represent the mean difference in log NT-proBNP in the corresponding sex/hormone status group compared to premenopausal women receiving HC (referent group), or mean change in log NT-proBNP per 1 SD difference in log FT, adjusted for age, body mass index, systolic blood pressure, diastolic blood pressure, serum creatinine, antihypertensive medications, diabetes mellitus, and smoking
In women alone, the addition of log FT to multivariable models similarly led to attenuation of the differences in log NT-proBNP among menopause or hormone therapy groups (Table 3). Menopause and hormone status explained 14% of the variability in NT-proBNP in women, in multivariable models adjusted for clinical covariates, but only 2% after adding log FT to the multivariable model. Thus, the vast majority of the variability in NT-proBNP due to menopause and hormone status in women appeared to be attributable to differences in FT concentrations.
In analyses restricted to participants not taking any anti-hypertensive therapy, the associations between sex/hormone status, NT-proBNP and FT were unchanged (not shown).
Subgroup analysis by menstrual phase
Among 546 premenopausal women with regular menstrual cycles in the absence of HC (Table 4), NT-proBNP was lower in the mid-cycle phase than in the follicular or luteal phases (P=0.014 for mid-cycle vs. follicular phase; P=0.015 for mid-cycle vs. luteal phase; Bonferroni-corrected P<0.05 for both), in multivariable models. There was a corresponding trend toward higher FT in the mid-cycle phase compared with the follicular or luteal phases (P=0.045 for mid-cycle vs. follicular phase; P=0.099 for mid-cycle vs. luteal phase. When log FT was added to multivariable models, the association between menstrual phase and log NT-proBNP became non-significant. There was no association between SHBG and menstrual phase.
Table 4.
Subgroup analysis by menstrual phase
| Multivariable-adjusted* least-squares means (SE) | Menstrual Phase | P value | ||||
|---|---|---|---|---|---|---|
| Follicular (N=262) | Mid-cycle (N=70) | Luteal (N=214) | Follicular vs Mid-cycle | Follicular vs Luteal | Luteal vs Mid-cycle | |
| Log NT-proBNP | 3.71 (0.05) | 3.45 (0.09) | 3.71 (0.05) | 0.014 | 0.97 | 0.015 |
| Log free testosterone | 0.91 (0.03) | 1.05 (0.06) | 0.93 (0.04) | 0.045 | 0.642 | 0.100 |
| Log sex hormone-binding globulin | 4.33 (0.03) | 4.38 (0.05) | 4.33 (0.03) | 0.348 | 0.943 | 0.386 |
Adjusted for age, body mass index, systolic blood pressure, diastolic blood pressure, serum creatinine, antihypertensive medications, diabetes mellitus, and smoking
DISCUSSION
Principal findings
In a large sample of men and women from the general community, sex and exogenous hormone therapy were the largest determinants of variation in circulating NT-proBNP. Men had lower plasma NT-proBNP concentrations than women regardless of menopause status or hormone therapy, whereas women taking hormonal contraceptives had higher NT-proBNP concentrations than women without hormone therapy. Among sex/hormone status groups, men also had the highest free testosterone and lowest SHBG concentrations; conversely women taking hormonal contraceptives had the lowest free testosterone and highest SHBG concentrations. In both genders, increasing NT-proBNP was related to decreasing free testosterone and increasing SHBG concentrations. Accounting for free testosterone greatly attenuated the differences in circulating NT-proBNP among sex/hormone status groups, even after adjusting for known clinical covariates and restricting analyses to women. These findings are consistent with the hypothesis that androgens suppress NT-proBNP, and suggest that differences in free testosterone may largely explain the sex- and hormone-related differences in circulating natriuretic peptides.
Androgen regulation of natriuretic peptide concentrations
Several lines of evidence suggest that testosterone may exert a suppressive affect on the NP system and thus mediate a ‘BNP deficiency’ in men compared to women. In male rats, orchiectomy produces marked increases in plasma natriuretic peptides, and testosterone replacement restores natriuretic peptide concentrations to baseline.(14) In isolated perfused rat atria, testosterone suppresses volume-stimulated release of atrial natriuretic peptide.(13) However, contradictory results have also been reported regarding the effect of testosterone on atrial natriuretic peptide gene expression(31) and synthesis in cultured rat myocytes.(32) In clinical studies, inverse correlations between BNP and free testosterone have been observed in women in the Dallas Heart Study(8) and in a small Japanese study.(16) Androgen receptor antagonism for prostate cancer has been associated with large increases in NT-proBNP.(33) In male children and adolescents, associations of decreasing free testosterone, increasing SHBG, and increasing NT-proBNP have been noted.(15)
Our findings extend prior observations to a large community-based cohort of middle-aged men and women. The demonstrated association between NT-proBNP and androgens offers a potential unifying explanation for sex and hormonal status-related differences in natriuretic peptide concentrations. In men, low BNP concentrations may be related to the suppressive effects of high concentrations of free testosterone. A non-linear relationship with NT-proBNP at such high concentrations of free testosterone may explain the failure to detect a statistically significant relationship between free testosterone and NT-proBNP in men following multivariable adjustment. In women, free testosterone concentrations are more than 50-fold lower than in men, and are exquisitely sensitive to SHBG concentrations.
Estrogen regulation of natriuretic peptide concentrations
Previous studies have also shown that estrogens may exert a stimulatory effect on the NP system.(11) In female rats, pretreatment with estradiol and progesterone stimulated atrial natriuretic peptide gene expression.(31) In post-menopausal women, administration of estrogens produced a rise in plasma BNP.(9) A complex interplay of factors has been postulated, where estrogens modulate NP production via known effects on the renin-angiotensin system.(12)
Measurements of estradiol and estrone were not available for the current study, limiting our conclusions regarding the role of estrogens in mediating the observed difference in NT-proBNP levels. However, according to the hypothesis of a stimulatory effect of estrogens on NPs, we would have expected postmenopausal women and men to have similar NT-proBNP levels given their similar estrogen levels, yet NT-proBNP concentrations were much higher in the former. Similarly, based on higher endogenous estrogens in premenopausal than postmenopausal women, we would have expected higher NT-proBNP levels in the former, but levels were similar in the two groups. Lastly, given that the mid-cycle (ovulatory) phase of the menstrual cycle is associated with higher estrogen levels compared with the follicular or luteal phases, higher NT-proBNP levels would be expected mid-cycle, but levels were paradoxically lower in women at mid-cycle. Interestingly, each of the above observations can potentially be explained by variation in FT, which is highest in men, comparable in pre- and post-menopausal women, and higher during the mid-cycle phase than the follicular or luteal phases. These findings are consistent with prior studies showing that circulating NT-proBNP concentrations are not correlated with measured estradiol concentrations in females.(15,16)
Nonetheless, in the absence of direct measurements of estrogens, a role for estrogen-stimulated increases in NT-proBNP cannot be excluded. An explanation based purely on androgen suppressive effects would be inadequate to account for the known rapid fall in NP concentrations during the first year of life or the similar levels of NT-proBNP in male adolescents and male pre-pubertal children.(34) In aggregate, it is likely that both the stimulatory effects of estrogens and inhibitory effects of testosterone contribute to the regulation of BNP concentrations during the life course. The relative concentrations of these sex hormones may also be an important factor. Additional population-based studies including pre- and post-pubertal individuals of both sexes are warranted.
Circulating natriuretic peptides and use of hormone therapies
Previous studies examining the impact of HRT on BNP in postmenopausal women have produced conflicting results,(6,8–10) and none have examined the impact of hormonal contraceptives on circulating BNP in premenopausal women. Our study indicates that usage of hormonal contraceptives in premenopausal women is associated with higher circulating NT-proBNP compared to no usage. This may be due to direct stimulatory effects of estrogens on the NP system, to a reduction in free testosterone-mediated suppression of NT-proBNP secondary to increased SHBG from oral estrogens, or to indirect effects of oral estrogens and progestins acting via the renin-angiotensin system to modulate NP levels.(12) Consistent with previous studies,(8,16) we did not detect a significant association between naturally-occurring menopause and NT-proBNP concentrations after accounting for age, although relatively small numbers of postmenopausal women in our middle-aged sample may have limited our statistical power to detect a difference. We were similarly unable to demonstrate a significant association between usage of HRT and circulating NT-proBNP, in contrast to findings from Olmsted County.(6) This could be due to small numbers of HRT users in our current sample, since we included younger women who were recruited following publication of the Women’s Health Study and the nationwide reduction in HRT prescription rates.(2,35) Of note, the effects of exogenous female sex hormone therapies are known to vary with the route of administration,(36) formulation,(37) and composition; for example, progestogens in HC may exert both androgenic and anti-androgenic effects.(38) These details were not available in our study but represent important areas for future study.
Strengths and limitations
Strengths of this study include the large sample size, community-based design, careful recording of menstrual history, standardized examinations with routine blood collection, and uniform ascertainment of cardiovascular risk factors including insulin resistance. Measurements of estrogens and details regarding the individual hormone components of HC were not available. The accurate detection of an ovulatory cycle or hormonal changes in reproductive aging in women requires specific measurements of female sex hormones and gonadotropins. A role for estrogen-stimulated increases in circulating BNP cannot be excluded based on these data. FT was not directly measured, but estimated FT concentrations from total testosterone (by mass spectrometry) and SHBG (by radioimmunoassay) correlate well with direct measurements by equilibrium dialysis.(39–42) Biologically active atrial natriuretic peptide(43) and BNP(44) provide physiologically meaningful information but are less practical for measurement in large, ambulatory cohorts composed of predominantly healthy individuals, in part because of the high proportion of values censored by the detection limit of the mature natriuretic peptide assays.(4,5) We acknowledge the potential for residual confounding by unmeasured co-morbidities and their pharmacological therapies, as well as the limited ability to draw conclusions regarding causality from these observational data. Nonetheless, our findings are consistent with experimental data on the effects of testosterone on natriuretic peptides.
Conclusions
Circulating NT-proBNP was related to sex and exogenous hormone therapy in men and women from the general community. Suppression of natriuretic peptides by androgens may account for sex- and hormone-related differences in NT-proBNP concentrations. Given the known cardioprotective effects of BNP,(45) further studies are warranted to elucidate how these mechanisms may contribute to the well-described sex-related differences in cardiovascular risk.
Acknowledgments
Supported by NIH/NHLBI NO1-HC-25195 and R01-HL-086875. No relationships with industry.
Footnotes
Publisher's Disclaimer: This is a PDF file of an unedited manuscript that has been accepted for publication. As a service to our customers we are providing this early version of the manuscript. The manuscript will undergo copyediting, typesetting, and review of the resulting proof before it is published in its final citable form. Please note that during the production process errors may be discovered which could affect the content, and all legal disclaimers that apply to the journal pertain.
References
- 1.Grodstein F, Stampfer M. The epidemiology of coronary heart disease and estrogen replacement in postmenopausal women. Prog Cardiovasc Dis. 1995;38:199–210. doi: 10.1016/s0033-0620(95)80012-3. [DOI] [PubMed] [Google Scholar]
- 2.Rossouw JE, Anderson GL, Prentice RL, et al. Risks and benefits of estrogen plus progestin in healthy postmenopausal women: principal results From the Women’s Health Initiative randomized controlled trial. JAMA. 2002;288:321–33. doi: 10.1001/jama.288.3.321. [DOI] [PubMed] [Google Scholar]
- 3.Beral V. Breast cancer and hormone-replacement therapy in the Million Women Study. Lancet. 2003;362:419–27. doi: 10.1016/s0140-6736(03)14065-2. [DOI] [PubMed] [Google Scholar]
- 4.Wang TJ, Larson MG, Levy D, et al. Impact of age and sex on plasma natriuretic peptide levels in healthy adults. Am J Cardiol. 2002;90:254–8. doi: 10.1016/s0002-9149(02)02464-5. [DOI] [PubMed] [Google Scholar]
- 5.Vasan RS, Benjamin EJ, Larson MG, et al. Plasma natriuretic peptides for community screening for left ventricular hypertrophy and systolic dysfunction: the Framingham heart study. JAMA. 2002;288:1252–9. doi: 10.1001/jama.288.10.1252. [DOI] [PubMed] [Google Scholar]
- 6.Redfield MM, Rodeheffer RJ, Jacobsen SJ, Mahoney DW, Bailey KR, Burnett JC., Jr Plasma brain natriuretic peptide concentration: impact of age and gender. J Am Coll Cardiol. 2002;40:976–82. doi: 10.1016/s0735-1097(02)02059-4. [DOI] [PubMed] [Google Scholar]
- 7.Abdullah SM, Khera A, Das SR, et al. Relation of coronary atherosclerosis determined by electron beam computed tomography and plasma levels of n-terminal pro-brain natriuretic peptide in a multiethnic population-based sample (the Dallas Heart Study) Am J Cardiol. 2005;96:1284–9. doi: 10.1016/j.amjcard.2005.06.073. [DOI] [PubMed] [Google Scholar]
- 8.Chang AY, Abdullah SM, Jain T, et al. Associations among androgens, estrogens, and natriuretic peptides in young women: observations from the Dallas Heart Study. J Am Coll Cardiol. 2007;49:109–16. doi: 10.1016/j.jacc.2006.10.040. [DOI] [PubMed] [Google Scholar]
- 9.Maffei S, Del Ry S, Prontera C, Clerico A. Increase in circulating levels of cardiac natriuretic peptides after hormone replacement therapy in postmenopausal women. Clin Sci (Lond) 2001;101:447–53. [PubMed] [Google Scholar]
- 10.Kawano H, Nagayoshi Y, Soejima H, et al. B-type natriuretic peptide after hormone therapy in postmenopausal women with chest pain and normal coronary angiogram. Menopause. 2008;15:352–6. doi: 10.1097/gme.0b013e31806548f6. [DOI] [PubMed] [Google Scholar]
- 11.Clerico A, Fontana M, Vittorini S, Emdin M. The search for a pathophysiological link between gender, cardiac endocrine function, body mass regulation and cardiac mortality: proposal for a working hypothesis. Clin Chim Acta. 2009;405:1–7. doi: 10.1016/j.cca.2009.03.050. [DOI] [PubMed] [Google Scholar]
- 12.Kuroski de Bold ML. Estrogen, natriuretic peptides and the renin-angiotensin system. Cardiovasc Res. 1999;41:524–31. doi: 10.1016/s0008-6363(98)00324-1. [DOI] [PubMed] [Google Scholar]
- 13.Deng Y, Kaufman S. The influence of reproductive hormones on ANF release by rat atria. Life Sci. 1993;53:689–96. doi: 10.1016/0024-3205(93)90245-x. [DOI] [PubMed] [Google Scholar]
- 14.Hwu CM, Tsai SC, Lau CP, et al. Increased concentrations of atrial and plasma atrial natriuretic peptide in castrated male rats. Life Sci. 1993;52:205–12. doi: 10.1016/0024-3205(93)90141-o. [DOI] [PubMed] [Google Scholar]
- 15.Saenger AK, Dalenberg DA, Bryant SC, Grebe SK, Jaffe AS. Pediatric brain natriuretic peptide concentrations vary with age and sex and appear to be modulated by testosterone. Clin Chem. 2009;55:1869–75. doi: 10.1373/clinchem.2009.123778. [DOI] [PubMed] [Google Scholar]
- 16.Yasui T, Matsui S, Saijo A, et al. Association of N-terminal pro B-type natriuretic peptide and sex hormone-binding globulin in non-obese peri- and postmenopausal women. Clin Chim Acta. 411:280–4. doi: 10.1016/j.cca.2009.11.025. [DOI] [PubMed] [Google Scholar]
- 17.Reinecke H, Bogdanski J, Woltering A, et al. Relation of serum levels of sex hormone binding globulin to coronary heart disease in postmenopausal women. Am J Cardiol. 2002;90:364–8. doi: 10.1016/s0002-9149(02)02490-6. [DOI] [PubMed] [Google Scholar]
- 18.Hautanen A. Synthesis and regulation of sex hormone-binding globulin in obesity. Int J Obes Relat Metab Disord. 2000;24 (Suppl 2):S64–70. doi: 10.1038/sj.ijo.0801281. [DOI] [PubMed] [Google Scholar]
- 19.Sutton-Tyrrell K, Wildman RP, Matthews KA, et al. Sex-hormone-binding globulin and the free androgen index are related to cardiovascular risk factors in multiethnic premenopausal and perimenopausal women enrolled in the Study of Women Across the Nation (SWAN) Circulation. 2005;111:1242–9. doi: 10.1161/01.CIR.0000157697.54255.CE. [DOI] [PubMed] [Google Scholar]
- 20.Wang TJ, Larson MG, Keyes MJ, Levy D, Benjamin EJ, Vasan RS. Association of plasma natriuretic peptide levels with metabolic risk factors in ambulatory individuals. Circulation. 2007;115:1345–53. doi: 10.1161/CIRCULATIONAHA.106.655142. [DOI] [PubMed] [Google Scholar]
- 21.Dawber TR, Meadors GF, Moore FE., Jr Epidemiological approaches to heart disease: the Framingham Study. Am J Public Health Nations Health. 1951;41:279–81. doi: 10.2105/ajph.41.3.279. [DOI] [PMC free article] [PubMed] [Google Scholar]
- 22.McKee PA, Castelli WP, McNamara PM, Kannel WB. The natural history of congestive heart failure: the Framingham study. N Engl J Med. 1971;285:1441–6. doi: 10.1056/NEJM197112232852601. [DOI] [PubMed] [Google Scholar]
- 23.Norman R, Phillipson G. The normal menstrual cycle: changes throughout life. In: Fraser IS, Jansen RPS, Lobo RA, Whitehead MI, editors. Estrogens and Progestogens in Clinical Practice. New York: Churchill Livingstone; 1998. p. 105. [Google Scholar]
- 24.Lohstroh PN, Chen J, Ba J, et al. Bone resorption is affected by follicular phase length in female rotating shift workers. Environ Health Perspect. 2003;111:618–22. doi: 10.1289/ehp.5878. [DOI] [PMC free article] [PubMed] [Google Scholar]
- 25.Reichman ME, Judd JT, Taylor PR, Nair PP, Jones DY, Campbell WS. Effect of dietary fat on length of the follicular phase of the menstrual cycle in a controlled diet setting. J Clin Endocrinol Metab. 1992;74:1171–5. doi: 10.1210/jcem.74.5.1569164. [DOI] [PubMed] [Google Scholar]
- 26.Barnett JB, Woods MN, Lamon-Fava S, et al. Plasma lipid and lipoprotein levels during the follicular and luteal phases of the menstrual cycle. J Clin Endocrinol Metab. 2004;89:776–82. doi: 10.1210/jc.2003-030506. [DOI] [PubMed] [Google Scholar]
- 27.Kozlowski PA, Williams SB, Lynch RM, et al. Differential induction of mucosal and systemic antibody responses in women after nasal, rectal, or vaginal immunization: influence of the menstrual cycle. J Immunol. 2002;169:566–74. doi: 10.4049/jimmunol.169.1.566. [DOI] [PubMed] [Google Scholar]
- 28.Mazer NA. A novel spreadsheet method for calculating the free serum concentrations of testosterone, dihydrotestosterone, estradiol, estrone and cortisol: with illustrative examples from male and female populations. Steroids. 2009;74:512–9. doi: 10.1016/j.steroids.2009.01.008. [DOI] [PubMed] [Google Scholar]
- 29.Vermeulen A, Verdonck L, Kaufman JM. A critical evaluation of simple methods for the estimation of free testosterone in serum. J Clin Endocrinol Metab. 1999;84:3666–72. doi: 10.1210/jcem.84.10.6079. [DOI] [PubMed] [Google Scholar]
- 30.Matthews DR, Hosker JP, Rudenski AS, Naylor BA, Treacher DF, Turner RC. Homeostasis model assessment: insulin resistance and beta-cell function from fasting plasma glucose and insulin concentrations in man. Diabetologia. 1985;28:412–9. doi: 10.1007/BF00280883. [DOI] [PubMed] [Google Scholar]
- 31.Hong M, Yan Q, Tao B, et al. Estradiol, progesterone and testosterone exposures affect the atrial natriuretic peptide gene expression in vivo in rats. Biol Chem Hoppe Seyler. 1992;373:213–8. doi: 10.1515/bchm3.1992.373.1.213. [DOI] [PubMed] [Google Scholar]
- 32.Matsubara H, Hirata Y, Yoshimi H, et al. Effects of steroid and thyroid hormones on synthesis of atrial natriuretic peptide by cultured atrial myocytes of rat. Biochem Biophys Res Commun. 1987;145:336–43. doi: 10.1016/0006-291x(87)91326-x. [DOI] [PubMed] [Google Scholar]
- 33.Dockery F, Bulpitt CJ, Agarwal S, et al. Anti-androgens increase N-terminal pro-BNP levels in men with prostate cancer. Clin Endocrinol (Oxf) 2008;68:59–65. doi: 10.1111/j.1365-2265.2007.02999.x. [DOI] [PubMed] [Google Scholar]
- 34.Nir A, Lindinger A, Rauh M, et al. NT-pro-B-type natriuretic peptide in infants and children: reference values based on combined data from four studies. Pediatr Cardiol. 2009;30:3–8. doi: 10.1007/s00246-008-9258-4. [DOI] [PubMed] [Google Scholar]
- 35.Hersh AL, Stefanick ML, Stafford RS. National use of postmenopausal hormone therapy: annual trends and response to recent evidence. JAMA. 2004;291:47–53. doi: 10.1001/jama.291.1.47. [DOI] [PubMed] [Google Scholar]
- 36.Devineni D, Skee D, Vaccaro N, et al. Pharmacokinetics and pharmacodynamics of a transdermal contraceptive patch and an oral contraceptive. J Clin Pharmacol. 2007;47:497–509. doi: 10.1177/0091270006297919. [DOI] [PubMed] [Google Scholar]
- 37.Stanosz S, Zochowska E, Safranow K, Sieja K, Stanosz M. Influence of modified transdermal hormone replacement therapy on the concentrations of hormones, growth factors, and bone mineral density in women with osteopenia. Metabolism. 2009;58:1–7. doi: 10.1016/j.metabol.2008.07.016. [DOI] [PubMed] [Google Scholar]
- 38.Wiegratz I, Kuhl H. Metabolic and clinical effects of progestogens. Eur J Contracept Reprod Health Care. 2006;11:153–61. doi: 10.1080/13625180600772741. [DOI] [PubMed] [Google Scholar]
- 39.Miller KK, Rosner W, Lee H, et al. Measurement of free testosterone in normal women and women with androgen deficiency: comparison of methods. J Clin Endocrinol Metab. 2004;89:525–33. doi: 10.1210/jc.2003-030680. [DOI] [PubMed] [Google Scholar]
- 40.Wang C, Shiraishi S, Leung A, et al. Validation of a testosterone and dihydrotestosterone liquid chromatography tandem mass spectrometry assay: Interference and comparison with established methods. Steroids. 2008;73:1345–52. doi: 10.1016/j.steroids.2008.05.004. [DOI] [PMC free article] [PubMed] [Google Scholar]
- 41.Wang C, Catlin DH, Demers LM, Starcevic B, Swerdloff RS. Measurement of total serum testosterone in adult men: comparison of current laboratory methods versus liquid chromatography-tandem mass spectrometry. J Clin Endocrinol Metab. 2004;89:534–43. doi: 10.1210/jc.2003-031287. [DOI] [PubMed] [Google Scholar]
- 42.Rosner W, Auchus RJ, Azziz R, Sluss PM, Raff H. Position statement: Utility, limitations, and pitfalls in measuring testosterone: an Endocrine Society position statement. J Clin Endocrinol Metab. 2007;92:405–13. doi: 10.1210/jc.2006-1864. [DOI] [PubMed] [Google Scholar]
- 43.Clerico A, Recchia FA, Passino C, Emdin M. Cardiac endocrine function is an essential component of the homeostatic regulation network: physiological and clinical implications. Am J Physiol Heart Circ Physiol. 2006;290:H17–29. doi: 10.1152/ajpheart.00684.2005. [DOI] [PubMed] [Google Scholar]
- 44.Clerico A, Emdin M. Diagnostic accuracy and prognostic relevance of the measurement of cardiac natriuretic peptides: a review. Clin Chem. 2004;50:33–50. doi: 10.1373/clinchem.2003.024760. [DOI] [PubMed] [Google Scholar]
- 45.Lee CY, Burnett JC., Jr Natriuretic peptides and therapeutic applications. Heart Fail Rev. 2007;12:131–42. doi: 10.1007/s10741-007-9016-3. [DOI] [PubMed] [Google Scholar]