

Abstract
The murine Polycomb-Group (PcG) proteins Eed and Bmi1 govern axial patterning during embryonic development by segment-specific repression of Hox gene expression. The two proteins engage in distinct multimeric complexes that are thought to use a common molecular mechanism to render the regulatory regions of Hox and other downstream target genes inaccessible to transcriptional activators. Beyond axial patterning, Bmi1 is also involved in hemopoiesis because a loss-of-function allele causes a profound decrease in bone marrow progenitor cells. Here, evidence is presented that is consistent with an antagonistic function of eed and Bmi1 in hemopoietic cell proliferation. Heterozygosity for an eed null allele causes marked myelo- and lymphoproliferative defects, indicating that eed is involved in the negative regulation of the pool size of lymphoid and myeloid progenitor cells. This antiproliferative function of eed does not appear to be mediated by Hox genes or the tumor suppressor locus p16INK4a/p19ARF because expression of these genes was not altered in eed mutants. Intercross experiments between eed and Bmi1 mutant mice revealed that Bmi1 is epistatic to eed in the control of primitive bone marrow cell proliferation. However, the genetic interaction between the two genes is cell-type specific as the presence of one or two mutant alleles of eed trans-complements the Bmi1-deficiency in pre-B bone marrow cells. These studies thus suggest that hemopoietic cell proliferation is regulated by the relative contribution of repressive (Eed-containing) and enhancing (Bmi1-containing) PcG gene complexes.
Keywords: eed, Bmi1, Polycomb-Group (PcG) genes, hemopoiesis, cellular proliferation
The murine Polycomb (PcG) and trithorax (trxG) group of genes are constituents of evolutionary highly conserved epigenetic pathways governing metameric patterning of the axial skeleton by regulation of Hox gene expression (for review, see Gould 1997; Schumacher and Magnuson 1997; van Lohuizen 1998). PcG and trxG gene products are thought to modify higher order chromatin structures to maintain a repressed and derepressed state of Hox gene expression, respectively. Consistent with their role as upstream regulators of Hox genes, loss of function of PcG and trxG genes in mice alters Hox gene expression causing skeletal transformations. For example, dosage-sensitive posterior homeotic transformations have been observed in mutant alleles of the murine PcG genes Bmi1 (B cell-specific Mo-MLV integration site 1) and eed (embryonic ectoderm development) (van der Lugt et al. 1994; Schumacher et al. 1996).
Beyond axial patterning by control of Hox gene expression, several studies also support a role for PcG genes in regulating hemopoiesis. For example, differentiation of primary bone marrow cells is generally accompanied by an up-regulation of PcG gene expression levels (Lessard et al. 1998). Only Bmi1 exhibits a different pattern of expression with high levels in primitive CD34+ cells and very low levels in mature CD34− cells (Lessard et al. 1998). Likewise, the Hox gene expression levels are highest in the most primitive bone marrow cells (Sauvageau et al. 1994). These data are consistent with a down-regulation of Hox gene expression by PcG proteins as primary bone marrow cells differentiate. Furthermore, by virtue of their transcriptional activation upon stimulation of lymphoid B cells, PcG genes also act as immediate early genes (Hasegawa et al. 1998).
Further insight into the function of PcG genes in hemopoiesis can be derived from mutant analysis. Mice lacking Bmi1 display a progressive replacement of bone marrow hemopoietic cells by adipocytes along with an impaired proliferative response of the bone marrow progenitors to mitogens (van der Lugt et al. 1994). Similarly, targeted disruption of mel18, Mph1/Rae28, and M33 in mice leads to hypoproliferation and/or atrophy of various hemopoietic organs (Akasaka et al. 1996; Core et al. 1997; Takihara et al. 1997). Therefore, in all PcG mutants analyzed thus far, the hemopoietic compartment mostly affected correlates with the preferential expression domain, that is, stem/progenitor cells in case of Bmi1 and mature cells in case of mel18, M33, and Mph1/Rae28 (Lessard et al. 1998). Recently, the first downstream mediator of PcG-mediated cell proliferation was identified. Removal of the ink4a locus, which encodes the tumor suppressors p16INK4a and p19ARF, alleviated the proliferative defects caused by loss of function of Bmi1 (Jacobs et al. 1999).
Murine PcG proteins engage in two distinct multimeric complexes: One complex includes Eed, Enx1/EzH2, and Enx2/EzH1 (Denisenko et al. 1998; Sewalt et al. 1998; van Lohuizen et al. 1998) and the other Bmi1, Mel18, Mph1/Rae28, and M33 (Alkema et al. 1997; Gunster et al. 1997; Satijn et al. 1997; Satijn and Otte 1999). For simplicity, the Bmi1- and Eed-containing complex is herein referred to as ‘complex A’ and ‘complex B,’ respectively. Based on the phenotypic similarities among complex A and complex B PcG mutants, axial patterning of the primary body axis is likely to involve a common regulatory effect on Hox gene expression. Consistent with this hypothesis, Bmi1/M33 double mutants show synergistic interactions resulting in enhanced axial phenotypes (Bel et al. 1998). Likewise, the penetrance of homeotic transformations in eed/Bmi1 double mutant animals is significantly increased as compared with the single mutant phenotypes (A. Schumacher and T. Magnuson, unpubl.). In the hemopoietic lineages, complex A PcG genes exert a positive regulatory effect on cell proliferation. The function of complex B genes in hemopoiesis is unknown. However, by analogy to the rather uniform PcG function in axial patterning, complex B genes are predicted to act as positive regulators of hemopoietic cell proliferation with synergizing effects in double mutant combinations with complex A alleles.
Here, the hemopoietic phenotype of mutant alleles of the complex B gene eed is described. Surprisingly, eed acts as a negative regulator of myeloid and lymphoid progenitor cell proliferation in the bone marrow. This reflects a functional antagonism between the complex A gene Bmi1 and the complex B gene eed, which act as positive and negative regulators of bone marrow progenitor cell proliferation, respectively. Hyperproliferation of eed mutant cells is not associated with altered expression of Hox genes and the ink4a locus and, therefore, involves as yet unknown downstream mediators. Intercross experiments revealed an epistasis of Bmi1 to eed in the control of bone marrow stem cell proliferation because the eed/Bmi1 double mutant phenotype is identical to the Bmi1 single mutant phenotype. However, genetic interaction between the two genes is cell-type specific as the presence of one or two mutant eed alleles trans-complements the Bmi1 deficiency in pre-B bone marrow cells. These results reveal an unexpected complexity in PcG function in murine hemopoiesis.
Results
Expression of eed and Bmi1 in bone marrow cells
Bmi1 is preferentially expressed in primitive subpopulations of human bone marrow cells (Lessard et al. 1998). In contrast, eed is expressed at about equal levels in both primitive and mature human hemopoietic cells (J. Lessard and G. Sauvageau, unpubl.). The expression of these two genes was similarly determined in mouse primary bone marrow cells representing functionally distinct stem/progenitor (Sca+ Lin−) and mature (Sca− Lin+) cell compartments (Fig. 1A). In agreement with the human data, only the Sca+ Lin− subpopulation displayed an elevated expression level of mouse Bmi1 (Fig. 1A, upper panel), whereas eed expression was consistently high in all subpopulations (Fig. 1A, middle panel).
Figure 1.


Expression of eed and Bmi1 PcG genes in purified subpopulations of murine bone marrow cells and hemopoietic cell lines. (A) Five to ten thousand cells were isolated from each subpopulation (>98% purity upon reanalysis), and their total RNA was reverse–transcribed and PCR-amplified as described in Material and Methods. Cocktail of lineage-specific (Lin) monoclonal antibodies (MoAbs) contained B220 (B lymphocytes), Gr-1 (granulocytes), and Mac-1 (granulocyte-macrophages). From primitive to mature subpopulations: Sca+ Lin− subpopulation (lane 2); Sca− Lin+ subpopulation (lane 3). Exposure times (all at −70°C) are as follows: Bmi1, 83 hr (except all hemopoietic cell lines, 20-hr exposure); eed, 4.5 hr, and β-Actin, 25 min (except S2 Drosophila cell line, 75-min exposure). (B) Schematic representation of complexes A and B PcG gene expression patterns in purified subpopulations of primary bone marrow cells (this paper; Sauvageau et al. 1994; Lessard et al. 1998).
eed is a negative regulator of bone marrow progenitor cell proliferation
The ubiquitous expression of human and mouse eed in bone marrow cells suggests that this gene may function in both primitive and mature hemopoietic cells. To test this hypothesis, the proliferation and differentiation of primitive and mature bone marrow cells was assessed in eed mutants. Hemopoietic cells were derived from animals carrying one or two copies of a viable hypomorphic allele of eed, l7Rn51989SB (herein referred to as eed1989/+ and eed1989/1989), or one copy of an eed null allele, l7Rn53354SB (herein referred to as eed3354/+) (Schumacher et al. 1996). Homozygosity for the eed3354 allele is lethal at gastrulation (Faust et al. 1995) and, thus, excludes analysis of hemopoietic cells.
When compared with control littermates, the bone marrow, spleen, thymus, and peripheral blood counts were normal in all young eed mutants analyzed, that is, animals of <4 months of age (n > 5 per group). Moreover, cytological and cytofluorometric analyses showed that myeloid (Mac+, Gr-1+), B-(B220+CD43+; B220+IgM+), and T-(CD4+CD8+; CD4−CD8−; CD4+ and CD8+) cell populations derived from eed1989/+, eed1989/1989, and eed3354/+ mutant mice were similar to that of sibling control animals (data not shown). However, there was a 2- and 3.5-fold increase in the frequency of mature myeloid and pre-B lymphoid progenitors, respectively, in the bone marrow of eed3354/+ animals (Fig. 2B) when compared with control littermates. Moreover, eed3354/+ pre-B progenitor-derived colonies were on average four times larger than those derived from control animals (data not shown). Morphological analysis and immunophenotyping confirmed that these colonies contained mostly B lymphocytes, indicating that eed mutant cells undergo increased proliferation prior to becoming terminally differentiated (data not shown).
Figure 2.

Eed is a negative regulator of the proliferative activity of bone marrow myeloid and lymphoid progenitor cells. (A) Schematic representation of the myeloid and B-lymphoid differentiation pathways. (B) Absolute numbers of primitive myeloid (LTC-IC), primitive lymphoid (WW-IC), and colony-forming cells (CFC) per femoral bone of 12- to 16-week-old eed mutant mice. Results are expressed as mean ± s.d.. (HPP-CFC) High proliferative potential colony-forming cells; (pre-B) B cell precursors; (n.a.) not available. a Includes both colony-forming-unit–granulocyte–macrophage (CFU-GM) and colony-forming–unit–granulocyte–erythroid–monocyte–megakaryocyte (CFU-GEMM) (>1000 cells). b CFC (n = 9), LTC-IC and WW-IC (n = 3); c includes both eed1989/+ and eed1989/1989 mutant mice; CFC (n = 9), LTC-IC (n = 6), and WW-IC (n = 2). d CFC (n = 5), LTC-IC (n = 2).
To ascertain whether the precursors of the mature myeloid and lymphoid colony-forming cells (CFCs) were affected in eed mutant animals, the frequency of the mostly quiescent primitive bone marrow myeloid long-term culture-initiating cells (LTC-ICs) and lymphoid Whitlock–Witte-initiating cells (WW-ICs) was measured by limiting dilution analysis. The results presented in Figure 2B indicate that LTC-IC frequencies are comparable between the controls (n = 3) and the eed mutant mice (n = 6 total for eed1989/+ and eed1989/1989 and n = 2 for eed3354/+). The WW-IC, which was only evaluated in the eed1989 mice, was also not significantly different from the controls.
Thus, the significant increase in the number of the more mature myeloid and pre-B bone marrow progenitors in young eed3354/+ mutant mice is consistent with eed acting as a negative regulator of cell proliferation in mature bone marrow progenitors.
Lymphoid and myeloid hyperproliferation in older eed mutant mice
To investigate the long-term effect of decreased Eed activity in hemopoietic cells, nine eed3354/+ mice were analyzed between 7 and 18 months of age. Of these, five had developed lymphoproliferation (LP) (group B; Figs. 3 and 4), three mice suffered from a severe myeloproliferative disease (MPD) (group C; Figs. 3 and 4), and one was still relatively normal (group D; Fig. 3) although it had a noticeable increase in bone marrow pre-B progenitors (Fig. 4A).
Figure 3.
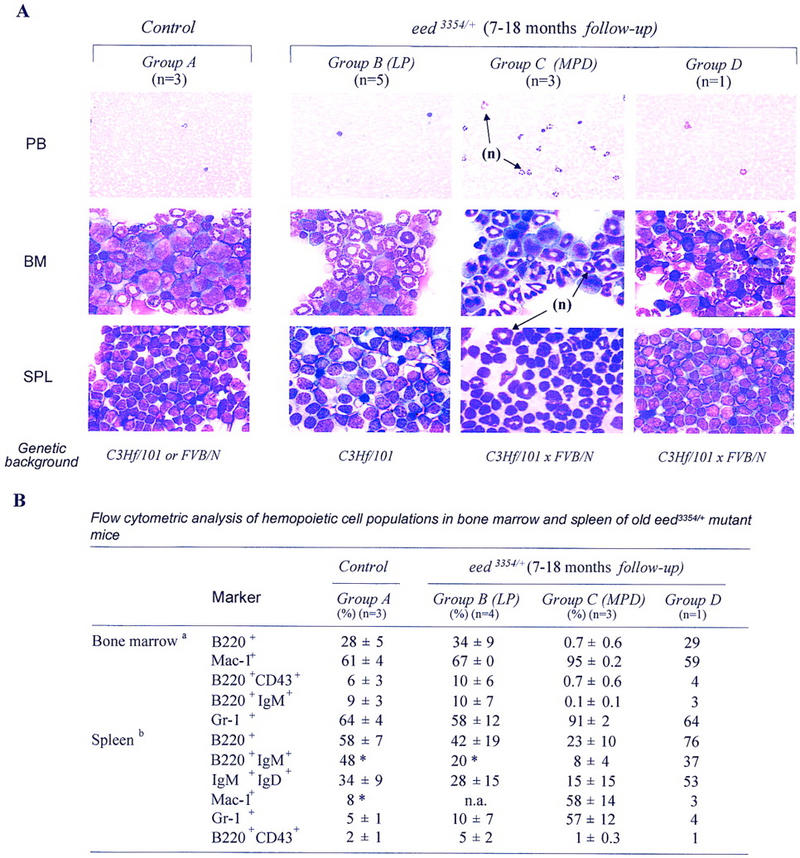
Cytopathological (A) and cytofluorometric (B) analyses of hematopoietic cells isolated from older control and eed3354/+ mutant mice. (A) Wright staining of peripheral blood smears (PB), bone marrow (BM) cytospins, and ‘touch preparations’ of spleen (SPL) from representative control, eed3354/+ group B (LP), eed3354/+ group C (MPD) and eed3354/+ group D mutant mice (also described in Fig. 4). Note the infiltration by neutrophils (n) in all tissues of eed3354/+ group C (MPD) mutant mice. Magnification, 100× for all, except for peripheral blood, 40×. Note that absolute number of bone marrow cells per femur is reduced about twofold and absolute number of nucleated cells per spleen is increased about fourfold in eed3354/+ group C (MPD) mutant mice. For B, results are expressed as mean ± s.d. (LP) Lymphoproliferation; (MPD) myeloproliferative disease. aAbsolute numbers of bone marrow cells per femur: Control group A 3.2 × 10⁷ ± 0.2; eed3354/+ group B (LP) 2.9 × 10⁷ ± 0.3; eed3354/+ group C (MPD) 1.5 × 10⁷ ± 0.5; eed3354/+ group D 2.1 × 10⁷. b Absolute numbers of nucleated cells per spleen: Control group A 1.8 × 10⁸ ± 0.5; eed3354/+ group B (LP) 1.4 × 10⁸ ± 0.1; eed3354/+ group C (MPD) 7.8 × 10⁸ ± 1.6; eed3354/+ group D 2.4 × 10⁸. (*) Only one mouse analyzed.
Figure 4.


Myelo- and lymphoproliferation occur in old eed3354/+ mutant mice. (A) Femur-derived bone marrow cells were assayed in methylcellulose for myeloid and pre-B lymphoid CFCs. (B) In vitro long-term culture assays of primitive myeloid (LTC-IC) and lymphoid (WW-IC) bone marrow cells. The results, mean ± s.d., are given as absolute numbers per femur. (C) CFC generated per LTC-IC at limiting dilution after 28 days of in vitro culture; includes colony-forming-unit–granulocyte–macrophage (CFU-GM) and burst-forming-unit–erythroid (BFU-E). WW-IC-derived B220+ B cells (at limiting dilution) were analyzed by FACS at day 21 of culture. (*) Not determined. (Solid bar) Control group A (n = 4); (shaded bar) eed3354/+ group B (LP) (n = 5); (dotted bar) eed3354/+ group C (MPD) (n = 3); (open bar) eed3354/+ group D (n = 1).
The lymphoproliferative defect observed in eed3354/+ mice (group B) was characterized by a 35-fold increase in the frequency of lymphoid (pre-B) bone marrow progenitor cells with highly increased proliferative activity when compared with control littermates (group A; Fig. 4A). Morphological and cytofluorometric analyses confirmed that these cells were of B lineage origin (data not shown). A smaller but significant increase in the frequency of immature lymphoid (WW-IC) and myeloid (LTC-IC) bone marrow progenitor cells was also found in eed3354/+ mice when compared with control littermates (3.5-fold and 2-fold increase, respectively; Fig. 4B). Furthermore, as evaluated by the number of B cells produced per WW-IC at limiting dilution, the proliferative potential of individual eed3354/+ group B immature WW-IC lymphoid progenitors was increased by 12-fold as compared with control animals (Fig. 4C). This provides a possible explanation for the increase in pre-B CFC in these mice.
Despite as much as a 35-fold increase in the frequency of pre-B-cell population in eed3354/+ mice, there were no significant changes in the absolute numbers of more mature B cells in the bone marrow and peripheral hemopoietic organs of these mice when compared with controls (Fig. 3A,B). These observations suggest that a compensatory mechanism must operate to maintain normal numbers of mature cells in eed3354/+ animals. One possibility is that pre-B CFC detected in vitro would not survive in vivo under limiting cytokine (e.g., IL-7) conditions. Therefore, survival assays were performed in which IL-7 was added following an initial culture period of 0, 24, 48, or 72 hr. Such delayed addition of IL-7 did not result in a significant decrease in colony formation in eed3354/+ cultures with respect to that of control littermates, indicating that eed3354/+ group B lymphoid precursors (pre-B) are not more sensitive to cytokine deprivation than control cells (data not shown). This suggests that B-cell homeostasis in these mice might be dependent on ‘peripheral regulators’ of B-cell numbers.
A severe MPD also developed in some of the older eed3354/+ mice (group C, 7–18 months of age; Fig. 3), which showed general signs of illness and severe weight loss. When sacrificed, they were athymic and showed splenomegaly and lymphadenopathy. Bacteriology, parasitology, and virology testing of plasma and several tissues isolated from these animals excluded pathogen infections (data not shown). These mice displayed high peripheral white blood cell counts, representing almost exclusively segmented neutrophils (Fig. 3A). Cytofluorometric analysis of cells derived from the bone marrow, spleen, thymus, and lymph nodes of these mice showed a profound increase in the frequency of a myeloid population of cells coexpressing the Mac-1+ and Gr-1+ surface markers (up to 91% and 57% of total bone marrow cells and splenocytes coexpressed Mac-1+ and Gr-1+, respectively; Fig. 3B). These mice also exhibited a marked decrease in the number of bone marrow B220+IgM+ immature B cells (<1% of wild-type levels) and mature IgM+IgD+ B cells (44% of wild-type levels; Fig. 3B) in secondary lymphatic organs, likely reflecting infiltration and displacement by the expanding myeloid population. In the only mouse presenting an involuted thymus, the ratio of CD4+ to CD8+ T cells was normal (data not shown). Despite a 2-fold reduction in bone marrow cellularity, myeloid bone marrow progenitors were increased 2.5-fold and consisted predominantly of granulocyte and/or macrophage colony-forming cells (G and/or M-CFCs) (Fig. 4A; data not shown). Consistent with the cytofluorometric studies, the absolute numbers of pre-B- and immature lymphoid B-(WW-IC) cell populations in these mice were reduced to 1.6% and 37% of wild-type levels, respectively (Fig. 4A,B).
Importantly, the myeloproliferative disorders were observed only in eed3354/+ mice that derived from the double mutant crosses with Bmi1, suggesting that this phenotype may be modulated by the presence of modifier genes in the FVB/N background (C3Hf/101 vs. C3Hf/101 × FVB/N; Fig. 3).
The hyperproliferative effects observed mostly in the lymphoid B-cell lineage of C3Hf/101 eed mutant mice would suggest that eed may be another member of the growing family of tumor suppressor genes. To test for this possibility, a larger cohort of eed mutant mice (including 12 homozygous eed1989/1989 and 28 heterozygous eed1989/+ mutant mice) were monitored for tumor formation for up to 2 years, of which a single case was observed in a 3-month-old eed1989/1989 mouse. Morphological, cytological, and DNA analyses confirmed that the tumor was a monoclonal B-cell lymphoma [see histology and B-cell receptor (BCR) rearrangement in Fig. 5]. Interestingly, the exposure of eed1989 and eed3354/+ mice to a genotoxic agent, methylnitrosourea (MNU), led to lymphoid tumor formation in 100% of these mice in a time frame in which no tumors would develop in control animals (E. Richie, A. Schumacher, and T. Magnuson, unpubl.).
Figure 5.

Monoclonal B-cell tumor in a 3-month-old eed1989/1989 mutant mouse. (A) Histological analysis of a hematoxilin and eosin section of a thoracic tumor (1.5 grams). Note the infiltration by mature darkly stained lymphocytes. Magnification, 100×. (B) Southern blot analysis of genomic DNA isolated from the tumor showing clonal (see arrow) BCR rearrangement. Note the absence of clonal BCR rearrangement in bone marrow cells of this same mouse (BM) and in the spleen and bone marrow of a healthy control mouse. Membrane was hybridized to a probe corresponding to the IgH intronic enhancer locus capable of detecting both V(D)J and DJ joints. Exposure time was 84 hr. (IgH) Immunoglobulin heavy chain.
Together, these data indicate that eed performs important antiproliferative activity on a subset of early (WW-IC) and late (myeloid and pre-B CFC) bone marrow progenitors and that ultimately, its absence may lead to tumor formation. These data contrast with previous studies of mutant complex A PcG genes (including Bmi1) in which hypoproliferation of hemopoietic precursors was observed (van der Lugt et al. 1994; Akasaka et al. 1996; Core et al. 1997; Takihara et al. 1997).
eed and Bmi1 have opposite functions in regulating hemopoietic cell proliferation
Bmi1 null homozygous mice display a severe and progressive reduction in their number and proliferative potential of (mature) bone marrow myeloid and pre-B progenitors (van der Lugt et al. 1994). Interestingly, the eed mutant mice described herein have the opposite hemopoietic phenotype (i.e., a progressive increase in the number and proliferative potential of several types of bone marrow CFCs). The coexpression of Bmi1 and eed in every hemopoietic cell line tested to date together with their expression in primitive Sca+ Lin− bone marrow cells (Fig. 1) suggests that eed and Bmi1 may functionally interact to regulate hemopoietic cell proliferation. To obtain genetic evidence for a functional collaboration between these two PcG proteins, eed and Bmi1 double mutant mice were generated and their hemopoietic system analyzed.
eed1989Bmi1−/− and eed3354/+Bmi1−/− double mutant mice were severely anemic, and in vitro colony formation assays of bone marrow progenitor cells isolated from these mice gave identical results to those observed with Bmi1−/− mice (Fig. 6A). Therefore, the loss of one or two functional alleles of eed did not alter the hemopoietic defects observed at the mature CFC level in Bmi1−/− mice. As reported previously, the loss of one allele of Bmi1 resulted in a small reduction in mature myeloid CFC and a significant threefold reduction in pre-B progenitors (Fig. 6A; van der Lugt et al. 1994). In contrast, the number of pre-B CFC in the bone marrow of eed/Bmi1+/− double mutant mice was close to that found in control littermates. This indicates that the loss of one or two alleles of eed trans-complemented the deficit at the pre-B CFC level found in Bmi1+/− mutant mice (n = 7 vs. 13 Bmi1+/− and eed/Bmi1+/− mice analyzed, respectively; Fig. 6A). These data are consistent with a cell type-specific interaction between the two genes and reveal an unexpected complexity in PcG function in hemopoiesis.
Figure 6.


Hemopoietic parameters of Bmi1 mutant and eed/Bmi1 double mutant mice analyzed at 12–16 weeks of age. (A) Bone marrow, spleen, and thymic cellularity (left) and bone marrow CFC numbers (right) in control (n = 9), Bmi1+/− (n = 7), Bmi1−/− (n = 3), eed+/− Bmi1−/− (either eed3354/+ or eed1989/+; n = 3), and eed/Bmi1+/− (either eed1989/+ or eed1989/1989; n = 13) mutant mice. For clarity, the results for single C3Hf/101 × FVB/N eed mutant mice were excluded from this table because the data are superimposable to that of the C3Hf/101 eed mutant animals presented in Fig. 2B. (B) Frequency and proliferative potential of primitive myeloid (LTC-IC) and primitive lymphoid (WW-IC) bone marrow cells in Bmi1 vs. eed/Bmi1 double mutant mice. All results shown in A and B represent mean values ± SD. (*) Not determined. (NC) Nucleated cells; (HPP-CFC) high proliferative potential–CFC. aAbsolute number of B220+ cells analyzed by FACS at day 21 of in vitro culture; reflects the proliferative potential of individual WW-IC. b Absolute number of CFC per LTC-IC; reflects the proliferative potential of individual LTC-IC. c One eed1989/+ Bmi1−/− and two eed3354/+ Bmi1−/− mutant mice were included in this calculation because they had very similar phenotypes. d Includes both eed1989/+ Bmi1+/− and eed1989/1989Bmi1+/− double mutant mice because they had very similar phenotypes. e The values corresponding to the Bmi1+/− and eed/Bmi1+/− groups of mice are not overlapping, but because of an extreme value obtained in one eed/Bmi1+/− mouse (1980 B cells/WW-IC), they are not statistically different (P < 0.07, one-tailed Student's t-test with unequal variance).
The capacity for eed and Bmi1 to functionally interact in the more primitive bone marrow LTC-ICs, and WW-ICs was also evaluated. Since LTC-IC and WW-IC numbers and proliferative capacity had not been determined previously in Bmi1 mutant mice, we first completed this evaluation. The results presented in Figure 6B indicate that in Bmi1−/− mice, the absolute numbers of both primitive myeloid (LTC-IC) and lymphoid (WW-IC) cell populations were profoundly reduced to 4% and 1% of wild-type levels, respectively. Moreover, the proliferative potential of these primitive progenitor cells was severely affected. Absolute numbers of LTC-IC-derived CFCs and WW-IC-derived B220+ B cells analyzed at limiting dilution were reduced 17-fold and 34-fold, respectively, in Bmi1−/− mice as compared with littermate control mice. The pool and proliferative activity of Bmi1−/− bone marrow primitive precursors progressively decreased with age (data not shown), and, as reported previously, Bmi1−/− mice did not survive beyond 20–25 weeks of age. Importantly, the numbers and proliferative potential of primitive myeloid (LTC-IC) and lymphoid (WW-IC) cells were not different between eed/Bmi1−/− double mutant mice and the single Bmi1−/− mice (Fig. 6B).
In Bmi1 heterozygous mice, reduction of Bmi1 expression levels neither altered the number nor the proliferative potential of primitive myeloid cells (LTC-ICs) but clearly reduced the proliferative capacity of primitive lymphoid (WW-IC) progenitors (control: 2295 B cells/WW-IC; Bmi1+/−: 275 B cells/WW-IC; Fig. 6B). This indicates that heterozygosity for Bmi1 limits the proliferative capacity of these progenitor cells. The proliferative potential of Bmi1+/− WW-ICs was partially rescued by the loss of one or two alleles of eed (from 275 ± 43 to 919 ± 341, for Bmi1+/− and eed/Bmi1+/− double mutant mice, respectively).
Taken together, these results indicate that the marked reduction of mature bone marrow progenitors and differentiated blood cells previously reported in Bmi1-deficient mice may in fact originate from a major proliferative defect in the pool of primitive myeloid and lymphoid progenitors. In addition, these studies demonstrated that, although one allele of Bmi1 is sufficient for the generation of primitive bone marrow cells, both alleles are required for the proliferation of a group of B-cell precursors. Furthermore, a reduction in functional eed trans-complements the loss of one allele of Bmi1 in this subset of precursors.
ink4a and Hox gene expression is not altered in eed mutant mice
Recent studies revealed a marked increase in the expression levels of the tumor suppressor genes p16INK4a and p19ARF along with concomitant down-regulation of cyclin A and E activity in Bmi1-deficient mouse embryonic fibroblasts and lymphocytes (Jacobs et al. 1999). To identify candidate downstream mediators of eed function, p16INK4a and p19ARF expression was analyzed in bone marrow (mostly myeloid), spleen (mostly B and T cells), and thymus (T cells), of old eed3354/+ mice and in the B-cell tumor that developed in the eed1989/1989 3-month-old mouse. The results presented in Figure 7 (top) do not show any difference in the expression level of p16INK4a/p19ARF between the various mice analyzed (i.e., old eed3354/+ vs. littermate controls vs. young eed1989/1989). This suggests that these two genes do not mediate the hyperproliferative activity of mutant Eed. Interestingly however, p16INK4a and p19ARF expression was undetectable in the eed1989/1989 mutant mouse B-cell tumor as well as in the human leukemic cell line controls, likely reflecting inactivation of the ink4a locus, an event observed in several hemopoietic malignancies (Pinyol et al. 1998; Maloney et al. 1999).
Figure 7.
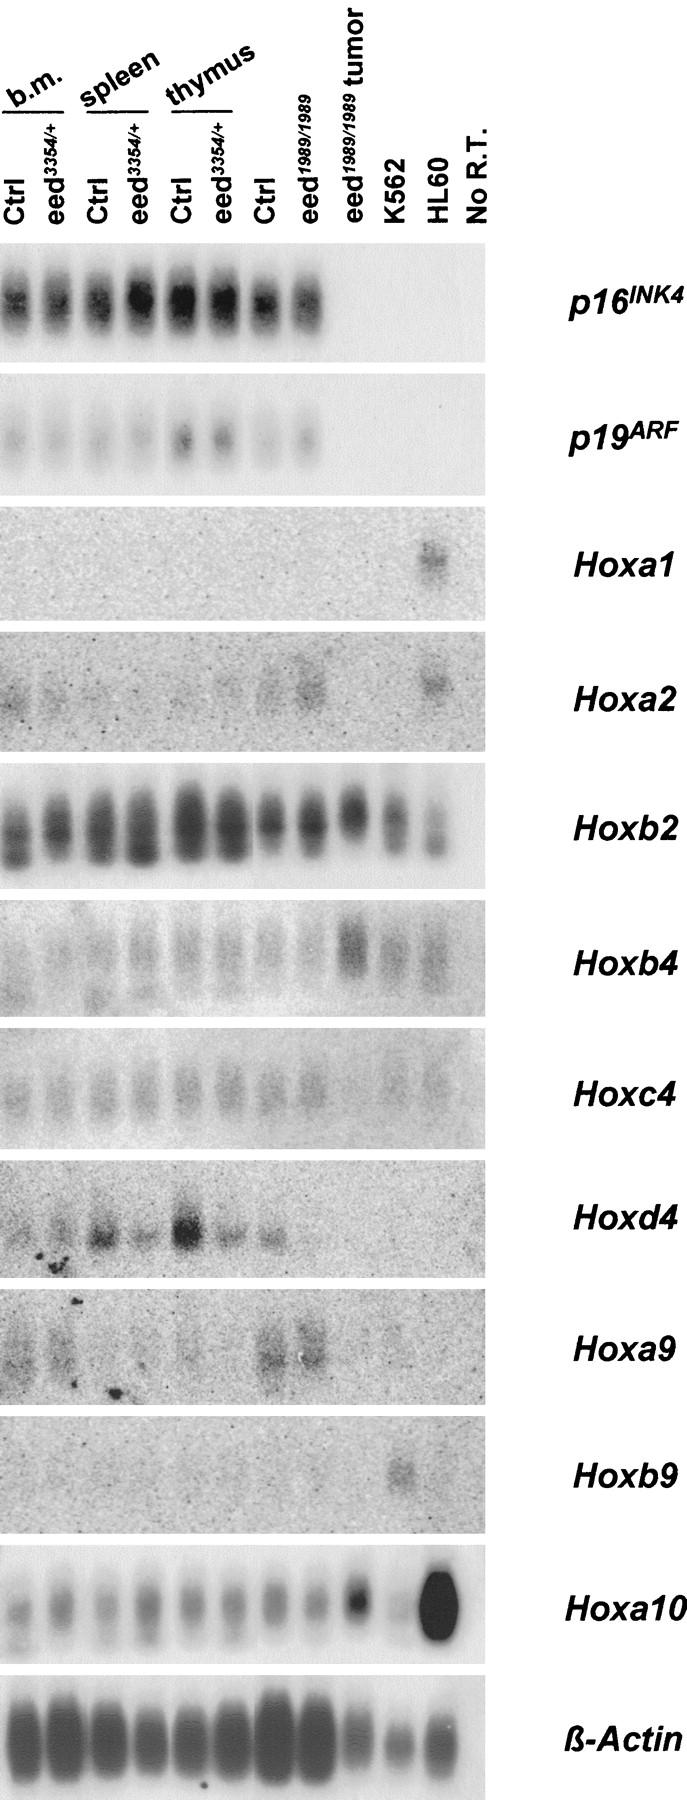
Expression of p16INK4a, p19ARF, and selected Hox genes in various hemopoietic organs of eed mutant mice together with an eed1989/1989 mutant mouse presenting a monoclonal B-cell lymphoma. Isolation of total RNA from eed mutant hemopoietic cells is described in Material and Methods. Control (lanes 1–3, 5) and eed3354/+ (lanes 2–4, 6) mutant mice were all 15 months old, and control (lane 7) and eed1989/1989 (lanes 8,9) mutant mice were 3 months old. Exposure time for Hoxc4, Hoxb4, Hoxa2, Hoxb9, and Hoxa1 was 20 hr; for Hoxd4 and Hoxa9, 26 hr (all on a phosphorImager cassette). Exposure time for p16INK4a was 3.5 hr; for p19ARF and Hoxa10, 77 hr; for Hoxb2, 20 hr; and for β-Actin, 2 hr (all at −70°C). eed1989/1989 tumor is described in Fig. 5. (K562 and HL60) Human myeloid cell lines used as positive controls for Hox and negative controls for p16INK4a/p19ARF expression. (No R.T.) No reverse transcription.
Based on the observation that Hox gene overexpression causes myelo- and lymphoproliferation (Sauvageau et al. 1997; Thorsteinsdottir et al. 1997; Kroon et al. 1998), this group of genes represents another potential mediator of eed function. However, as shown in Figure 7, the expression levels of Hoxa1, Hoxa2, Hoxa6 (not shown), Hoxb2, Hoxb3 (not shown), Hoxb4, Hoxc4, Hoxd4, Hoxa9, Hoxb9, and Hoxa10 in hemopoietic tissues of eed mutant mice (see above) were similar to those of control sibling littermates. This indicates that the increase in the proliferative activity of hemopoietic cells in eed mutant mice does not involve major changes in Hox gene expression. Therefore, the hyperproliferative phenotype in eed mutant mice involves a set of unknown downstream mediators.
Discussion
This study presents evidence for several critical differences in the function of the murine PcG genes eed and Bmi1 in hemopoiesis. (1) eed and Bmi1 represent functional antagonists in hemopoietic cell proliferation. Whereas Eed acts as a negative regulator of hemopoietic progenitor cell proliferation, Bmi1 enhances the proliferative activity of primitive (this study) and more mature (van der Lugt et al. 1994) bone marrow progenitor cells. (2) The antiproliferative function of Eed does not seem to involve Hox genes or the tumor suppressor locus p16INK4a/p19ARF. (3) Double mutant analysis reveals that Bmi1 is epistatic to eed in the control of bone marrow stem cell proliferation. (4) The genetic interaction between eed and Bmi1 is cell-type specific because the presence of one or two mutant eed alleles trans-complements the Bmi1 deficiency in pre-B bone marrow cells.
Functional antagonism between eed and Bmi1
Based on hyperproliferation of primitive and mature bone marrow progenitors in eed mutant mice, wild-type eed functions as an inhibitor of hemopoietic progenitor cell proliferation. This stands in sharp contrast to the role of Bmi1 as a positive regulator of the proliferative activity of progenitor cells. These opposite effects of eed and Bmi1 may be attributed to their involvement in distinct protein complexes. Biochemical studies indicate that the PcG proteins Bmi1, Mel18, M33, and Mph1/Rae28 are constituents of a multimeric protein complex A, which localizes to discrete nuclear foci in U-2 OS osteosarcoma cells (Alkema et al. 1997; Gunster et al. 1997). Importantly, Eed neither interacts physically with Bmi1 nor engages in this protein complex (Sewalt et al. 1998; van Lohuizen et al. 1998). Instead, Eed forms a complex B with the PcG proteins Enx1/EzH2 and Enx2/EzH1, which lacks signs of a discrete subnuclear distribution and is found rather uniformly throughout the nucleoplasm of U-2 OS osteosarcoma cells (van Lohuizen et al. 1998).
In all cases, the protein interaction domains have been delineated. For example, the central helix–turn–helix domain of the complex A protein Bmi1 is required for interaction with other PcG proteins, such as Mel18, Mph1/Rae28, and M33 (Alkema et al. 1997; Gunster et al. 1997; Satijn et al. 1997; Satijn and Otte 1999). The complex B protein Eed contains several WD domains, whose integrity is essential for interaction with the amino termini of the PcG proteins Enx1/EzH2 and Enx2/EzH1 (Denisenko et al. 1998; Sewalt et al. 1998; van Lohuizen et al. 1998b). Accordingly, the proline substitution in the second WD motif of the eed3354 null allele provides a maximally disruptive effect on protein folding (Schumacher et al. 1996) and ablates interaction with Enx1/EzH2 and Enx2/EzH1 (Denisenko et al. 1998; van Lohuizen et al. 1998b). In contrast, the relative conformational tolerance of an asparagine substitution in the second WD motif of the eed1989 hypomorphic allele (Schumacher et al. 1998) permits interaction with Enx1/EzH2, albeit at a reduced efficiency (van Lohuizen et al. 1998). Similarly, unlike the eed3354 null allele, the eed1989 hypomorphic allele does not cause major defects in B-cell proliferation.
These results are consistent with a distinct function of the two murine PcG complexes, which, similar to Drosophila melanogaster, may constitute heterogenous regulatory complexes at various target loci (Strutt and Paro 1997; Sinclair et al. 1998; DeCamillis et al. 1992). Gene dosage effects and haploinsufficiency were reported in mice bearing one inactivated allele of the complex A Bmi1, mel18, M33, Mph1/Rae28, and complex B eed PcG genes (van der Lugt et al. 1994; Akasaka et al. 1996; Core et al. 1997; Takihara et al. 1997), suggesting that a change in the concentration of one component of either of these PcG complexes affects the activity of critical regulators of cellular proliferation in mice. Therefore, proliferation of hemopoietic cells appears to be controlled by a stoichiometric relationship between complex A-mediated stimulation and complex B-mediated inhibition of cell proliferation. Disturbances in this equilibrium, for example, over-representation of the Bmi1-containing stimulatory complex A in eed mutant cells, may lead to important proliferative abnormalities. The loss of a single Bmi1 or eed allele inhibits and stimulates the proliferative activity of B-cell progenitors, respectively. By virtue of their coexpression during hemopoiesis and physical interaction, loss of function of Enx1/EzH2 and/or Enx2/EzH1 should therefore result in dosage-sensitive proliferation defects in bone marrow cells that are reminiscent of the eed phenotype.
Eed, a PcG protein with tumor suppressing activity
The hyperproliferative defects observed in eed mutant animals together with the susceptibility of these mice to develop hemopoietic tumors would suggest that Eed has tumor suppressing activity. Because point mutations at the eed gene locus that account for the eed1989 and eed3354 alleles were shown to disrupt its interaction with Enx (see above), it will be interesting to determine whether Enx mutant animals also develop tumors, thereby ascribing the tumor-suppressor function to the Eed–Enx PcG ‘B’ complex. The requirement for exposure to genotoxic agents and the long latency before tumor development indicate that additional genetic events are required for ‘full transformation’ of hemopoietic cells lacking a functional eed gene.
A genetic hierarchy of PcG function in hemopoiesis
eed and Bmi1 function in axial patterning is likely to be governed by a common regulatory effect on Hox gene expression. For example, a null allele of Bmi1 displays posterior homeotic transformations along the anteroposterior (A/P) axis (van der Lugt et al. 1994). Several of these skeletal transformations are phenotypically identical to those observed in a hypomorphic allele of eed (Schumacher et al. 1996). Furthermore, consistent with the regulation of a common set of Hox genes, the penetrance of homeotic transformations in eed/Bmi1 double mutants is significantly increased as compared with the single mutant phenotypes (A. Schumacher and T. Magnuson, unpubl.). This is similar to Drosophila melanogaster, wherein axial homeotic phenotypes are enhanced in various double and triple PcG mutant combinations (Soto et al. 1995). Importantly, this includes the interaction between esc (extra sex combs) and Psc (Posterior sex combs), the fly homologs of eed and Bmi1 (Campbell et al. 1995).
In contrast, genetic analysis of eed and Bmi1 function in hemopoiesis reveals an unexpected complexity because the eed/Bmi1 double mutant phenotype in primitive bone marrow cells was identical to the Bmi1 single mutant phenotype. This suggests that Bmi1 is epistatic to eed in the control of hemopoietic stem cell proliferation. Alternatively, the two genes may not be coexpressed in the relevant subtypes of bone marrow progenitors, and hence, epistasis is not tested in the double mutants. WW-ICs and pre-B lymphoid CFCs as the primary target cells of eed and Bmi1 function are certainly rare and unlikely to be isolated to absolute purity. However, several observations argue for the coexpression of Bmi1 and eed in these bone marrow progenitor cells. First, eed is expressed in every tissue analyzed thus far (Schumacher et al. 1996; Denisenko et al. 1998). Second, all 10 hemopoietic cell lines analyzed thus far reveal coexpression of eed and Bmi1 (Lessard et al. 1998). Finally, the two genes are coexpressed at high levels in Sca1+ Lin− bone marrow cells, which are highly enriched for stem cells and primitive progenitors (Morrison and Weissman 1994). Therefore, these data provide strong support for the epistasis of Bmi1 to eed.
Remarkably, the genetic interaction between eed and Bmi1 is cell-type specific because the presence of one or two mutant eed alleles trans-complements the Bmi1 deficiency in pre-B bone marrow cells. This may reflect differences in genetic interaction between eed and Bmi1 as reflected by the lower expression level of Bmi1 in this cell population. Alternatively, qualitative differences, for example, a divergent composition of complex A and/or B, could also account for this phenomenon. Clearly, these results reveal an unexpected complexity in PcG function in hemopoiesis.
Downstream mediators of eed and Bmi1 function
The question arises as to whether, similar to axial patterning, eed and Bmi1 function in hemopoiesis involves a common set of downstream mediators. By virtue of their down-regulation upon differentiation of primary bone marrow cells (Lessard et al. 1998) and their well-documented role as downstream mediators of PcG function in axial patterning, Hox genes are perhaps the most likely candidates. In particular, they can be considered as primary effectors of the inhibitory function of eed in hemopoietic cell proliferation because overexpression of Hox genes causes hyperproliferative defects in mouse bone marrow cells (Sauvageau et al. 1997; Thorsteinsdottir et al. 1997; Kroon et al. 1998). Surprisingly, the expression levels of 11 different Hox genes (including Hoxb4 and Hoxc4 that show altered anterior expression boundaries in paraxial mesoderm in eed mutant mice; A. Schumacher and T. Magnuson, unpubl.), were not detectably altered in hemopoietic tissues of eed mutant animals. This indicates that the function of eed as an inhibitor of hemopoietic progenitor cell proliferation does not involve Hox genes.
Recently, the ink4a locus was identified as the first downstream mediator of PcG-mediated cell proliferation. Removal of ink4a, which encodes the tumor suppressors p16INK4a and p19ARF, alleviated the lymphoid and neurological defects seen in Bmi1 null mutant animals (Jacobs et al. 1999). However, given the dramatic differences in hemopoietic defects between eed and Bmi1 mutants, the ink4a locus is unlikely to be regulated by Eed. The p16INK4a and p19ARF expression levels were not altered in eed mutant cells.
These results lead to the model illustrated in Figure 8. Therein, the function of the two PcG complexes has evolved from a common repressive effect on Hox gene expression in axial patterning to a more divergent activity in hemopoietic cells. The hemopoietic target genes involved in the proliferative activity of complex A PcG proteins, including Bmi1, seem to include the tumor suppressors p16INK4a and p19ARF. In contrast, the complex B PcG proteins, including Eed, exert their function through the regulation of other, as yet unknown, downstream genes. Thus, an intricate equilibrium between two PcG protein complexes governing distinct molecular pathways is critical for hemopoietic cell proliferation in mice.
Figure 8.

Schematic representation of Eed and Bmi1 mediated effects in embryonic vs. hemopoietic development in mice. Eed and Bmi1 PcG proteins synergize to regulate differentiation of skelettal/bone precursor cells possibly through a common regulatory effect on Hox gene activity. Conversely, Eed and Bmi1 have opposing functions in regulating hemopoietic cell proliferation in mice that appear to be Hox gene independent.
Materials and methods
Animals
Production of eed1989 hypomorphic and eed3354 null mutant mice (101/R1 × C3Hf/R1 hybrid background) and Bmi1−/− mice (129Ola/FVB/N hybrid background) have been described before (Schumacher et al. 1996; van der Lugt et al. 1994). Most of the mice were bred at Case Western Reserve University in Cleveland, Ohio and then transported to and maintained in the specific pathogen-free (SPF) animal facility of the Clinical Research Institute of Montreal (IRCM). All animals were housed in ventilated microisolator cages, provided with sterilized food and acidified water, and tested monthly for the presence of viral, bacterial, or parasitic pathogens. Selected animals were sent for complete histopathological studies to rule out the presence of any pathogen.
Generation of double mutant mice
eed1989/+ hypomorphic or eed3354/+ null mutant mice (Schumacher et al. 1996) were interbred with Bmi1 heterozygous mice (van der Lugt et al. 1994) to generate double homozygous mutant offsprings. Newborn mice were genotyped by PCR and/or Southern blot analysis. Only ∼2% of littermates were of eed1989/1989; Bmi1−/− genotype. As expected, none of the eed3354/3354; Bmi1−/− double mutant mice survived to term. All other genotypes were found at the expected Mendelian frequency.
Mice genotyping
Bmi1 mutant mice were genotyped by Southern blot analysis as described (van der Lugt et al. 1994). The T1040 → C transition at position 1040 in the eed3354 null allele destroys an AluI restriction site and allows for genotyping of the mice by Southern blot analysis. eed1989 hypomorphic mice were genotyped by PCR amplification of D7MIT352. This microsatellite is polymorphic between the 101/R1 × C3Hf/R1 and 129Ola/FVB/N hybrid backgrounds and maps distal to eed (Schumacher et al. 1996). In addition, for most of these mice, the presence of the T1031 → A transversion at position 1031 was confirmed by direct sequencing of PCR-amplified genomic DNA.
cDNA generation, amplification, and analysis
Reverse transcription and amplification of total mRNA isolated from purified bone marrow subpopulations were performed as reported previously (Sauvageau et al. 1994). In brief, 10,000 bone marrow cells purified by cell sorting were pelleted and lysed in 50 μl of 5 m guanidium isothiocyanate solution. Nucleic acids were precipitated, and cDNA was synthesized with a 60-mer primer containing a 3′ polythymidine stretch as described (Brady et al. 1990). A short polyadenosine tail was added to the 3′ end of the first strand cDNA using terminal deoxynucleotidyltransferase. Second-strand synthesis and PCR amplification involved the same primer at a higher concentration (Sauvageau et al. 1994). Amplified total cDNA was size fractionated on a 1% agarose gel, transferred to nylon membranes, and hybridized. Probes corresponded to a 329-bp fragment of the human Bmi1 gene located in the 3′ UTR (nucleotides 1938–2248; accession no. L13689, #508) and a 1000-bp 3′ fragment of the mouse eed coding cDNA (nucleotides 1017–2020; accession no. U78103, #696); probe for Hoxb9 was a 250-bp EcoRI–PstI fragment (#639); probe for Hoxa1 was a SacI–EcoRI fragment of 150 bp (#633), Hoxa6 probe was a 250-bp SacI–HindIII fragment (#634), Hoxb4 probe was an EcoR1–PmlI fragment of 485 bp (#405), probe for Hoxb2 was a 260-bp HincII–PstI fragment (#419), Hoxb3 probe was a 380-bp EcoRI fragment (#478), probe for Hoxc4 was a 212-bp XbaI–XhoI fragment (#214), Hoxd4 probe was a 765-bp PvuII–HindIII–EcoRI fragment (#770), probes for Hoxa9 and Hoxa10 corresponded to full-length cDNAs, and probe for Hoxa2 was a 320-bp PstI–HindIII fragment (#650). Probe specific for p16INK4a corresponded to exon 1α (nucleotides 5–197; accession no. AF044335, #775), p19ARF-specific probe corresponded to exon 1β (nucleotides 51–200; accession no. L76092, #776), and probe for β-Actin (#212) was isolated as described (Sauvageau et al. 1994).
In vitro clonogenic progenitor assays
For myeloid clonogenic progenitor assays, cells were plated on 35-mm petri dishes (Corning, Fisher) in a 1.1-ml culture mixture containing 0.8% methylcellulose in alpha medium (Sigma) supplemented with 10% fetal calf serum (FCS), 5.7% bovine serum albumin (BSA), 10−5 m β-mercaptoethanol (β-ME), 1 U/ml recombinant erythropoietin (Epo), 10% WEHI-conditioned medium (tested to contain 50 ng/ml IL-3), 2 mm glutamine, and 200 mg/ml transferrin. Colonies were scored on day 12 of incubation as derived from CFU-GM, BFU-E, or CFU-GEMM according to standard criteria. For some of the experiments, identification of the colony types was confirmed by Wright staining of cytospins preparations of colonies. For pre-B clonogenic progenitor assays, cells were plated in 0.8% methylcellulose in alpha medium supplemented with 30% preselected FCS (SCT, Vancouver, B.C.), 10−4 m β-ME, and 2 ng/ml human IL-7. Pre-B colonies were scored on day 7 of incubation.
In vitro long-term culture assays
Myeloid LTC-IC assays were performed as described (Lemieux and Eaves 1996) by culturing total bone marrow cells at limiting dilution on murine fibroblast S17 feeder cell layers, in 96-well plates, in the presence of alpha medium (Sigma) containing 12.5% FCS, 12.5% horse serum, 10−4 m β-ME, 10−6 hydrocortisone, 0.016 mm folic acid, 2 mm glutamine, 0.16 mm inositol, and 50 μg/ml gentamycin. The clonogenic progenitor content of the cultures was assayed 4 weeks after initiation. Similarly, lymphoid (Whitlock–Witte) long-term cultures were performed as described (Whitlock and Witte 1982) by culturing total bone marrow cells at limiting dilution on a S17 feeder cell layer for 3 weeks, in 96-well plates, in RPMI-1640 medium (GIBCO) containing 5% pre-selected FCS, 50 μm β-ME, and 50 μg/ml gentamycin.
Flow cytometry
Flow cytometry of hemopoietic cells was performed as described previously (Sauvageau et al. 1997). Briefly, a single cell suspension of bone marrow was prepared by injecting phosphate-buffered salt (PBS) solution containing 2% FCS into femurs to flush out cells, followed by gentle desegregation through a 21-gauge needle. Cells were released from the thymus, spleen, and lymph nodes by disruption through a fine nylon mesh. To lyse erythrocytes, cell suspensions were treated with 0.165 m NH4Cl and washed once. Cells were stained with primary antibodies in PBS 2% FCS containing blocking solution for Fc receptors on ice for 30 min, washed, and resuspended in PBS 2% FCS containing 1 μg/ml propidium iodide. Flow cytometric analysis was performed using a Coulter XLTM flow cytometer equipped with a 488-nm laser beam and fluorescence detectors at 525, 575, 620, and 670 nm. Monoclonal antibodies (Mabs) were titered and used as described previously (Hough et al. 1994, 1996). FITC-labeled B220, CD43 (S7), Gr-1, and Mac-1 and PE-labeled B220 antibodies were purchased from Pharmingen. PE- and FITC-conjugated streptavidin, CD4-FITC, and CD8-PE antibodies were purchased from GIBCO BRL. Biotinylated-IgM antibodies were from Jackson Laboratories and IgD–FITC from Southern Biotech.
Acknowledgments
This work is dedicated to Ms. Mireille Mathieu, a colleague and a friend. This work was supported by grants from the Medical Research Council (MRC) of Canada (MT15064) to G.S. and from the National Institutes of Health (HD24462) to T.M., and Nadine Mayotte for her expert technical assistance. We also acknowledge Marie-Eve Leroux, Christiane Lafleur, and Stéphane Matte for their expertise and help regarding the maintenance and manipulation of the animals kept at the SPF facility of the IRCM. In addition, we are grateful to Louis Lamarre and Caroline Meunier from l'Hôpital Hôtel-Dieu and l'Hôpital Maisonneuve-Rosemont de Montréal, respectively, for their assistance with the analysis of pathological specimens and Dr. Timothy Manser for providing the IgH enhancer locus probe. The support of Nathalie Tessier is also acknowledged for FACS analysis. J.L. is a recipient of a Studentship from MRC of Canada, U.T. is a fellow from the Leukemia Research Fund of Canada, and G.S. is an MRC Clinician–Scientist Scholar.
The publication costs of this article were defrayed in part by payment of page charges. This article must therefore be hereby marked ‘advertisement’ in accordance with 18 USC section 1734 solely to indicate this fact.
Footnotes
E-MAIL sauvagg@ircm.qc.ca; FAX (514) 987-5718.
References
- Akasaka T, Kanno M, Balling R, Mieza MA, Taniguchi M, Koseki H. A role for mel-18, a Polycomb Group-related vertebrate gene, during the anteroposterior specification of the axial skeleton. Development. 1996;122:1513–1522. doi: 10.1242/dev.122.5.1513. [DOI] [PubMed] [Google Scholar]
- Alkema MJ, Bronk M, Verhoeven E, Otte AP, van't Veer LJ, Berns A, van Lohuizen M. Identification of Bmi1-interacting proteins as constituents of a multimeric mammalian Polycomb complex. Genes & Dev. 1997;11:226–240. doi: 10.1101/gad.11.2.226. [DOI] [PubMed] [Google Scholar]
- Bel S, Core N, Djabali M, Kieboom K, Van der Lugt N, Alkema MJ, van Lohuizen M. Genetic interactions and dosage effects of Polycomb Group genes in mice. Development. 1998;125:3543–3551. doi: 10.1242/dev.125.18.3543. [DOI] [PubMed] [Google Scholar]
- Brady G, Barbara M, Iscove NN. Representative in vitro cDNA amplification from individual hemopoietic cells and colonies. Methods Mol Cell Biol. 1990;2:17–25. [Google Scholar]
- Campbell RB, Sinclair DA, Couling M, Brock HW. Genetic interactions and dosage effects of Polycomb Group genes of Drosophila. Mol & Gen Genet. 1995;246:291–300. doi: 10.1007/BF00288601. [DOI] [PubMed] [Google Scholar]
- Core N, Bel S, Gaunt SJ, Aurrand-Lions M, Pearce J, Fisher A, Djabali M. Altered cellular proliferation and mesoderm patterning in Polycomb-M33-deficient mice. Development. 1997;124:721–729. doi: 10.1242/dev.124.3.721. [DOI] [PubMed] [Google Scholar]
- DeCamillis M, Cheng NS, Pierre D, Brock HW. The polyhomeotic gene of Drosophila encodes a chromatin protein that shares polytene chromosome-binding sites with Polycomb. Genes & Dev. 1992;6:223–232. doi: 10.1101/gad.6.2.223. [DOI] [PubMed] [Google Scholar]
- Denisenko O, Shnyreva M, Suzuki H, Bomsztyk K. Point mutations in the WD40 domain of Eed block its interaction with Ezh2. Mol Cell Biol. 1998;18:5634–5642. doi: 10.1128/mcb.18.10.5634. [DOI] [PMC free article] [PubMed] [Google Scholar]
- Faust C, Schumacher A, Holdener B, Magnuson T. The eed mutation disrupts anterior mesoderm production in mice. Development. 1995;121:273–285. doi: 10.1242/dev.121.2.273. [DOI] [PubMed] [Google Scholar]
- Gould A. Functions of mammalian Polycomb Group and trithorax Group related genes. [Review] [61 refs] Curr Opin Genet Dev. 1997;7:488–494. doi: 10.1016/s0959-437x(97)80075-5. [DOI] [PubMed] [Google Scholar]
- Gunster MJ, Satijn DPE, Hamer KM, den Blaauwen JL, de Bruijn D, Alkema MJ, van Lohuizen M, van Driel R, Otte AP. Identification and characterization of interactions between the vertebrate Polycomb-Group protein BMI1 and human homologs of polyhomeotic. Mol Cell Biol. 1997;17:2326–2335. doi: 10.1128/mcb.17.4.2326. [DOI] [PMC free article] [PubMed] [Google Scholar]
- Hasegawa M, Tetsu O, Kanno R, Inoue H, Ishihara H, Kamiyasu M, Taniguchi M, Kanno M. Mammalian Polycomb Group genes are categorized as a new type of early response gene induced by B-cell receptor cross-linking. Mol Immunol. 1998;35:559–563. doi: 10.1016/s0161-5890(98)00048-0. [DOI] [PubMed] [Google Scholar]
- Hough MR, Takei F, Humphries RK, Kay R. Defective development of thymocytes overexpressing the costimulatory molecule, heat-stable antigen. J Exp Med. 1994;179:177–184. doi: 10.1084/jem.179.1.177. [DOI] [PMC free article] [PubMed] [Google Scholar]
- Hough MR, Chappel MS, Sauvageau G, Takei F, Kay R, Humphries RK. Reduction of early B lymphocyte precursors in transgenic mice overexpressing the murine heat-stable antigen. J Immunol. 1996;156:479–488. [PubMed] [Google Scholar]
- Jacobs JJ, Kieboom K, Marino S, DePinho RA, van Lohuizen M. The oncogene and Polycomb-Group gene bmi-1 regulates cell proliferation and senescence through the ink4a locus. Nature. 1999;397:164–168. doi: 10.1038/16476. [DOI] [PubMed] [Google Scholar]
- Kroon E, Krosl J, Thorsteinsdottir U, Baban S, Buchberg AM, Sauvageau G. Hoxa9 transforms primary bone marrow cells through specific collaboration with Meis1a but not Pbx1b. EMBO J. 1998;17:3714–3725. doi: 10.1093/emboj/17.13.3714. [DOI] [PMC free article] [PubMed] [Google Scholar]
- Lemieux ME, Eaves CJ. Identification of properties that can distinguish primitive populations of stromal-cell-responsive lympho-myeloid cells from cells that are stromal-cell-responsive but lymphoid-restricted and cells that have lympho-myeloid potential but are also capable of competitively repopulating myeloablated recipients. Blood. 1996;88:1639–1648. [PubMed] [Google Scholar]
- Lessard J, Baban S, Sauvageau G. Stage-specific expression of Polycomb Group genes in human bone marrow cells. Blood. 1998;91:1216–1224. [PubMed] [Google Scholar]
- Maloney KW, McGavran L, Odom LF, Hunger SP. Acquisition of p16(INK4a) and p15(INK4B) gene abnormalities between initial diagnosis and relapse in children with acute lymphoblastic leukemia. Blood. 1999;93:2380–2385. [PubMed] [Google Scholar]
- Morrison SJ, Weissman IL. The long-term repopulating subset of hematopoietic stem cells is deterministic and isolatable by phenotype. Immunity. 1994;1:661–673. doi: 10.1016/1074-7613(94)90037-x. [DOI] [PubMed] [Google Scholar]
- Pinyol M, Cobo F, Bea S, Jares P, Nayach I, Fernandez PL, Montserrat E, Cardesa A, Campo E. p16(INK4a) gene inactivation by deletions, mutations, and hypermethylation is associated with transformed and aggressive variants of non-Hodgkin's lymphomas. Blood. 1998;91:2977–2984. [PubMed] [Google Scholar]
- Satijn DPE, Otte AP. RING1 interacts with multiple Polycomb-Group proteins and displays tumorigenic activity. Mol Cell Biol. 1999;19:57–68. doi: 10.1128/mcb.19.1.57. [DOI] [PMC free article] [PubMed] [Google Scholar]
- Satijn DPE, Gunster MJ, van der Vlag J, Hamer KM, Schul W, Alkema MJ, Saurin AJ, Freemont PS, van Driel R, Otte AP. RING1 is associated with the Polycomb Group protein complex and acts as a transcriptional repressor. Mol Cell Biol. 1997;17:4105–4113. doi: 10.1128/mcb.17.7.4105. [DOI] [PMC free article] [PubMed] [Google Scholar]
- Sauvageau G, Lansdorp PM, Eaves CJ, Hogge DE, Dragowska WH, Reid DS, Largman C, Lawrence HJ, Humphries RK. Differential expression of homeobox genes in functionally distinct CD34+ subpopulations of human bone marrow cells. Proc Natl Acad Sci. 1994;91:12223–12227. doi: 10.1073/pnas.91.25.12223. [DOI] [PMC free article] [PubMed] [Google Scholar]
- Sauvageau G, Thorsteinsdottir U, Hough MR, Hugo P, Lawrence HJ, Largman C, Humphries RK. Overexpression of HOXB3 in hematopoietic cells causes defective lymphoid development and progressive myeloproliferation. Immunity. 1997;6:13–22. doi: 10.1016/s1074-7613(00)80238-1. [DOI] [PubMed] [Google Scholar]
- Schumacher A, Magnuson T. Murine Polycomb- and trithorax-Group genes regulate homeotic pathways and beyond. Trends Genet. 1997;13:167–170. [PubMed] [Google Scholar]
- Schumacher A, Faust C, Magnuson T. Positional cloning of a global regulator of anterior-posterior patterning in mice. Nature. 1996;383:250–253. doi: 10.1038/383250a0. [DOI] [PubMed] [Google Scholar]
- Schumacher A, Lichtarge O, Schwartz S, Magnuson T. The murine Polycomb-Group gene eed and its human orthologue: Functional implications of evolutionary conservation. Genomics. 1998;54:79–88. doi: 10.1006/geno.1998.5509. [DOI] [PubMed] [Google Scholar]
- Sewalt RG, van der Vlag J, Gunster MJ, Hamer KM, den Blaauwen JL, Satijn DPE, Hendrix T, van Driel R, Otte AP. Characterization of interactions between the mammalian Polycomb-Group proteins Enx1/EZH2 and EED suggests the existence of different mammalian Polycomb-Group protein complexes. Mol Cell Biol. 1998;18:3586–3595. doi: 10.1128/mcb.18.6.3586. [DOI] [PMC free article] [PubMed] [Google Scholar]
- Sinclair DA, Milne TA, Hodgson JW, Shellard J, Salinas CA, Kyba M, Randazzo F, Brock HW. The additional sex combs gene of Drosophila encodes a chromatin protein that binds to shared and unique Polycomb Group sites on polytene chromosomes. Development. 1998;125:1207–1216. doi: 10.1242/dev.125.7.1207. [DOI] [PubMed] [Google Scholar]
- Soto MC, Chou TB, Bender W. Comparison of germline mosaics of genes in the Polycomb Group of Drosophila melanogaster. Genetics. 1995;140:231–243. doi: 10.1093/genetics/140.1.231. [DOI] [PMC free article] [PubMed] [Google Scholar]
- Strutt H, Paro R. The Polycomb Group protein complex of Drosophila melanogaster has different compositions at different target genes. Mol Cell Biol. 1997;17:6773–6783. doi: 10.1128/mcb.17.12.6773. [DOI] [PMC free article] [PubMed] [Google Scholar]
- Takihara Y, Tomotsune D, Shirai M, Katoh-Fukui Y, Nishii K, Motaleb MA, Nomura M, Tsuchiya R, Fujita Y, Shibata Y, et al. Targeted disruption of the mouse homologue of the Drosophila polyhomeotic gene leads to altered anteroposterior patterning and neural crest defects. Development. 1997;124:3673–3682. doi: 10.1242/dev.124.19.3673. [DOI] [PubMed] [Google Scholar]
- Thorsteinsdottir U, Sauvageau G, Hough MR, Dragowska W, Lansdorp PM, Lawrence HJ, Largman C, Humphries RK. Overexpression of HOXA10 in murine hematopoietic cells perturbs both myeloid and lymphoid differentiation and leads to acute myeloid leukemia. Mol Cell Biol. 1997;17:495–505. doi: 10.1128/mcb.17.1.495. [DOI] [PMC free article] [PubMed] [Google Scholar]
- van der Lugt NM, Domen J, Linders K, van Roon M, Robanus-Maandag E, te Riele H, van der Valk M, Deschamps J, Sofroniew M, van Lohuizen M. Posterior transformation, neurological abnormalities, and severe hematopoietic defects in mice with a targeted deletion of the bmi-1 proto-oncogene. Genes & Dev. 1994;8:757–769. doi: 10.1101/gad.8.7.757. [DOI] [PubMed] [Google Scholar]
- van Lohuizen M. Functional analysis of mouse Polycomb Group genes. [Review] [94 refs] Cell Mol Life Sci. 1998;54:71–79. doi: 10.1007/s000180050126. [DOI] [PMC free article] [PubMed] [Google Scholar]
- van Lohuizen M, Tijms M, Voncken JW, Schumacher A, Magnuson T, Wientjens E. Interaction of mouse Polycomb-Group (Pc-G) proteins Enx1 and Enx2 with Eed: Indication for separate Pc-G complexes. Mol Cell Biol. 1998;18:3572–3579. doi: 10.1128/mcb.18.6.3572. [DOI] [PMC free article] [PubMed] [Google Scholar]
- Whitlock CA, Witte ON. Long-term culture of B lymphocytes and their precursors from murine bone marrow. Proc Natl Acad Sci. 1982;79:3608–3612. doi: 10.1073/pnas.79.11.3608. [DOI] [PMC free article] [PubMed] [Google Scholar]