

Abstract
A large body of evidence indicates that the immune microenvironment controls tumour development. Primary central nervous system lymphomas (PCNSL) are aggressive tumours growing in the central nervous system (CNS). To evaluate the role and characteristics of this immune-privileged site in anti-tumour defences, we compared the cellular and molecular immune microenvironments of growing murine lymphoma B cells injected into the brain or the spleen. In the brain, immune cells, including dendritic cells and T lymphocytes with a large proportion of CD4+forkhead box P3 (FoxP3+) regulatory T cells, rapidly infiltrated the tumour microenvironment. These populations also increased in number in the spleen. The T cell cytokine profiles in tumour-bearing mice were similar in the two sites, with predominant T helper type 1 (Th1)/Th17 polarization after polyclonal stimulation, although some interleukin (IL)-4 could also be found. We demonstrated that these T cells have anti-tumour activity in the CNS, although less than in the spleen: nude mice that received lymphoma cells intracerebrally died significantly earlier than immunocompetent animals. These results demonstrate that the brain is able to recruit all the major actors to mount a specific anti-tumour immune response against lymphoma.
Keywords: immune microenvironment, intracerebral B cell lymphoma, intrasplenic B cell lymphoma, lymphocytes, privileged site
Introduction
Lymphomas are solid tumours growing in secondary lymphoid organs (the spleen or lymph nodes) or in the central nervous system (CNS). Primary central nervous system lymphomas (PCNSL), mainly of B cell origin, can be located either in the brain (primary cerebral lymphomas, PCL) or in the eyes (primary intraocular lymphomas, PIOL) [1]. PCNSL are generally classified according to morphological and histological criteria as diffuse large B cell lymphomas (DLBCL). To date, molecular and immunohistochemical analyses have been unable to discriminate between PCNSL and their peripheral counterparts, perhaps because of the great heterogeneity of B lymphomas [2–5]. PCNSL, however, have a less favourable prognosis than systemic lymphomas, with 5-year survival of only 30% with aggressive treatment [6,7]. One hypothesis, for which there is currently no corroborating evidence, is that tumour cells may differ between these sites. It is also, however, essential to consider the so-called ‘immune sanctuary’ in which PCNSL grow.
The CNS has long been considered to be an immune-privileged site [8,9]. Arguments supporting this idea include the relative isolation of the CNS by the blood–brain barrier, which precludes the entry of blood cells, the absence of a conventional lymphatic system, the absence of T lymphocytes or dendritic cells in quiescent brain parenchyma and constitutive immunosuppression regulated by factors such as transforming growth factor (TGF)-β, vasoactive intestinal peptide (VIP), neuropeptides or vitamin D3 secreted by CNS cells. Microglial cells are the main resident immune population of the CNS [10] and are responsible for immune surveillance in this delicate site [11]. Activated microglial cells are characterized by high secretory activity that allows them to regulate local immune responses [12], and they can present antigen to infiltrating CD4+ or CD8+ T lymphocytes. Local immunosuppression, however, actively maintains them in a quiescent state with very little to no expression of major histocompatibility complex (MHC) class II or co-stimulatory molecules.
These mechanisms, all important for avoiding inappropriate inflammatory reactions, also make the CNS a permissive environment for tumour development. Glioma growth in mice affects microglial cells, impairing their capacity for up-regulation of MHC class II and co-stimulatory molecules and their antigen presentation to T cells [13,14]. Microglial cells readily infiltrate the tumour mass and contribute to local immunosuppression by secreting large amounts of interleukin (IL)-10 [15]. T lymphocytes also infiltrate glioma samples [16,17], but little is currently known about the involvement of these cells in anti-tumour responses.
To gain insight into anti-tumour responses in an immune sanctuary, we compared the tumour growth and immune microenvironments of a murine B cell lymphoma after injection into the brain or the spleen. In view of the great heterogeneity of cerebral and peripheral lymphomas and in the absence of murine and human PCNSL cell lines, we chose to work on a well-characterized murine B cell lymphoma cell line. Any difference in the anti-tumour immune response between the two sites should be attributable to the local microenvironment. We showed the existence of T cell anti-tumour immunity against this lymphoma in both models. Moreover, the cellular and molecular immune environments of these growing B cell lymphomas were surprisingly similar, with T helper type 1 (Th1)/Th2/Th17 polarization of the response.
Materials and methods
Mice
Female BALB/c mice or BALB/c-nude mice (H-2d) were obtained from Charles River Laboratories (L'Arbresle, France) and used between 6 and 8 weeks of age. They were provided with sterile food and water ad libitum and kept on a 12-h light–dark cycle. All procedures involving mice conformed with European Union guidelines, French regulations for animal experimentation (Ministry of Agriculture Act no. 2001–464, May 2001) and the guidelines of the Institut National de la Santé et de la Recherche Médicale Committee on Animal Research, and were approved by the relevant local committees.
Cells
A20.IIA is an FcγR-negative clone originating from the A20-2J lymphomatous B cell line. A20.IIA cells were transfected with the green fluorescent protein (GFP) gene, as described previously [18]. Hereafter referred to as A20.IIA-GFP cells, they were maintained at 37°C, 5% CO2 in complete RPMI-1640 medium (Glutamax; Invitrogen, Cergy Pontoise, France) supplemented with 10% fetal calf serum (FCS), 10 mM sodium pyruvate, 50 µM 2-mercaptoethanol and 0·5 mg/ml neomycin.
Tumour implantation
Mice were first anaesthetized by intraperitoneal (i.p.) injection of a mixture containing 120 mg/kg of ketamine and 6 mg/kg of xylazine. For the intracerebral tumour implantation, anaesthetized mice were immobilized on a stereotaxic frame (David Kopf Instruments, Tujunga, CA, USA). Tumour cells (5 × 10⁴ in a final volume of 2 µl) were injected to a depth of 2 mm to the right of the medial suture and 0·4 mm in front of the bregma, through a Hamilton syringe attached to a penetrating depth controller. The penetrating depth of the syringe was 2·5 mm from the surface of the brain. Each injection delivered the solution slowly, and the syringe was held in place for an additional minute to reduce backfilling of tumour cells. The same procedure was followed for control mice injected with phosphate-buffered saline (PBS).
For the intrasplenic model, the skin was excised on the left flank of each mouse and the peritoneal cavity opened just above the spleen. The extremity of the spleen was then grasped and tumour cells (5 × 10⁵ in a final volume of 100 µl) were injected slowly through an insulin syringe. The same procedure was followed for control mice injected with PBS.
Histology and immunohistochemistry
Mice were euthanized by cervical dislocation. Organs were immediately fixed in a solution of 5% sucrose containing 4% paraformaldehyde for 2 h and then immersed for 4 h in 5% sucrose and overnight in 15% sucrose. Organs were frozen at −80°C and 10-µm sections were cut in a cryostat (Leica Microsystems, Heidelberg, Germany). After the brain or spleen slices were thawed at room temperature for several minutes, the saturation step was performed by incubating the slices for 30 min at room temperature in a solution of anti-CD16/CD32 monoclonal antibody (mAb) (5 µg/ml; 2·4G2) supplemented with 10% normal mouse serum. Tissue slices were then incubated for 1 h at room temperature with phycoerythrin (PE)-coupled anti-CD4 (GK1·5; BD Biosciences, Le Pont-de-Claix, France), anti-CD8 (53–5·8; BD Biosciences), anti-CD11b (M1/70; BD Biosciences) or anti-CD11c (N418; e-Biosciences, San Diego, CA, USA) mAb. After washing steps in 1 × PBS, slides were mounted with fluoromount medium with or without 4′,6-diamidino-2-phenylindole (DAPI) (Vector Laboratories–CliniSciences, Montrouge, France) and maintained at 4°C, protected from light, until analysis.
Brain mononuclear cell isolation
To isolate mononuclear cells, brains were subjected to mechanical disruption and then digested for 30 min at 37°C with 0·1 mg/ml DNAse (Roche Diagnostics, Meylan, France) and 1·67 Wûnsch units/ml Liberase (Roche Diagnostics). Brain homogenates were then separated on a discontinuous 30:70% Percoll gradient (Sigma-Aldrich, Saint Quentin Fallavier, France), and the cells collected at the interface were carefully washed.
Flow cytometry
After 20 min of Fc receptor saturation with 10 µg/ml anti-CD16/CD32 mAb (clone 2·4.G2), cells were incubated for 20 min with the following mAbs: Pacific Blue-conjugated anti-CD3 (145-2C11; BD Biosciences), PE-Texas Red-conjugated anti-CD4 (GK1·5; BD Biosciences), Alexa-700 anti-CD8 (53–6·7; BD Biosciences), Alexa-647 anti-Foxp3 (MF23; BD Biosciences), PE-conjugated anti-CD19 (6D5; e-Bioscience), Pacific-Blue-conjugated anti-CD11b (M1/70; Biolegend, San Diego, CA, USA), allophycocyanin-conjugated anti-CD11c (HL3; BD Biosciences), or with the corresponding isotypic mAb controls (all from BD Biosciences). Cell phenotypes were analysed with the LSRII cytometer and Diva software (BD Biosciences).
Brain and spleen cell stimulation and cytokine measurement
Brain or spleen cells (105) were stimulated with anti-CD3/CD28 monoclonal antibody coated beads (Dynabeads, Dynal Biotech, Compiègne, France), as recommended by the manufacturer. To detect IL-2, IL-4, IL-6, IL-10, interferon (IFN)-γ and granulocyte-macrophage colony-stimulating factor (GM-CSF) cytokines, we subjected supernatants collected after 36 h to cytometric bead array analysis according to the manufacturer's instructions (mouse Th1/Th2 cytokine kit; BD Biosciences). IL-17 detection, developed in our laboratory, used a cytometric bead array.
Statistical analysis
Comparisons used Student's t-test and Kaplan–Meier curves, performed with GraphPad Prism (GraphPad Software, La Jolla, CA, USA). Statistical significance was defined by P-values less than 0·05.
Results
Brain and spleen tumour microenvironments contain high numbers of antigen-presenting cells (APC) including dendritic cells
The A20.IIA lymphomatous B cells transfected with GFP (A20.IIA-GFP) were injected either by stereotaxy into the right striatum of adult syngeneic BALB/c mice (PCL model) or directly into the spleen for the intrasplenic lymphoma (ISL) model. When tumour cells were implanted into the brain at day 0, animals began to die at day 23, and all the mice were dead before day 40. As expected, all the control mice injected with PBS survived throughout the experiment without any neurological signs. In the ISL model, 70% of the mice died between days 30 and 50. Kinetics of tumour growth was evaluated by flow cytometry. B tumour cells were detected by the concomitant expression of GFP and CD19 and could be discriminated from endogenous B cells that did not express GFP (Fig. 1a). As shown in Fig. 1b, tumour cells were detected easily in the brain on day 9 and accounted for 10% of all isolated cells. In the spleen, they accounted for no more than 1% of all analysed cells. Tumour growth then accelerated (on day 21 brain and spleen cells accounted, respectively, for 15% and 10% of total isolated cells) and on day 29 tumour cells accounted for almost 15% of all analysed cells in both tumour models (that is, 2 million tumour cells in the PCL model and 70 million in the ISL model). Simultaneously, the PCL-bearing mice showed clinical signs including weight loss and ataxia.
Fig. 1.
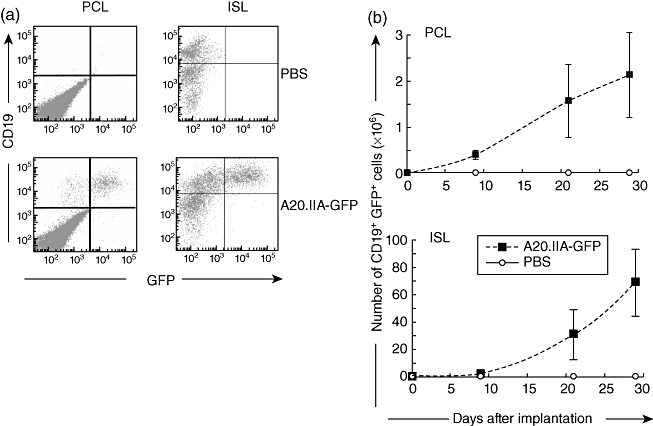
Kinetics of tumour growth in the brain and the spleen. (a) Flow cytometric analyses of double-positive green fluorescent protein (GFP+) CD19+ tumour cells 21 days after tumour or phosphate-buffered saline (PBS) injection into the brain [primary cerebral lymphomas (PCL)] or spleen [intrasplenic lymphoma (ISL)] of adult mice. (b) Kinetic analysis of tumour growth in mice implanted with 5 × 10⁴ (PCL) or 5 × 10⁵ (ISL) A20.IIA-GFP cells (dashed lines) or PBS (black line). Results from two independent experiments (n = 10).
As Fig. 2a shows, resident CD11b+ cells were detected in control brains, corresponding most probably to resident microglial cells present constitutively in the CNS. In the presence of the lymphoma, the number of CD11b+ cells (corresponding to microglia and possibly to infiltrating macrophages) increased in the brain; they were first observed on day 21, although they had been visible since day 9 in the spleen (Fig. 2a). As expected, CD11c+ dendritic cells were almost undetectable in PBS-injected brains. During tumour growth, however, a large population of dendritic cells was detected in the brain parenchyma, increasing from day 9 (0·5 × 106 cells) to day 29 (0·85 × 106 cells per brain). This increase in the number of dendritic cells was also observed in the ISL model, where the CD11c+ population tripled by day 29.
Fig. 2.
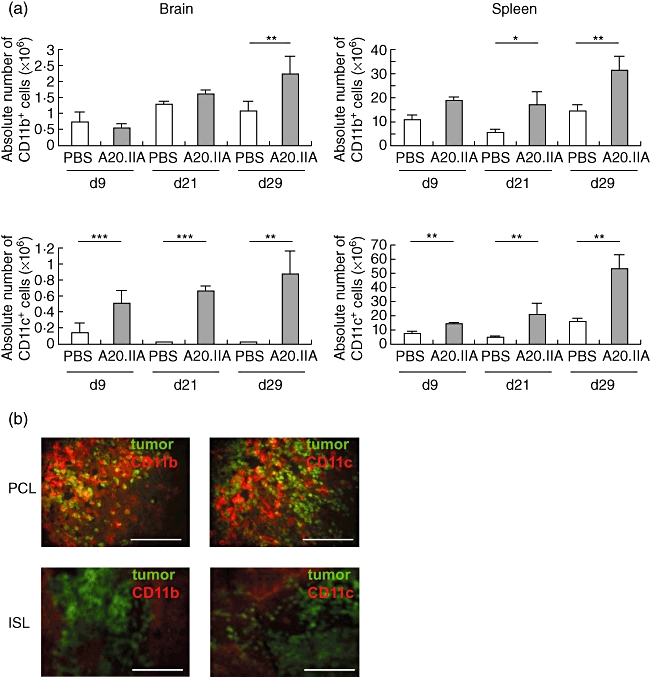
Involvement of antigen-presenting cells in the anti-tumour response in primary cerebral lymphomas (PCL) and intrasplenic lymphoma (ISL). (a) Histograms illustrating the absolute numbers of CD11b+ (upper panels) and of CD11c+ (lower panels) antigen-presenting cells during growth of PCL (left panels) and ISL (right panels), with A20.IIA-green fluorescent protein (GFP) cells, compared with phosphate-buffered saline (PBS)-injected animals, as determined by flow cytometric analyses and trypan blue exclusion (two independent experiments, n = 10). *P < 0·05; **P < 0·005; ***P < 0·0005. (b) Representative photomicrographs of brain and spleen slices at day 21, stained with phycoerythrin (PE)-conjugated anti-CD11b or anti-CD11c antibodies. GFP-positive tumour cells are green. Bars = 200 µm.
Immunohistochemical staining of the CD11b+ and CD11c+ cells in the two tumour models revealed that both were located close to the tumour mass (Fig. 2b). They formed a tight network with lymphomatous B cells. In the PCL model, surprisingly, there were nearly as many CD11b+ cells as GFP+ cells. Moreover, there was only weak CD11b staining in the brain and none for CD11c outside the tumour. The brain parenchyma from PCL mice showed no signs of haemorrhage. In the spleen, interweaving CD11b+ and CD11c+ cells were less visible and mainly defined circular structures around tumour cells.
During tumour growth, the brain acquires a T cell microenvironment closely mimicking a secondary lymphoid organ with a high proportion of regulatory T cells
We next evaluated the presence of T cells at the tumour site. The absence, as expected, of CD3+ T lymphocyte infiltration in brains injected with PBS at any time of analysis showed that the surgical procedure did not create measurable inflammation (Fig. 3a, upper left panel). In contrast, as illustrated in Fig. 3a (lower left panel), CD3+ T cells clearly infiltrated the brain after the intrastriatal tumour implantation. These cells were dispersed throughout the tumour mass and at the tumour margins but were not found in the non-tumoral brain parenchyma (see Fig. 3b). T cells in the spleen were much more tightly grouped (Fig. 3b), but it was not possible to discriminate between resident and infiltrating T cells.
Fig. 3.
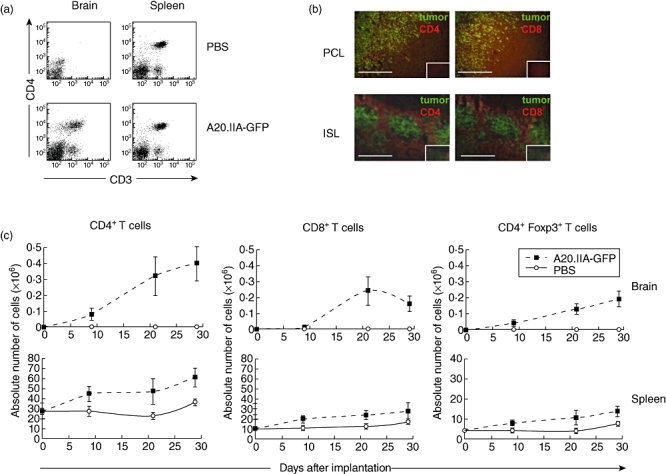
T cell enhancement in primary cerebral lymphomas (PCL) and intrasplenic lymphoma (ISL). (a) Flow cytometric analysis showing CD3+CD4+ staining in the PCL and ISL models 21 days after phosphate-buffered saline (PBS) injection or tumour implantation. (b) Immunohistological analyses of PCL and ISL slices showing green fluorescent protein (GFP+) tumour cells and CD4+ or CD8+ T lymphocytes stained in red. Isotypic controls are shown in the small inner boxes for each corresponding photomicrograph. (c) Flow cytometric analysis of the absolute number of CD3+CD4+ (left), CD3+CD8+ (middle) or CD3+CD4+forkhead box P3 (FoxP3+) (right) T lymphocytes infiltrating the brain or spleen over time in the PCL and ISL models (two independent experiments, n = 10).
Both models contained more CD4+ than CD8+ T cells at all points during disease progression (Fig. 3c). In the brain, the number of these cells increased slowly over the first 9 days and then rapidly reached a plateau around day 21. Interestingly, infiltration of CD4+ T cells into the brain occurred almost immediately after tumour implantation, while that of CD8+ T cells took place only after 9 days. Similarly, the absolute number of CD4+ and CD8+ T lymphocytes in the spleen increased compared with the controls during tumour growth (Fig. 3c).
Naturally occurring regulatory T cells (Treg) are defined by their constitutive expression of the transcription factor forkhead box P3 (FoxP3). Soon after tumour implantation into brains, a large infiltration of CD4+CD25+FoxP3+ cells was observed; it increased gradually, in proportion to the tumour burden (Fig. 3c). On day 29, Treg cells accounted for 40% of the CD4+ T cell population. In the ISL models, the CD4+CD25+FoxP3+ population on day 29 was twice as high as in the controls. However, it still represented no more than 25% of the CD4+ T cell population (Fig. 3c).
Concomitant Th1/Th2/Th17 polarization in intracerebral and intrasplenic B cell lymphomas
Because the absence of an effective anti-tumour response was not due to the absence of major immune cell subsets, even in the brain, we hypothesized that T cell polarization could be strongly affected. Polarization of the intratumour T lymphocytes was analysed in the PCL and ISL models by measuring cytokine secretion of total cells isolated from the brain or from splenocytes after stimulation with anti-CD3/CD28 antibodies. As Fig. 4 shows, no significant production of Th1-, Th2- or Th17-related cytokines was found in the control cells when PBS was injected without T cell stimulation into the brain or spleen. In the presence of the lymphomatous B cells, only IFN-γ, TNF-α and, to a lesser extent, IL-10 were produced in both PCL and ISL models. As expected, under polyclonal T cell activation by CD3/CD28 stimulation, splenocytes without tumours secreted high levels of Th1-, Th2- and Th17-related cytokines. Conversely, cells isolated from the brain did not express marked levels of any of these, because of the absence of resident T cells. Interestingly, in the presence of tumour cells and after T cell stimulation, IL-2, IFN-γ, GM-CSF, IL-4 and IL-17 were induced in both the PCL and the ISL models. This induction suggests concomitant Th1/Th2/Th17 profiles.
Fig. 4.
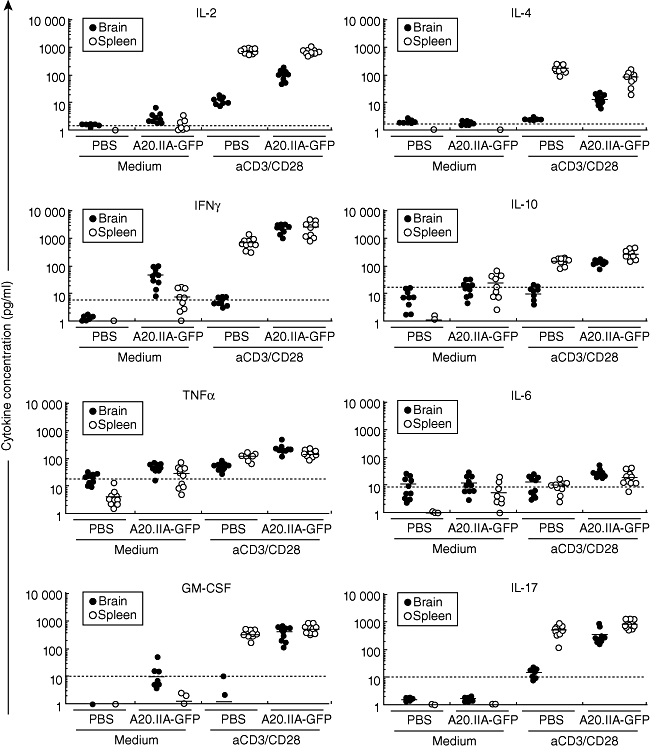
Similar cytokine profiles in the primary cerebral lymphomas (PCL) and intrasplenic lymphoma (ISL) tumour microenvironments. phosphate-buffered saline (PBS) or A20.IIA-green fluorescent protein (GFP) cells were injected into the brain (black circles) or the spleen (white circles) of adult BALB/c mice. On day 21, cells isolated from the brain or splenocytes were cultivated for 36 h with (aCD3/CD28) or without (medium) anti-CD3/CD28-coated beads, and supernatants were analysed for interleukin (IL)-2, IL-4, IL-6, IL-10, interferon (IFN)-γ, tumour necrosis factor (TNF)-α, granulocyte-macrophage colony-stimulating factor (GM-CSF) and IL-17 expression (two independent experiments, n = 10). The dashed horizontal line indicates the level of expression significant for each cytokine, as indicated by the manufacturer.
Intracerebral and intrasplenic lymphoma triggers T cell anti-tumour responses
To determine the role of T cells in these models, tumours were implanted in nude and wild-type mice. As shown in Fig. 5, nude mice that received lymphoma cells intracerebrally died significantly earlier than wild-type mice (median survival time: 20 days versus 29 days, respectively; P = 0·01). Similarly, nude mice with intrasplenic lymphomas started to die earlier than wild-type mice (day 20 and day 34, respectively; P = 0·02). These results demonstrate that T cell anti-tumour responses control survival in mice with developing intracerebral or intrasplenic tumours.
Fig. 5.
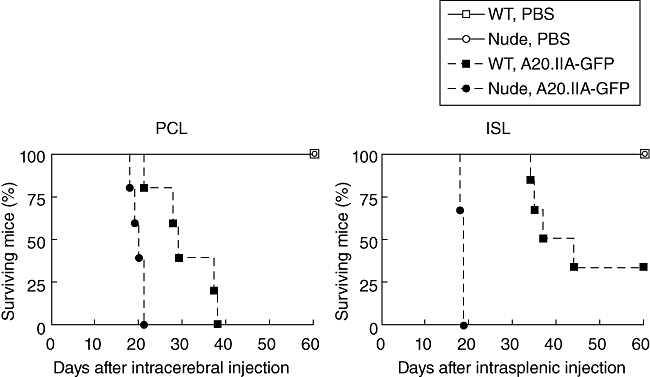
Primary cerebral lymphomas (PCL) and intrasplenic lymphoma (ISL) trigger T cell immune surveillance. Kaplan–Meier curves showing the survival time of wild-type (squares) or nude (circles) mice that had either phosphate-buffered saline (PBS) (white marks, solid lines) or A20.IIA-green fluorescent protein (GFP) cells (black marks, dashed lines) implanted in the brain (PCL) or in the spleen (ISL) (n = 6).
Discussion
The prognosis of tumours growing in immune sanctuaries such as the brain or the eyes is often poor. Their location, and the absence of metastasis towards peripheral sites, make a global analysis of their environment difficult. Animal models can thus be useful to investigate the role of the tissue environment on anti-tumour response. Gliomas are the most frequent aggressive brain tumours, but do not grow in peripheral organs. Lymphomas, on the other hand, provide a good basis for comparison between central and peripheral malignancies as they can grow as a primary tumour in both sites. We therefore compared immune responses developing in the spleen and the brain after implantation of the same lymphoma B cell line.
The absence of resident T lymphocytes and the very few CD11c+ dendritic cells detected in the brain parenchyma of control mice injected intracranially with PBS show that the injury caused by the syringe did not interfere with the immune response observed after tumour implantation. CD11b+ microglial cells were the only type of resident immune cell. Although the meninges were dissected carefully to remove associated blood vessels, we cannot rule out the possibility that some blood cells were entrapped and were present in our analyses. However, flow cytometry experiments comparing the immune cells present in a normal mouse brain with and without NaCl perfusion showed no significant differences (data not shown). The incidence of the disease after intracerebral tumour growth was 100%. Tumour cells invaded the parenchyma of the right hemisphere and, in some cases, infiltrated the meninges, the ventricular system, or both. Consistent with human data, no GFP-positive cells were found outside the brain, except for a very few cells in the cervical lymph nodes. Indeed, PCNSL is defined as a tumour growing in the confined environment of the CNS, without migration to the periphery. During tumour growth, the number of CD11b+ microglia and blood-derived macrophages increased, and these cells invaded the tumour mass. A recent study described the presence of macrophages expressing M2-associated markers, such as Ym1 in a murine model or factor XIIIA in humans [19], in the CNS lymphoma environment. In our PCL model, IL-4 was produced by activated T cells from tumour-bearing animals; it may play a role in the differentiation of microglial/macrophage cells into M2-type cells. In mice with intracerebral tumours, massive infiltration of CD11c+ cells into the brain was observed. These cerebral dendritic cells may derive from the blood, the meninges, the choroid plexus or from microglia by local differentiation [20–22]. In tumour masses, where blood vessels are disorganized, at least some of the CD11c+ cells must be blood-derived. Consistent with this hypothesis, histological analyses showed that CD11c+ cells were present only in the tumour environment and not in the peritumoural brain tissue. In the spleen, discrimination between recruited and resident immune cells is difficult. However, the total number of CD11c+ cells increased. The study of APC subpopulations in cerebral lymphoma and their potential involvement in tumour growth requires further investigation.
CD4+ T cells were detected from day 9 and continued to infiltrate the brain parenchyma throughout the disease course, as shown previously for an intraocular lymphoma model [18]. The number of splenic T cells doubled during tumour growth in the ISL model. Interestingly, recruitment of CD3+CD8+ cells in the brain took place later than that of CD4+ T cells; consistent with a previous study that used glioma cells, this was not the case in the spleen [17]. Moreover, T cells were not organized in tertiary lymphoid structures, as described for lung tumours [23].
In both the PCL and ISL models, a clear Th1 profile was observed, with secretion of IL-2, IFN-γ and GM-CSF after T lymphocyte activation, even though cytokines were not detectable without estimation. Only a modest increase in Th2 cytokine levels was noticed. T cells in the tumour environment thus appear to be at least partially inhibited. Regulatory T cells were indeed present and represented an important proportion of total CD4+ T cells in our two tumour models, especially in the brain. This finding is in accordance with the recent work from Biollaz and colleagues [24], which showed preferential enrichment of Tregs in the brain versus subcutaneous location during glioma growth.
It was demonstrated recently that Tregs play a fundamental role in B lymphoma immune escape [25,26] and that follicular [27] and non-Hodgkin lymphomas [28] allow the phenoconversion of conventional T lymphocytes into induced Tregs. Our results, which show that up to 40% of T cells were CD4+CD25+FoxP3+ in the brain, are also suggestive of phenoconversion. This high level of recruitment of CD25+FoxP3+ T cells could conceivably be due to local secretion of CCL17 and CCL22, as observed in lymphomatous meningitis [29]. These possibilities are under investigation in intracerebral and in intraocular B cell lymphoma models.
We found high levels of IL-17 in our two tumour models, in addition to Th1 and Treg cells. IL-17 and Th17 cells have been found in human B cell lymphomas although with great heterogeneity between patients [30], but IL-17 has not been described previously in a brain tumour model. Brain is a permissive tissue for Th17 [31]. However, the role of Th17 cells in anti-tumour immunity is still unclear. It has notably been described as a transient population of cells co-expressing transcription factors FoxP3 and RORγt, able to secrete IL-17, and endowed with either regulatory or proinflammatory functions, depending on the environment [32,33]. A recent study showed that B cell lymphomas can skew the balance towards the regulatory profile of this population [30].
Our results suggest that the cellular components of the immune environment evolve similarly during tumour growth in the brain and the spleen. The CNS has long been considered a site of immune privilege. Although it is now accepted that immune responses can occur there, it is equally accepted that the CNS is endowed with a special immune status. The quiescent brain is protected by the blood–brain barrier, the absence of a conventional lymphatic system, little to no MHC expression, its lack of dendritic cells and the constitutive secretion of immune-suppressive molecules. We hypothesize that this status is not altered at the beginning of tumour growth. In a second step, however, glial cells (microglial cells and astrocytes) may be activated and thus able to activate local endothelial cells. As a consequence, the blood–brain barrier may tend to permit T lymphocytes expressing the appropriate adhesion molecules to enter the brain. This hypothesis explains how CD4+ T cells were clearly detected at day 9 in the PCL model, whereas CD8+ T cells were not. These infiltrating cells are essential in ensuring immune surveillance of the brain, as our results with nude mice show. In a third step, when the tumour is larger, angiogenesis must also be considered. New vessels do not reproduce the blood–brain barrier structure, and blood cells can easily enter the brain. Accordingly, it is not surprising to observe an immune environment ever more similar in both PCL and ISL models by day 29. It also suggests that the tumour exerts a powerful stimulus to attract immune cells despite very different initial environments.
Organ specificities can, however, be observed during the course of B cell lymphoma in the brain versus the spleen: delayed entry of T cells, due probably to the blood–brain barrier, and a higher proportion of regulatory T cells. The huge intratumoural immune infiltrate lends support to therapeutic strategies based on immunostimulation of anti-tumour responses for the treatment of CNS lymphomas. Thus, systemic approaches should be translated in light of the specificities of the relevant tissue and, particularly, of T cell recruitment in the CNS parenchyma.
Acknowledgments
The authors thank Christophe Klein for confocal microscopy. Flow cytometry and confocal microscopy acquisitions were performed at the cellular imaging and cytometry platform (CICC, Centre de Recherche des Cordeliers, Paris F-75006, France). We are grateful to Jessica A. Boland and Dr Zsuzsanna Fabry for their careful reading of the manuscript. This work was supported by the Institut National du Cancer (grants RC013-C06N631-2005 and C06N748-2006), the Institut National de la Santé et de la Recherche Médicale, the University Pierre and Marie Curie, the University Paris-Descartes and the Association pour la Recherche contre le Cancer. S. D. and C. D. were recipients of grants from the Institut National du Cancer.
Disclosure
The authors declare they have no financial conflicts of interest.
References
- 1.Soussain C, Hoang-Xuan K. Primary central nervous system lymphoma: an update. Curr Opin Oncol. 2009;21:550–8. doi: 10.1097/CCO.0b013e3283310eb3. [DOI] [PubMed] [Google Scholar]
- 2.Lin CH, Kuo KT, Chuang SS, et al. Comparison of the expression and prognostic significance of differentiation markers between diffuse large B-cell lymphoma of central nervous system origin and peripheral nodal origin. Clin Cancer Res. 2006;12:1152–6. doi: 10.1158/1078-0432.CCR-05-1699. [DOI] [PubMed] [Google Scholar]
- 3.Tun HW, Personett D, Baskerville KA, et al. Pathway analysis of primary central nervous system lymphoma. Blood. 2008;111:3200–10. doi: 10.1182/blood-2007-10-119099. [DOI] [PMC free article] [PubMed] [Google Scholar]
- 4.Camilleri-Broet S, Criniere E, Broet P, et al. A uniform activated B-cell-like immunophenotype might explain the poor prognosis of primary central nervous system lymphomas: analysis of 83 cases. Blood. 2006;107:190–6. doi: 10.1182/blood-2005-03-1024. [DOI] [PubMed] [Google Scholar]
- 5.Montesinos-Rongen M, Brunn A, Bentink S, et al. Gene expression profiling suggests primary central nervous system lymphomas to be derived from a late germinal center B cell. Leukemia. 2008;22:400–5. doi: 10.1038/sj.leu.2405019. [DOI] [PMC free article] [PubMed] [Google Scholar]
- 6.Jahnke K, Thiel E. Treatment options for central nervous system lymphomas in immunocompetent patients. Expert Rev Neurother. 2009;9:1497–509. doi: 10.1586/ern.09.100. [DOI] [PubMed] [Google Scholar]
- 7.Schultz CJ, Bovi J. Current management of primary central nervous system lymphoma. Int J Radiat Oncol Biol Phys. 2010;76:666–78. doi: 10.1016/j.ijrobp.2009.10.011. [DOI] [PubMed] [Google Scholar]
- 8.Galea I, Bechmann I, Perry VH. What is immune privilege (not)? Trends Immunol. 2007;28:12–18. doi: 10.1016/j.it.2006.11.004. [DOI] [PubMed] [Google Scholar]
- 9.Medawar PB. Immunity to homologous grafted skin; the fate of skin homografts transplanted to the brain, to subcutaneous tissue, and to the anterior chamber of the eye. Br J Exp Pathol. 1948;29:58–69. [PMC free article] [PubMed] [Google Scholar]
- 10.Kaur G, Han SJ, Yang I, Crane C. Microglia and central nervous system immunity. Neurosurg Clin N Am. 2010;21:43–51. doi: 10.1016/j.nec.2009.08.009. [DOI] [PubMed] [Google Scholar]
- 11.Nimmerjahn A, Kirchhoff F, Helmchen F. Resting microglial cells are highly dynamic surveillants of brain parenchyma in vivo. Science. 2005;308:1314–18. doi: 10.1126/science.1110647. [DOI] [PubMed] [Google Scholar]
- 12.Aloisi F. Immune function of microglia. Glia. 2001;36:165–79. doi: 10.1002/glia.1106. [DOI] [PubMed] [Google Scholar]
- 13.Badie B, Bartley B, Schartner J. Differential expression of MHC class II and B7 costimulatory molecules by microglia in rodent gliomas. J Neuroimmunol. 2002;133:39–45. doi: 10.1016/s0165-5728(02)00350-8. [DOI] [PubMed] [Google Scholar]
- 14.Schartner JM, Hagar AR, Van Handel M, Zhang L, Nadkarni N, Badie B. Impaired capacity for upregulation of MHC class II in tumor-associated microglia. Glia. 2005;51:279–85. doi: 10.1002/glia.20201. [DOI] [PubMed] [Google Scholar]
- 15.Yang I, Han SJ, Kaur G, Crane C, Parsa AT. The role of microglia in central nervous system immunity and glioma immunology. J Clin Neurosci. 2010;17:6–10. doi: 10.1016/j.jocn.2009.05.006. [DOI] [PMC free article] [PubMed] [Google Scholar]
- 16.Prins RM, Shu CJ, Radu CG, et al. Anti-tumor activity and trafficking of self, tumor-specific T cells against tumors located in the brain. Cancer Immunol Immunother. 2008;57:1279–89. doi: 10.1007/s00262-008-0461-1. [DOI] [PMC free article] [PubMed] [Google Scholar]
- 17.Proescholdt MA, Merrill MJ, Ikejiri B, et al. Site-specific immune response to implanted gliomas. J Neurosurg. 2001;95:1012–19. doi: 10.3171/jns.2001.95.6.1012. [DOI] [PubMed] [Google Scholar]
- 18.Touitou V, Daussy C, Bodaghi B, et al. Impaired th1/tc1 cytokine production of tumor-infiltrating lymphocytes in a model of primary intraocular B-cell lymphoma. Invest Ophthalmol Vis Sci. 2007;48:3223–9. doi: 10.1167/iovs.07-0008. [DOI] [PubMed] [Google Scholar]
- 19.Kadoch C, Dinca EB, Voicu R, et al. Pathologic correlates of primary central nervous system lymphoma defined in an orthotopic xenograft model. Clin Cancer Res. 2009;15:1989–97. doi: 10.1158/1078-0432.CCR-08-2054. [DOI] [PMC free article] [PubMed] [Google Scholar]
- 20.Fischer HG, Reichmann G. Brain dendritic cells and macrophages/microglia in central nervous system inflammation. J Immunol. 2001;166:2717–26. doi: 10.4049/jimmunol.166.4.2717. [DOI] [PubMed] [Google Scholar]
- 21.Hatterer E, Touret M, Belin MF, Honnorat J, Nataf S. Cerebrospinal fluid dendritic cells infiltrate the brain parenchyma and target the cervical lymph nodes under neuroinflammatory conditions. PLoS ONE. 2008;3:e3321. doi: 10.1371/journal.pone.0003321. [DOI] [PMC free article] [PubMed] [Google Scholar]
- 22.Nataf S, Strazielle N, Hatterer E, Mouchiroud G, Belin MF, Ghersi-Egea JF. Rat choroid plexuses contain myeloid progenitors capable of differentiation toward macrophage or dendritic cell phenotypes. Glia. 2006;54:160–71. doi: 10.1002/glia.20373. [DOI] [PubMed] [Google Scholar]
- 23.Dieu-Nosjean MC, Antoine M, Danel C, et al. Long-term survival for patients with non-small-cell lung cancer with intratumoral lymphoid structures. J Clin Oncol. 2008;26:4410–17. doi: 10.1200/JCO.2007.15.0284. [DOI] [PubMed] [Google Scholar]
- 24.Biollaz G, Bernasconi L, Cretton C, et al. Site-specific anti-tumor immunity: differences in DC function, TGF-beta production and numbers of intratumoral Foxp3+ Treg. Eur J Immunol. 2009;39:1323–33. doi: 10.1002/eji.200838921. [DOI] [PubMed] [Google Scholar]
- 25.Curti A, Pandolfi S, Valzasina B, et al. Modulation of tryptophan catabolism by human leukemic cells results in the conversion of CD25- into CD25+ T regulatory cells. Blood. 2007;109:2871–7. doi: 10.1182/blood-2006-07-036863. [DOI] [PubMed] [Google Scholar]
- 26.Elpek KG, Lacelle C, Singh NP, Yolcu ES, Shirwan H. CD4+CD25+ T regulatory cells dominate multiple immune evasion mechanisms in early but not late phases of tumor development in a B cell lymphoma model. J Immunol. 2007;178:6840–8. doi: 10.4049/jimmunol.178.11.6840. [DOI] [PubMed] [Google Scholar]
- 27.Ai WZ, Hou JZ, Zeiser R, Czerwinski D, Negrin RS, Levy R. Follicular lymphoma B cells induce the conversion of conventional CD4+ T cells to T-regulatory cells. Int J Cancer. 2009;124:239–44. doi: 10.1002/ijc.23881. [DOI] [PMC free article] [PubMed] [Google Scholar]
- 28.Mittal S, Marshall NA, Duncan L, Culligan DJ, Barker RN, Vickers MA. Local and systemic induction of CD4+CD25+ regulatory T-cell population by non-Hodgkin lymphoma. Blood. 2008;111:5359–70. doi: 10.1182/blood-2007-08-105395. [DOI] [PubMed] [Google Scholar]
- 29.Haas J, Schopp L, Storch-Hagenlocher B, et al. Specific recruitment of regulatory T cells into the CSF in lymphomatous and carcinomatous meningitis. Blood. 2008;111:761–6. doi: 10.1182/blood-2007-08-104877. [DOI] [PubMed] [Google Scholar]
- 30.Yang ZZ, Novak AJ, Ziesmer SC, Witzig TE, Ansell SM. Malignant B cells skew the balance of regulatory T cells and TH17 cells in B-cell non-Hodgkin's lymphoma. Cancer Res. 2009;69:5522–30. doi: 10.1158/0008-5472.CAN-09-0266. [DOI] [PMC free article] [PubMed] [Google Scholar]
- 31.Ifergan I, Kebir H, Bernard M, et al. The blood–brain barrier induces differentiation of migrating monocytes into Th17-polarizing dendritic cells. Brain. 2008;131:785–99. doi: 10.1093/brain/awm295. [DOI] [PubMed] [Google Scholar]
- 32.Zhou L, Chong MM, Littman DR. Plasticity of CD4+ T cell lineage differentiation. Immunity. 2009;30:646–55. doi: 10.1016/j.immuni.2009.05.001. [DOI] [PubMed] [Google Scholar]
- 33.Zhou L, Lopes JE, Chong MM, et al. TGF-beta-induced Foxp3 inhibits T(H)17 cell differentiation by antagonizing RORgammat function. Nature. 2008;453:236–40. doi: 10.1038/nature06878. [DOI] [PMC free article] [PubMed] [Google Scholar]