

Abstract
The aim of this study is to characterize the changes of CD4+CD25highforkhead box P3 (FoxP3+) regulatory T cells (Treg), interleukin (IL)-17 secreting T helper type 17 (Th17) cell frequencies and the balance of these two subsets in a cohort of chronic human immunodeficiency virus type 1 (HIV-1)-infected patients in China. A total of 115 untreated chronic HIV-infected individuals and 32 healthy donors were recruited in this study. Peripheral blood mononuclear cells were isolated from ethylenediamine tetracetic acid (EDTA) anti-coagulated fresh whole blood and stained to characterize the frequencies of Treg and Th17. Of a total 115 patients, 42 individuals including 10 elite controllers were followed-up for more than 1 year, and changes of Treg and Th17 frequencies were analysed over time. The continuous loss of Th17 cells was accompanied by a concomitant rise in the frequency of Treg cells, resulting in a loss of Th17/Treg balance during the progressive HIV infection. Meanwhile, the Treg levels, Th17 levels and Th17/Treg ratios of the elite controller group were comparable to those of the HIV-1 negative controls in the follow-up study. Additionally, we demonstrated that loss of balance between Th17 and Treg is associated with an earlier CD4 T cell decline during the course of HIV infection. Our results indicate that a loss of immune-balance of Th17 to Treg during HIV-1 disease progression and the persistence of such an immune-balance in the elite controllers may have a critical role in HIV-1 infection and further shed new light into understanding the pathogenesis of HIV-1.
Keywords: pathogenesis, HIV, Th17 cells, Treg cells
Introduction
Human immunodeficiency virus (HIV)-1 infection is characterized by progressive impairment and massive dysregulation of the immune system in humans, particularly loss of CD4+ helper T cells [1,2], leading ultimately to the development of acquired immunodeficiency syndrome (AIDS).
CD4+CD25highforkhead box P3 (FoxP3+) regulatory T cells (Treg) and T helper type 17 (Th17) cells have been described as two distinct subsets from Th1 and Th2 cells. Treg cells have a diverse T cell receptor (TCR) repertoire and can exert anti-inflammatory functions [3,4], control self-reactive T cells, including Th1, Th2 and possibly Th17 cells [5,6]. Th17 cells can promote inflammation through stimulating inflammatory cytokine release, chemokine expression and recruitment of neutrophils [7,8] and be functionally involved in the defence against extracellular bacteria as well as a variety of autoimmune inflammatory conditions. Treg and Th17 cells are therefore two distinct novel CD4+ T cell subsets that may evolve to induce or regulate tissue inflammation. Th17/Treg is analogous to the dichotomy of Th1/Th2 T cell subsets because of their opposite effects and their reciprocal developmental pathways of generation [9–11].
In this study, a relatively large and unique population of chronic HIV-1-infected patients that had a similar background was used to investigate the frequencies of Th17 and Treg cells, to explore the relationship between the two subsets, to evaluate the longitudinal changes of Th17/Treg imbalances during the course of HIV infection and finally to determine whether these changes among Th17, Treg and their balance impacted HIV disease progression.
Materials and methods
Study participants
We recruited 115 HIV-infected patients and 32 healthy individuals for this study. Healthy subjects were adults who were HIV-1-negative. The HIV-1-infected individuals were treatment-naive, chronically infected former plasma donors (FPD) who were infected with HIV-1 between 1992 and 1995 from local clinics in Fuyang City (Anhui Province, China) through unregulated commercial plasma collection sites, where contaminated blood collection equipment was used or pooled erythrocyte concentrations were reinfused into donors; this practice was discontinued at the end of 1995 [12]. Over 10 years, the majority of FPDs advanced to AIDs or died while a small fraction became elite controllers, of which the viral loads maintained <50 copies/ml without anti-retroviral therapy. All patients were infected by HIV-1 B′ strain; HIV-1 seropositivity was determined by anti-HIV-antibody enzyme-linked immunosorbent assay (ELISA) (anti-HIV ELISA kit; Wantai, Beijing, China) and confirmed by Western blot test (anti-HIV-1 Western blot kit; Aoya, Hangzhou, China). The characteristics of these study subjects are described in Table 1. Of 115 patients, 31 individuals in various disease stages were invited for further analysis (Table 2). All subjects provided written consent, and the protocol was approved by the National Institutes of Health, the Institutional Review Board of the China Center for AIDS/Sexually Transmitted Disease (STD) Control and Prevention, and the Institutional Review Board of the Anhui Provincial Center for Disease Control and Prevention.
Table 1.
Characteristics of human immunodeficiency virus (HIV)-infected former plasma donors (FPD) and HIV-negative healthy controls of the study.
| Characteristics | HIV-infected FPD | Healthy controllers |
|---|---|---|
| Case | 115 | 32 |
| Gender (male/female) | 69/46 | 18/14 |
| Age (years) | 40 ± 7 | 38 ± 8 |
| Years of infection | 19·3 ± 1·3 | – |
| CD4+ T cell counts (cells/µl) | 502·9 ± 206·9 | 728·5 ± 179·1 |
| CD8+ T cell counts (cells/µl) | 1194·2 ± 685·1 | 552·5 ± 201·7 |
| CD4+ : CD8+ T cell ratio | 0·5 ± 0·2 | 1·4 ± 0·4 |
| Viral load (log10 HIV RNA copies/ml) | 4·1 ± 1·3 | – |
Values are expressed as mean ± standard deviation or number.
Table 2.
Characteristics of 31 human immunodeficiency virus (HIV)-infected patients who stratified into three groups.
| Group and patient no. | Gender | Age (years) | Years of infection | CD4+ T cell count (cells/µl) 2009 | CD4+ T cell count (cells/µl) 2010 | Viral load (HIV RNA copies/ml) 2009 | Viral load (HIV RNA copies/ml) 2010 |
|---|---|---|---|---|---|---|---|
| Non-controllers CD4 < 350 (n = 7) | |||||||
| 1 | Female | 47 | 20 | 385 | 186 | 22 100 | 217 000 |
| 2 | Female | 41 | 19 | 470 | 263 | 22 000 | 42 200 |
| 3 | Male | 36 | 17 | 614 | 235 | 413 000 | 389 000 |
| 4 | Male | 41 | 19 | 503 | 292 | 286 000 | 91 000 |
| 5 | Female | 51 | 17 | 553 | 293 | 17 500 | 82 200 |
| 6 | Male | 35 | 18 | 394 | 226 | 58 100 | 68 400 |
| 7 | Male | 47 | 19 | 473 | 312 | 60 800 | 72 400 |
| Non-controllers CD4 > 350 (n = 14) | |||||||
| 8 | Female | 45 | 18 | 510 | 376 | 8 100 | 20 500 |
| 9 | Male | 47 | 18 | 965 | 767 | 23 700 | 68 900 |
| 10 | Female | 41 | 19 | 665 | 432 | 2 660 | 3 130 |
| 11 | Female | 46 | 19 | 632 | 461 | 6 720 | 29 000 |
| 12 | Male | 49 | 19 | 657 | 383 | 11 400 | 11 100 |
| 13 | Male | 64 | 17 | 702 | 431 | 36 700 | 15 600 |
| 14 | Male | 40 | 20 | 886 | 756 | 15 800 | 20 400 |
| 15 | Male | 56 | 20 | 776 | 641 | 221 000 | 1 310 000 |
| 16 | Male | 50 | 20 | 654 | 459 | 4 450 | 807 |
| 17 | Female | 56 | 20 | 837 | 670 | 47 000 | 14 200 |
| 18 | Male | 44 | 19 | 595 | 456 | 120 000 | 160 000 |
| 19 | Male | 56 | 20 | 809 | 426 | 276 000 | 388 000 |
| 20 | Male | 42 | 18 | 441 | 382 | 32 000 | 37 300 |
| 21 | Female | 43 | 18 | 636 | 471 | 5 090 | 4 430 |
| Elite controllers (n = 10) | |||||||
| 22 | Male | 47 | 17 | 626 | 634 | <LDL | <LDL |
| 23 | Female | 42 | 19 | 368 | 484 | <LDL | <LDL |
| 24 | Female | 45 | 18 | 630 | 553 | <LDL | <LDL |
| 25 | Female | 45 | 18 | 800 | 689 | <LDL | <LDL |
| 26 | Male | 38 | 19 | 709 | 543 | <LDL | <LDL |
| 27 | Female | 46 | 17 | 883 | 874 | <LDL | <LDL |
| 28 | Female | 42 | 18 | 675 | 695 | <LDL | <LDL |
| 29 | Female | 62 | 17 | 767 | 434 | <LDL | <LDL |
| 30 | Female | 50 | 18 | 810 | 712 | <LDL | <LDL |
| 31 | Female | 48 | 18 | 561 | 511 | <LDL | <LDL |
LDL: lower detection limit = 50 copies/ml.
Peripheral blood mononuclear cells (PBMC) sample processing
PBMCs were isolated from ethylenediamine tetraacetic acid (EDTA) anti-coagulated fresh whole blood by Ficoll-Hypaque (Pharmacia, Stockholm, Sweden) density-gradient centrifugation within 6 h of collection. PBMCs were counted and checked for viability and then were resuspended in R10 medium (RPMI-1640 medium supplemented with 10% heat-inactivated fetal bovine serum, 2 mmol l-glutamine/l, 100 U/ml penicillin, 100 µg/ml streptomycin) (all from Invitrogen, Carlsbad, CA, USA) in 1 million cells/ml prior to stimulation or Treg staining.
In vitro stimulation and intracellular cytokine assays
For analysis of Th17 cells, 1 million fresh PBMCs were cultured at 37°C under a 5% CO2 environment for 6 h in 1 ml R10 in the presence of 5 µg/ml of Brefeldin A with 50 ng/ml of phorbol myristate acetate (PMA) and 200 ng/ml of ionomycin (all from Sigma, St Louis, MO, USA) before performing intracellular cytokine staining. Also, cells incubated in complete media with Brefeldin A served as negative control. Flow cytometry was performed for surface marker expression using antibodies against the following human proteins with fluorescent labels: polyacrylamide beads (PB)-conjugated-live/dead fixable dead cell stain (Invitrogen, Eugene, OR, USA), allophycocyanin (APC)-conjugated anti-CD3, phycoerythrin (PE)-conjugated anti-CD4 and peridinin-chlorophyll protein (PerCP)-conjugated anti-CD8 (all from Becton Dickinson, Franklin Lakes, NJ, USA). All cells were stained for cytokines after surface staining for phenotypic markers and fixation/permeabilization (Caltag Laboratories, Buckingham, UK). The monoclonal antibody used for intracellular stains was fluorescein isothiocyanate (FITC)-conjugated anti-IL-17A or isotype control (eBioscience, San Diego, CA, USA). Finally, cells were washed in phosphate-buffered saline (PBS) and resuspended in PBS containing 2% formaldehyde (Sigma). Approximately 2·0 × 105 events were collected in the lymphocyte gate on the Becton Dickinson Aria and analysed with FlowJo software (TreeStar, Ashland, OR, USA).
Phenotyping and frequency of regulatory T cells
For flow cytometric characterization of Tregs, the isolated fresh PBMCs were stained with a combination of the following conjugated anti-human monoclonal antibodies: phycoerythrin–Texas red (ECD)-conjugated anti-CD3 (Beckman Coulter, Fullerton, CA, USA), PE-conjugated anti-CD4, APC–cyanin7 (Cy7)-conjugated anti-CD8 and APC-conjugated anti-CD25 (Becton Dickinson). This was followed by intracellular staining for FITC-conjugated anti-FoxP3 or isotype control (eBioscience) using the FoxP3 Staining Buffer Set (eBioscience) following the protocol as recommended by the manufacturer. Approximately 2·0 × 105 events were collected in the lymphocyte gate on the Becton Dickinson Aria and analysed with FlowJo software.
CD4+ T cell count and viral load
CD3+, CD4+ and CD8+ T cell counts were measured with a fluorescence activated cell sorter (FACS)Calibur TruCount tube (Becton Dickinson) with multi-colour antibody (FITC–CD3antibody, PE–CD4 antibody, PerCP–CD45antibody and APC–CD8 antibody) (Becton Dickinson). Results were analysed by MultiSETTM software (BD Biosciences). Plasma viral load was analysed by Amplicor ultrasensitive assay (Hoffman-La Roche, Nutley, NJ, USA), according to the manufacturer's instructions, which had a detection limit of 50 copies RNA/ml.
Statistical analysis
Group comparisons were analysed by Student's t-tests when normality test passed. Mann–Whitney U-tests were used for non-normality data. Spearman's rank correlations were used to assess the relationships between variables. Repeated-measures and multivariate analysis of variance (anova) process of the general linear model were used to test the impact of Th17, Treg and Th17/Treg on CD4 T cell count. A viral load below the limit of detection (50 copies RNA/ml) was assigned a value of 49 for statistical analysis. Data were analysed using spss 15·0 (SPSS Inc., San Francisco, CA, USA); P < 0·05 was considered significant.
Results
Decreased Th17 and increased Treg frequencies in chronic HIV infection
Th17 cells in PBMCs of 115 HIV-1 infected patients and 32 healthy donors were identified by intracellular cytokine detection of the Th17-defining cytokine, IL-17A, in CD4+ T cells (Fig. 1a). We found reduction of Th17 cell frequencies in HIV-positive individuals (0·61 ± 0·34%) compared with the HIV-uninfected controls (0·94 ± 0·45%, P < 0·001) (Fig. 1c). Th17 cell frequencies were related positively to CD4+ T cell counts (r = 0·279, P = 0·003) and correlated inversely to viral load (r = −0·185, P = 0·048).
Fig. 1.
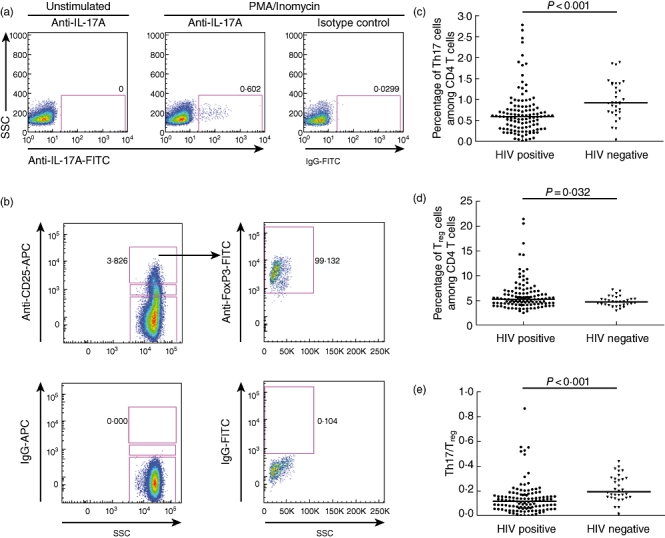
Comparison of T helper type 17 (Th17) and regulatory T cells (Treg) in the peripheral blood of human immunodeficiency virus (HIV)-infected patients and healthy donors. Gating of Th17 (a) and Treg cells (b) in representative subjects are shown. Comparison of Th17 levels (c), Treg levels (d) and the balance of Th17/Treg (e) between HIV-infected patients (n = 115) and healthy controls (n = 32). Mann–Whitney U-tests were used for group comparisons.
We next investigated the changes of CD4+CD25highFoxP3+ Tregs (as a proportion of CD4+ T cells) (Fig. 1b) in the cohort. Treg frequencies were increased significantly in the 115 HIV-infected subjects compared to healthy controls (5·15 ± 3·10 versus 4·61 ± 1·01, P = 0·032) (Fig. 1d). They exhibited a strong negative correlation with CD4+ T cell counts (r = −0·491, P < 0·001) and were associated positively with viral load (r = 0·263, P = 0·005).
Loss of balance between Th17 and Treg during HIV infection
Given that Th17 and Treg perform substantially different roles during the course of an immune response, we evaluated the relationship between Th17 and Treg during HIV infection. A significant decrease in the ratio of circulating Th17 and Treg cells of 115 HIV-positive individuals (0·12 ± 0·07) was observed when compared to healthy controls (0·19 ± 0·10, P < 0·001) (Fig. 1e). In addition, the Th17/Treg ratio was related positively to CD4+ T cell counts (r = 0·488, P < 0·001) and inversely to viral load (r = −0·289, P = 0·002).
Changes in Th17 and Tregs during HIV infection
To determine the changes of Th17, Tregs and Th17/Tregs in HIV disease progression, we performed longitudinal analyses on 42 HIV-1-infected individuals from the overall 115 patients who were followed-up for 17·57 ± 2·06 months, from the first visit time-point (April 2009–June 2009) to the second visit time-point (October 2010–November 2010). We noted that the Th17 frequency declined from 0·67 ± 0·39% CD4 cells to 0·60 ± 0·24% CD4 cells (P = 0·078) (Fig. 2a) and the Treg frequency increased significantly from 4·77 ± 1·24% CD4 cells to 5·89 ± 2·42% CD4 cells (P = 0·010) (Fig. 2b), which led to a decreased Th17/Treg ratio during the follow-up (0·14 ± 0·08 versus 0·11 ± 0·06, P = 0·009) (Fig. 2c).
Fig. 2.
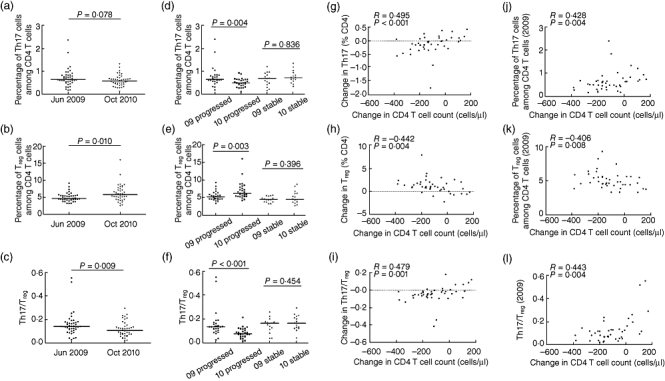
Changes in T helper type 17 (Th17) levels, regulatory T cell (Treg) levels and Th17/Treg levels during human immunodeficiency virus (HIV) disease progression. Comparison of Th17 (a), Treg (b) and Th17/Treg (c) levels in 42 HIV-1 infected patients during the follow-up. Changes of Th17 (d), Treg (e) and Th17/Treg (f) levels in the groups with progressed and stable disease were evaluated; the correlation between changes of CD4+ T cell counts and the levels of Th17 (g), Treg (h), Th17/Treg (i) or the initial Th17 (j), Treg (k) and Th17/Treg (l) in 2009 are shown (patients labelled ‘progressed’ are those with a decline in absolute CD4 cell count of over 50 cells/µl during the study period; those labelled ‘stable’ did not experience such a decline). Student's t-tests were used in Th17/Treg comparison in the groups with progressed disease. Other group comparisons were analysed by Mann-Whitney U-test. Spearman's rank correlation test was used to assess the relationships between variables.
We next divided the 42 patients into two groups: (1) patients who had an progressed disease (absolute CD4 cell count decline >50 cells/µl during the study period, n = 27) and (2) individuals who had stable HIV infection (CD4 cell count decline <50 cells/µl, n = 15). Loss of Th17 (0·66 ± 0·44% versus 0·52 ± 0·18%, P = 0·004) (Fig. 2d) and generation of Tregs in CD4+T cells (5·15 ± 1·34% versus 6·16 ± 2·46%, P = 0·003) (Fig. 2e) were observed in patients with progressed disease during follow-up, resulting in an even lower Th17/Treg ratio (0·14 ± 0·11 versus 0·08 ± 0·04, P < 0·001) (Fig. 2f). By contrast, those who had a stable CD4+T cell count, changes in Th17 and Treg levels did not show significant differences, which led to a steady Th17/Treg ratio during the study period (P = 0·396; P = 0·836; P = 0·454). Notably, a strong positive correlation between changes in CD4+ T cell counts and Th17 cell frequencies as well as an obvious negative correlation between changes in CD4+ T cell counts and Treg cell frequencies was observed during the follow-up period. Thus, the Th17/Treg ratio changes were related positively to changes in the CD4+ T cell counts (r = 0·495, r = −0·442, r = 0·479; P < 0·001, P = 0·004, P = 0·001) (Fig. 2g–i). Additionally, the initial Th17, Treg and Th17/Treg in 2009 could predict the subsequent change in CD4 T cell count, respectively (r = 0·428, r = −0·406, r = 0·443; P = 0·004, P = 0·008, P = 0·004) (Fig. 2j–l).
We further selected 31 participants from the 42 patients who were followed-up during the study period on the basis of CD4+ T cell counts and viral loads. We then stratified patients into three groups: (1) non-controllers with a CD4+ T cell count <350 cells/µl (n = 7), (2) non-controllers with a CD4+ T cell count >350 cells/µl (n = 14) and (3) elite controllers (n = 10). Non-controllers were defined as those with a viral load >10 000 copies/ml and a CD4 decline >50 cells per year, as described previously [13]. Elite controllers were asymptomatic patients who maintained viral loads of <50 copies/ml without anti-retroviral therapy. Similar outcomes were observed at both time-points. Non-controllers had lower CD4+ T cell counts and showed decreased Th17 frequencies when compared to elite controllers and healthy individuals (in 2009: 0·64 ± 0·22 versus 0·84 ± 0·36 versus 0·94 ± 0·45; P = 0·033, P = 0·019; in 2010: median 0·53 ± 0·18 versus 0·77 ± 0·12 versus 0·94 ± 0·45; P = 0·013, P = 0·005), while increased Treg frequencies in CD4+ T cells were detected when compared to non-controllers with higher CD4 counts, elite controllers and healthy subjects (in 2009: 6·33 ± 1·72 versus 5·36 ± 0·97 versus 4·56 ± 0·65 versus 4·61 ± 1·01; P = 0·043, P = 0·010, P = 0·008; in 2010: median 8·44 ± 3·27 versus 6·19 ± 1·13 versus 5·21 ± 0·70 versus 4·61 ± 1·01; P = 0·003, P < 0·001, P < 0·001). The Th17/Treg ratio was about two to four times lower in non-controllers with progressed disease than in HIV-negative controls (in 2009: 0·12 ± 0·05 versus 0·19 ± 0·10; in 2010: 0·05 ± 0·02 versus 0·19 ± 0·10; P = 0·004, P < 0·001) (Fig. 3a–f).
Fig. 3.
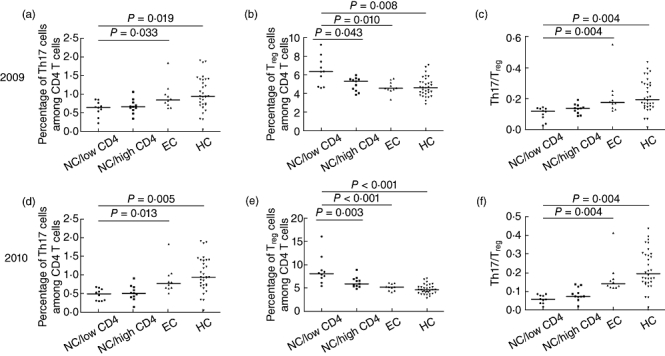
Comparison of T helper type 17 (Th17), regulatory T cells (Treg) and Th17/Treg levels among different patient groups. Comparison of Th17 (a) Treg (b) and Th17/Treg (c) levels among the four groups in 2009 and Th17 (d), Treg (e) and Th17/Treg (f) levels in 2010 were evaluated, respectively (NC/low CD4 = non-controller with CD4 T cell count <350 cells/µl; NC/high CD4 = non-controller with CD4 T cell count >350 cells/µl; EC = elite controller; HC = healthy control). Mann–Whitney U-tests were used for group comparisons.
Effects of Th17, Treg and Th17/Treg on CD4+ T cell counts in HIV disease progression
We further explored the roles of Th17, Treg and the ratio of Th17/Treg during HIV disease progression. We obtained longitudinal CD4+ T cell count data from five time-points (April 2008, November 2008, April 2009, November 2009 and October 2010) from 36 patients. We found that CD4+ T cell counts in the groups (groups were divided according to the quartiles of the Th17, Treg and Th17/Treg measured at their first visit time-point April 2009) with the highest Th17, lowest Treg and highest Th17/Treg remained stable during the follow-up period; the other groups all had progressive loss of CD4 T cells (Fig. 4a–c). In addition, when compared to the first time-point of CD4 T cell count (April 2008), the decrease of CD4 T cells appeared earlier in subgroup B of Th17/Treg than the subgroups in Treg and Th17 (Table 3).
Fig. 4.
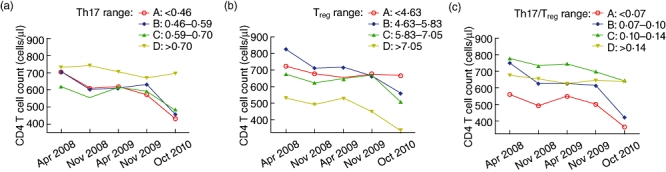
Relationship between T helper type 17 (Th17), regulatory T cell (Treg), Th17/Treg and CD4+T cell counts during human immunodeficiency virus (HIV) disease progression. The trend of CD4+ T cell counts in different groups of Th17, Treg and Th17/Treg were shown throughout the follow-up period.
Table 3.
Effects of T helper type 17 (Th17), regulatory T cells (Treg), Th17/Treg on CD4+ T cell counts in human immunodeficiency virus (HIV) disease progression.
| CD4 T cell count at different time |
||||||||
|---|---|---|---|---|---|---|---|---|
| Group | n | April 2008 | November 2008 | April 2009 | November 2009 | October 2010 | P-value* | |
| Th17 | A | 9 | 704·5 ± 258·5 | 609·4 ± 195·1 | 618·1 ± 153·0 | 571·0 ± 211·9** | 434·0 ± 151·8** | <0·05 |
| B | 9 | 703·2 ± 148·1 | 600·7 ± 118·0 | 610·5 ± 132·2** | 629·5 ± 129·2 | 457·5 ± 131·4** | <0·05 | |
| C | 9 | 618·9 ± 162·3 | 553·7 ± 165·5 | 615·1 ± 153·4 | 590·8 ± 182·8 | 482·7 ± 186·5** | <0·05 | |
| D | 9 | 729·4 ± 203·9 | 742·1 ± 225·6 | 703·4 ± 242·9 | 668·2 ± 258·0 | 692·9 ± 217·3 | 0·28 | |
| Treg | A | 9 | 724·1 ± 198·1 | 679·4 ± 179·0 | 652·8 ± 206·8 | 678·3 ± 243·4 | 667·6 ± 222·6 | 0·35 |
| B | 9 | 826·6 ± 173·0 | 713·1 ± 229·4 | 719·6 ± 151·7** | 664·1 ± 165·6** | 559·2 ± 137·7** | <0·05 | |
| C | 9 | 675·7 ± 131·2 | 622·4 ± 166·7 | 647·6 ± 169·6 | 671·7 ± 151·2 | 507·3 ± 168·0** | <0·05 | |
| D | 9 | 529·6 ± 163·3 | 490·9 ± 87·2 | 527·2 ± 117·9 | 445·3 ± 122·8 | 332·9 ± 87·8** | <0·05 | |
| Th17/Treg | A | 9 | 558·4 ± 179·7 | 492·1 ± 72·6 | 550·6 ± 126·5 | 501·7 ± 168·7 | 364·3 ± 97·6** | <0·05 |
| B | 9 | 747·9 ± 202·1 | 626·9 ± 195·9** | 627·7 ± 113·1** | 615·2 ± 163·0** | 423·7 ± 119·6** | <0·05 | |
| C | 9 | 775·4 ± 141·9 | 733·4 ± 195·9 | 743·1 ± 179·7 | 697·8 ± 143·2 | 644·1 ± 146·5** | <0·05 | |
| D | 9 | 674·2 ± 198·7 | 653·4 ± 190·9 | 625·7 ± 218·5 | 644·6 ± 263·0 | 635·1 ± 234·5 | 0·40 | |
P-value: trend analyses using repeated-measures analysis of variance for the same subgroup in five time-points.
P < 0·05, when compared to the first time-point (April 2008) in the same subgroup.
Discussion
In the present study, we report the longitudinal data of Th17 and Treg frequencies during the course of progressive HIV disease in the peripheral blood of a unique population – an FPD cohort with chronic, untreated HIV-1 clade B′ infection. Unlike the other studies, the outbreak of HIV-1 infection in this cohort occurred within a narrow time-period and these unusual HIV-1-infected FPDs were considered to be infected by the same or a related HIV-1 strain through the same exposure route [14,15]. They represent a unique population to study HIV/AIDS disease progression and may provide further insight into HIV pathogenesis. We demonstrated that there is a progressive decline of Th17 and an increase in Treg cells that can result in a loss of Th17 to Treg balance which is related to more advanced disease during the chronic phase of HIV infection.
Th17 cells are functionally distinct from either Th1 or Th2 cells and have been associated with chronic inflammatory diseases and autoimmune disorders [16]. A wealth of data have been proposed to interpret the mechanism of Th17 cells in HIV disease progression. Th17 could enhance host defences against microbial agents and can play a critical role in maintaining inflammatory states, particularly in gastrointestinal (GI) enterocyte homeostasis in progressive HIV disease [13,17]. Loss of Th17 cells in HIV infection might result in bacterial translocation from the gut to the systemic circulation and could lead to immune activation that attends HIV infection. We observed that Th17 frequencies were profoundly lost and reduced persistently over time in the peripheral blood of HIV-infected individuals. Changes in the Th17 cell frequencies and CD4+ T cell counts had a strong positive correlation with each other during the progression of HIV-1 infection. Despite accumulating data of selective depletion of Th17 cells in HIV infection, no evidence showed that these cells are infected preferentially; however, bystander cell death may have contributed to their loss [18]. Our data are consistent with many recent studies which also demonstrated a preferential depletion of Th17 cells from both gut and blood in HIV and pathogenic simian immunodeficiency virus (SIV) infections [18,19].
A growing body of evidence has shown that Treg cells can interfere with protective immune responses and control T cell self-reactivity. The effect of Tregs in HIV infection still remains unclear. Several research groups have reported that Tregs may account for HIV pathogenesis by altering the function of the HIV-specific T cell response, thus hastening viral replication [20,21]. Other studies have shown that Tregs might play a beneficial role by limiting immune system activation, which is also one of the main mechanisms in T cell dysfunction and depletion [22,23]. Our data demonstrated that, contrary to loss of Th17 cells, Treg cell frequencies were markedly higher in HIV-1-infected patients and were increased at the later time-point following HIV infection. In addition, Treg cell frequencies were related inversely to CD4+ T cell counts and had a positive correlation with viral load. Furthermore, the initial Treg cells could predict changes of CD4 T cell count as well as Th17 cells, making them two important factors in understanding HIV disease progression.
The observed relationship between Th17 and Tregs prompts reconsideration of the role of these two cell populations during chronic HIV-1 infections. A progressive loss of Th17 and the augment of Treg cells in HIV-1-infected individuals, especially those with advanced disease, demonstrated that a Th17/Treg functional imbalance exists and the ratio of Th17/Treg gradually declines throughout disease progression. This conclusion is supported by a recent study which demonstrated that the IDO1 (indoleamine 2, 3-dioxygenase 1)-dependent tryptophan catabolism may play a critical role in controlling the Th17/Treg balance [13]. Additionally, a Th17/Treg imbalance was not observed in the elite controller group. These studies all underscore the point that the Th17/Treg ratio plays a fairly important role in the pathogenesis of chronic HIV infections. This Th17/Treg functional imbalance in our cohort refines the ageing Th1/Th2 paradigm and provides a new target for our understanding of HIV pathogenesis and future considerations about treatment of chronic HIV infections and HIV vaccine development. It may also be possible to manipulate the functions of Th17 and Treg cells to cure immunodeficiency. Also, understanding the mechanisms by which elite controllers control viraemia may help us to determine the factors that affect the rate of disease progression in HIV-1-infected individuals [24,25].
We also provide a novel standpoint of the roles of Th17, Treg and Th17/Treg in HIV-1 disease progression by demonstrating that CD4+ T cell counts decline much more slowly in HIV-1-infected individuals with either higher Th17 frequencies or lower Treg cell frequencies or a well-maintained Th17/Treg balance. Interestingly, loss of balance between Th17 and Treg is associated with an earlier CD4 T cell decline during the course of HIV infection. This outcome highlighted the impact of the balance between Th17 and Treg populations in HIV pathogenesis.
The findings in this study are important for several reasons. First, this Chinese cohort allowed observation of a group of people infected with a relatively homogeneous viral strain at approximately the same time, thus providing an important new dimension to the study of Treg and Th17 cells. Secondly, we demonstrated that a balanced representation of both Tregs and Th17 cells might play a unique and possibly crucial role in chronic HIV-1 infections. Also, the data reported herein give prominence to our understanding of the pathogenesis of HIV-1: a decrease of Th17 levels and an increase of Treg levels in HIV-1 chronic infections, with no differences observed in elite controllers. Finally, this study prompts novel considerations for future thoughts on HIV vaccine development. Instead of focusing solely upon the elaboration of a robust anti-viral adaptive systemic immune response, it may also be beneficial to control Treg and Th17 diversification as well as the Th17/Treg balance, thereby controlling viral replication and spread. Future efforts, however, are still needed to identify the precise effects and mechanisms of the Th17/Treg imbalance at different phases of HIV-1 infection.
Acknowledgments
This project was supported by grants from the National Mega Projects on Key Infectious Disease Control (2008ZX10001-010) of China Ministry of Science and Technology, the International Cooperative Grant of China Ministry of Science and Technology (2009DFB30420), SKILD Key Project (2008SKLID101), National Basic Research Program of China (973 Program, 2006CB504200), National Nature Science Foundation (30800985) and AIDS and viral hepatitis control project in Chaoyang District of Beijing (2009ZX10004-903). We gratefully acknowledge Esther T. Han (The University of North Texas Health Science Center) for helpful advice on writing the paper.
Disclosure
None.
References
- 1.Hellerstein M, Hanley MB, Cesar D, et al. Directly measured kinetics of circulating T lymphocytes in normal and HIV-1-infected humans. Nat Med. 1999;5:83–9. doi: 10.1038/4772. [DOI] [PubMed] [Google Scholar]
- 2.Giorgi JV, Hultin LE, McKeating JA, et al. Shorter survival in advanced human immunodeficiency virus type 1 infection is more closely associated with T lymphocyte activation than with plasma virus burden or virus chemokine coreceptor usage. J Infect Dis. 1999;179:859–70. doi: 10.1086/314660. [DOI] [PubMed] [Google Scholar]
- 3.Mills KH. Regulatory T cells: friend or foe in immunity to infection? Nat Rev Immunol. 2004;4:841–55. doi: 10.1038/nri1485. [DOI] [PubMed] [Google Scholar]
- 4.Roncarolo MG, Battaglia M. Regulatory T-cell immunotherapy for tolerance to self antigens and alloantigens in humans. Nat Rev Immunol. 2007;7:585–98. doi: 10.1038/nri2138. [DOI] [PubMed] [Google Scholar]
- 5.Sakaguchi S, Powrie F. Emerging challenges in regulatory T cell function and biology. Science. 2007;317:627–9. doi: 10.1126/science.1142331. [DOI] [PubMed] [Google Scholar]
- 6.Chen X, Vodanovic-Jankovic S, Johnson B, Keller M, Komorowski R, Drobyski WR. Absence of regulatory T-cell control of TH1 and TH17 cells is responsible for the autoimmune-mediated pathology in chronic graft-versus-host disease. Blood. 2007;110:3804–13. doi: 10.1182/blood-2007-05-091074. [DOI] [PMC free article] [PubMed] [Google Scholar]
- 7.Weaver CT, Hatton RD, Mangan PR, Harrington LE. IL-17 family cytokines and the expanding diversity of effector T cell lineages. Annu Rev Immunol. 2007;25:821–52. doi: 10.1146/annurev.immunol.25.022106.141557. [DOI] [PubMed] [Google Scholar]
- 8.Bettelli E, Korn T, Kuchroo VK. Th17: the third member of the effector T cell trilogy. Curr Opin Immunol. 2007;19:652–7. doi: 10.1016/j.coi.2007.07.020. [DOI] [PMC free article] [PubMed] [Google Scholar]
- 9.Kanwar B, Favre D, McCune JM. Th17 and regulatory T cells: implications for AIDS pathogenesis. Curr Opin HIV AIDS. 2010;5:151–7. doi: 10.1097/COH.0b013e328335c0c1. [DOI] [PMC free article] [PubMed] [Google Scholar]
- 10.Homey B. [After TH1/TH2 now comes Treg/TH17: significance of T helper cells in immune response organization] Hautarzt. 2006;57:730–2. doi: 10.1007/s00105-006-1199-3. [DOI] [PubMed] [Google Scholar]
- 11.Bettelli E, Carrier Y, Gao W, et al. Reciprocal developmental pathways for the generation of pathogenic effector TH17 and regulatory T cells. Nature. 2006;441:235–8. doi: 10.1038/nature04753. [DOI] [PubMed] [Google Scholar]
- 12.Kaufman J, Jing J. China and AIDS – the time to act is now. Science. 2002;296:2339–40. doi: 10.1126/science.1074479. [DOI] [PubMed] [Google Scholar]
- 13.Favre D, Mold J, Hunt PW, et al. Tryptophan catabolism by indoleamine 2,3-dioxygenase 1 alters the balance of TH17 to regulatory T cells in HIV disease. Sci Transl Med. 2010;2:32ra6. doi: 10.1126/scitranslmed.3000632. [DOI] [PMC free article] [PubMed] [Google Scholar]
- 14.Su B, Liu L, Wang F, et al. HIV-1 subtype B' dictates the AIDS epidemic among paid blood donors in the Henan and Hubei provinces of China. AIDS. 2003;17:2515–20. doi: 10.1097/00002030-200311210-00015. [DOI] [PubMed] [Google Scholar]
- 15.Zhang L, Chen Z, Cao Y, et al. Molecular characterization of human immunodeficiency virus type 1 and hepatitis C virus in paid blood donors and injection drug users in china. J Virol. 2004;78:13591–9. doi: 10.1128/JVI.78.24.13591-13599.2004. [DOI] [PMC free article] [PubMed] [Google Scholar]
- 16.Furuzawa-Carballeda J, Vargas-Rojas MI, Cabral AR. Autoimmune inflammation from the Th17 perspective. Autoimmun Rev. 2007;6:169–75. doi: 10.1016/j.autrev.2006.10.002. [DOI] [PubMed] [Google Scholar]
- 17.Liang SC, Tan XY, Luxenberg DP, et al. Interleukin (IL)-22 and IL-17 are coexpressed by Th17 cells and cooperatively enhance expression of antimicrobial peptides. J Exp Med. 2006;203:2271–9. doi: 10.1084/jem.20061308. [DOI] [PMC free article] [PubMed] [Google Scholar]
- 18.Brenchley JM, Paiardini M, Knox KS, et al. Differential Th17 CD4 T-cell depletion in pathogenic and nonpathogenic lentiviral infections. Blood. 2008;112:2826–35. doi: 10.1182/blood-2008-05-159301. [DOI] [PMC free article] [PubMed] [Google Scholar]
- 19.Favre D, Lederer S, Kanwar B, et al. Critical loss of the balance between Th17 and T regulatory cell populations in pathogenic SIV infection. PLoS Pathog. 2009;5:e1000295. doi: 10.1371/journal.ppat.1000295. [DOI] [PMC free article] [PubMed] [Google Scholar]
- 20.Tsunemi S, Iwasaki T, Imado T, et al. Relationship of CD4+CD25+ regulatory T cells to immune status in HIV-infected patients. AIDS. 2005;19:879–86. doi: 10.1097/01.aids.0000171401.23243.56. [DOI] [PubMed] [Google Scholar]
- 21.Weiss L, Donkova-Petrini V, Caccavelli L, Balbo M, Carbonneil C, Levy Y. Human immunodeficiency virus-driven expansion of CD4+CD25+ regulatory T cells, which suppress HIV-specific CD4 T-cell responses in HIV-infected patients. Blood. 2004;104:3249–56. doi: 10.1182/blood-2004-01-0365. [DOI] [PubMed] [Google Scholar]
- 22.Eggena MP, Barugahare B, Jones N, et al. Depletion of regulatory T cells in HIV infection is associated with immune activation. J Immunol. 2005;174:4407–14. doi: 10.4049/jimmunol.174.7.4407. [DOI] [PubMed] [Google Scholar]
- 23.Oswald-Richter K, Grill SM, Shariat N, et al. HIV infection of naturally occurring and genetically reprogrammed human regulatory T-cells. PLoS Biol. 2004;2:E198. doi: 10.1371/journal.pbio.0020198. [DOI] [PMC free article] [PubMed] [Google Scholar]
- 24.Deeks SG, Walker BD. Human immunodeficiency virus controllers: mechanisms of durable virus control in the absence of antiretroviral therapy. Immunity. 2007;27:406–16. doi: 10.1016/j.immuni.2007.08.010. [DOI] [PubMed] [Google Scholar]
- 25.Migueles SA, Sabbaghian MS, Shupert WL, et al. HLA B*5701 is highly associated with restriction of virus replication in a subgroup of HIV-infected long term nonprogressors. Proc Natl Acad Sci USA. 2000;97:2709–14. doi: 10.1073/pnas.050567397. [DOI] [PMC free article] [PubMed] [Google Scholar]