Abstract
In 2007, we published the results of a genome-wide screen for ORFs that affect the frequency of Rad52 foci in yeast. That paper was published within the constraints of conventional online publishing tools, and it provided only a glimpse into the actual screen data. New tools in the JCB DataViewer now show how these data can—and should—be shared.
Complete screen data
https://doi.org/10.1083/jcb.201108095.dv
The Rad52 protein has pivotal functions in double strand break repair and homologous recombination. The activity of Rad52 is often monitored by the subnuclear foci that it forms spontaneously in S phase or after DNA damage (Lisby et al., 2001). In mammals, the functions of yeast Rad52 may be divided between human RAD52 and the tumor suppressor BRCA2 (Feng et al., 2011). The full host of molecular players that govern Rad52 focus formation and maintenance was not well known when we initiated our screen. Using a high-content, image-based assay, we assessed the proportion of cells containing spontaneous Rad52-YFP foci in 4,805 viable Saccharomyces cerevisiae deletion strains (Alvaro et al., 2007). Starting with 96-well arrays of a deletion strain library, we created hybrid diploid strains (homozygous for the deletions) using systematic hybrid loss of heterozygosity (SHyLOH; Alvaro et al., 2006). We then manually and sequentially examined each strain using epifluorescence microscopy for the presence of Rad52-YFP foci. All of our image analysis was performed manually.
As is often the case, our screen was published showing only a couple of representative images and providing data tables to summarize the findings. Tomes of data that could not be included in the published paper were relegated to supplemental Excel tables, typical of genome-wide screens. Also, the raw image data were sequestered in the laboratory on DVDs. With considerable help from JCB and Glencoe Software, we are delighted that the raw data from our Rad52 screen are now freely available online through the JCB DataViewer. A new interface within the JCB DataViewer brings presentation and preservation of high-content, multidimensional image-based screening data to a whole new level. To facilitate the development of this new interface, JCB required a dataset that was not time sensitive, and we were happy to provide our previously published Rad52 data. In the future, this new interface will be used to present high-content screening (HCS) datasets linked to published JCB papers. Indeed, the first publication of this sort appears in this issue of JCB (Rohn et al., 2011).
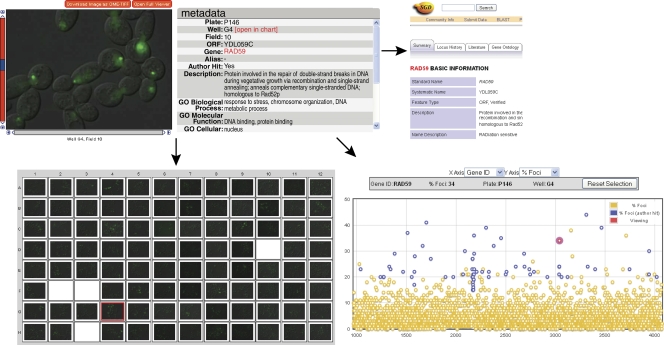
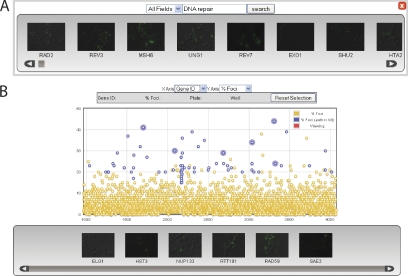
The presentation of our data in the JCB DataViewer clearly shows the many benefits of this new publishing resource for the scientific community. Users now can view the complete collection of 3D image data across the entire screen, not just the two images in our original publication (Alvaro et al., 2007). Additionally, detailed information on image acquisition parameters, locus identities, and more is easily accessible (Fig. 1). Phenotypic scoring results can be visualized in interactive chart formats (Fig. 1), and search (Fig. 2) and database-linking tools (Fig. 1) allow extensive mining of the data for genes and phenotypes of interest. These tools provide an unprecedented view into HCS data in their entirety, as well as a means for authors to share and archive their data. This kind of accessibility to the direct visualization of the entire set of original screening data, on a scale previously only available to the scientists performing the screen, allows users to understand the full context of the image data analyzed in a screen. Furthermore, it is only through full access to the raw images and associated metadata that this information can be of maximum use to the community for large-scale data mining.
Figure 1.
The HCS interface of the JCB DataViewer provides interactive tools for the analysis of complete datasets from image-based screens. The miniviewer (top left) provides information for each gene in the screen through a zoomable and scrollable display of original multidimensional image data. It contains detailed metadata and a gene ontology (GO) summary, a link to a relevant external database (e.g., the Saccharomyces Genome Database [SGD]; top right), and a link to phenotypic scoring data for the complete screen in the chart view (bottom right). Within the chart view, hits designated by the screen authors are shown in blue, and the strain currently on display in the miniviewer is shown in red. The plate view (bottom left) shows the position of the strain of interest (red box) relative to other strains screened.
Figure 2.
The HCS interface of the JCB DataViewer provides search tools for the mining of complete datasets from image-based screens. (A) Users can search screen data by gene name or keywords (e.g., DNA repair). (B) Users can pick candidates for further analysis from the phenotypic scoring information in the chart view.
As in all large-scale screens, the real data are variable; e.g., some strains provide a clear Rad52 focus phenotype, whereas others are more ambiguous. For our particular screen, images were not collected using automated technology but were acquired manually, strain by strain, over a period of months, leading to different levels of fluorescence intensity of Rad52-YFP as a result of, for example, changes in the intensity of our mercury arc lamp. Differences also exist in the number of fields and z stacks captured for each strain. In the absence of automated image collection, images from the primary screen in a few cases were not archived with the others and thus for all intents and purposes have been lost. In addition, our Rad52 screen only assayed nonessential genes, and some mutants are refractory to the SHyLOH methodology. Knowing all of this information allows users to view the data in a realistic manner and further highlights the importance of providing a central repository to archive HCS data.
When published through conventional publication media, many important imaging details are known only to the original screeners. The new HCS interface of the JCB DataViewer shines a light on screening data as metadata become freely accessible, allowing any user to ask novel questions of the dataset. For example, the plate view for images (Fig. 1) allows users to assess whether neighboring colonies played any role in determining the phenotype and to delve deeper into why that might be. For example, are any “hits” a result of contamination from adjacent strains, resulting in clusters of positives? In the context of an automated screen, how were control and experimental samples arrayed across a plate during data collection? Did the controls on a particular plate behave as expected? Because our screen used a novel chromosome-specific loss of the heterozygosity method, users can ask whether mutations on specific chromosomes share features of Rad52 foci levels. The global resolution of the dataset provided through this new interface puts users of the dataset as close to the seat of the original screening scientist as possible, allowing them to ask, “what did the authors really see?”
Presenting HCS data in the JCB DataViewer holds immense potential value to the scientific community. Through this new interface, users can access powerful interactive tools for analyzing scored phenotypes across the entire dataset (Fig. 1). Each gene ID can be charted against the phenotypic parameters scored in the original screen (e.g., the percentage of cells with Rad52 foci) and compared with all other loci (Fig. 1). Users can take our data and create their own list of hits based on their criteria, create a gallery of thumbnails for their selections (Fig. 2), and seamlessly move between their list of hits and the original data in the plate display format (Fig. 1). Users can also compare their candidates with our list (Fig. 2). The ability to visualize these data for comparative analyses creates a whole new perspective. The HCS interface of the JCB DataViewer allows users to look for their favorite gene, compare related genes, and discover new genes they never anticipated were involved in a given process.
In summary, these new features of the JCB DataViewer will allow users to access the primary data from large-scale screens and to look at the full dataset to see what all of the images really look like. The ability to mine these data opens up whole new dimensions in data sharing and transparency. In the future, we anticipate that it will be possible to search many genome-wide screens, such as our Rad52 dataset, to identify commonalities in protein localization, concentration, cell morphology, etc. However, this will only occur if image data are archived and made freely available to the scientific community. We wholeheartedly support the efforts of JCB and hope that groups that use image-based HCS will increasingly make their images available using tools such as the JCB DataViewer.
References
- Alvaro D., Sunjevaric I., Reid R.J., Lisby M., Stillman D.J., Rothstein R. 2006. Systematic hybrid LOH: a new method to reduce false positives and negatives during screening of yeast gene deletion libraries. Yeast. 23:1097–1106. 10.1002/yea.1423 [DOI] [PubMed] [Google Scholar]
- Alvaro D., Lisby M., Rothstein R. 2007. Genome-wide analysis of Rad52 foci reveals diverse mechanisms impacting recombination. PLoS Genet. 3:e228 10.1371/journal.pgen.0030228 [DOI] [PMC free article] [PubMed] [Google Scholar]
- Feng Z., Scott S.P., Bussen W., Sharma G.G., Guo G., Pandita T.K., Powell S.N. 2011. Rad52 inactivation is synthetically lethal with BRCA2 deficiency. Proc. Natl. Acad. Sci. USA. 108:686–691. 10.1073/pnas.1010959107 [DOI] [PMC free article] [PubMed] [Google Scholar]
- Lisby M., Rothstein R., Mortensen U.H. 2001. Rad52 forms DNA repair and recombination centers during S phase. Proc. Natl. Acad. Sci. USA. 98:8276–8282. 10.1073/pnas.121006298 [DOI] [PMC free article] [PubMed] [Google Scholar]
- Rohn J.L., Sims D., Liu T., Fedorova M., Schock F., Dopie J., Vartiainen M.K., Kiger A.A., Perrimon N., Baum B. 2011. Comparative RNAi screening identifies a conserved core metazoan actinome by phenotype. J. Cell Biol. 194:789–805. [DOI] [PMC free article] [PubMed] [Google Scholar]


