Abstract
Metal-on-metal (MOM) hip prosthesis bearings have enjoyed renewed popularity, but concerns remain with wear debris and metal ion release causing a negative response in the surrounding tissues. Further understanding into the wear and corrosion mechanisms occurring in MOM hips is therefore essential.
The purpose of this study was to evaluate the tribocorrosion behaviour, or interplay between corrosion and wear, of a low-carbon CoCrMo alloy as a function of loading. The tribocorrosion tests were performed using two tribometer configurations. In the first configuration, “System A”, a linearly reciprocating alumina ball slid against the flat metal immersed in a phosphate buffer solution (PBS). In the second configuration, “System B”, the flat end of a cylindrical metal pin was pressed against an alumina ball that oscillated rotationally, using bovine calf serum (BCS) as the lubricant and electrolyte. System B was custom-built to emulate in vivo conditions. The tribocorrosion tests were performed under potentiostatic conditions at -0.345V, with a sliding duration of 1800 seconds and a frequency of 1Hz. In System A the applied loads were 0.05, 0.5, and 1N (138, 296 and 373MPa, respectively) and in System B were 16, 32, and 64N (474, 597, and 752MPa, respectively). Electrochemical impedance spectroscopy (EIS) and polarization resistance were estimated. The total mass loss (Kwc) in the CoCrMo was determined. The mass loss due to wear (Kw) and that due to corrosion (Kc) were determined. The dominant wear regime for the CoCrMo alloy subjected to sliding changes from wear-corrosion to mechanical wear as the contact stress increases. An attempt was made to compare both system, in their tribochemical responses and formulate some insights in the total degradation processes. Our results also suggest that the proteins in the serum lubricant assist in the generation of a protective layer against corrosion during sliding. The study highlights the need of adequate methodology/guidelines to compare the results from different test systems and translating in solving the practical problems.
Keywords: Tribocorrosion, CoCrMo alloy, Normal Load, Metallic Implants, Synergism
1. Introduction
Metal-on-metal (MOM) bearings currently constitute about 35% of over 200,000 primary total hip replacement procedures performed annually in the US, a number that is expected to approach 600,000 by 2030 [1-2]. However, there are increasing reports of adverse local tissue responses mediated by degradation products - metal ions and wear debris - generated by wear and corrosion of metal-on-metal total hip replacements and surface replacements [2]. These degradation products can cause hypersensitivity, toxicological risk to systemic and remote sites and periprosthetic bone resorption [3-5].
The great majority of MOM bearings are made of CoCrMo alloys. These alloys have been extensively used in biomaterials for joint replacement due to their wear and corrosion resistance. A protective Cr oxide (Cr2O3 or other oxidation states) film forms on the surface of the alloy that inhibits corrosion and the release of metal ions [6-7]. The degree of protection depends on the composition of the oxide film, which in turn depends on the body fluids [8]. On the bearing surfaces, there is in addition the synergistic effect of wear and corrosion, i.e., tribocorrosion that can markedly increase material loss [9-11]. Thus, the total material loss (Kwc) can be much higher than the material loss due to pure corrosion (Kc), without the influence of wear, or the material loss due to wear in absence of corrosion (Kw) [12]. According to Stack et al. [13], the dominant regime for material loss in the system can be inferred from the value of the Kc/Kw ratio, where Kc is calculated with Faraday's law from the current measured during the test. A value in the range of 0.1 to 1 corresponds to a wear-enhanced corrosion mechanism, whereas lower values point to a mechanism dominated by mechanical wear. Further, the value in the range of 1 to 10 indicate corrosion enhanced wear mechanism and above 10 corresponds to corrosive process [13].
Although the corrosion resistance of CoCrMo alloys has been extensively investigated, little work has been performed to date to evaluate their tribocorrosion behavior. Yan et al. [6] found that load and articulations could increase the corrosion rate and the metal ion release processes. It was noticed that main ions released from the tested materials were Co ions. They also observed that electrochemical methods can affect the protein adsorptions process, resulting in the transition of wear and corrosion mechanisms. Recently, it has also been determined that CoCrMo hip bearing surfaces undergo microstructural changes and chemical reactions with the joint environment during articulation that produce a mechanically mixed zone of nanocyrstalline metal and organic constituents, referred to as a biotribolayer. This layer appears to be critical to reducing wear and corrosion [14]. Triboelectrochemical studies have been performed using various sliding contact test configurations that include pin-on-disk, pin- or ball-on-flat, and ring-on-disk [15].
The purpose of this study was to evaluate the tribocorrosion behavior as a function of load for a low-carbon CoCrMo alloy by using two different test set-ups, one a linearly reciprocating ball-on-flat configuration and the other a custom-made pin-on-ball setup that more closely simulates the hip in vivo conditions. We also sought to contrast two distinct test configurations, and determine to what extent the simpler configuration matched the more complex in vivo-like configuration.
2. Materials and Methods
2.1. Overview
The experimental design for this study consisted of using two wear test configurations or tribo-systems to determine the parameters related to the tribocorrosion of a low-carbon CoCrMo alloy subjected to sliding against an alumina counterface. In the first configuration, “System A”, a linearly reciprocating alumina ball slid against the metal flat immersed in a phosphate buffer solution (PBS). In the second configuration, “System B”, the flat end of a cylindrical metal pin was pressed against an alumina ball that oscillated rotationally, using bovine calf serum (BCS) as the lubricant and electrolyte. System B was custom-built to emulate in vivo conditions. In both systems, the test chamber doubled as an electrochemical cell, with the CoCrMo component as the working electrode. All the tribocorrosion tests were performed in triplicate (n=3), to check reproducibility, under potentiostatic conditions at -0.345V, with a sliding duration of 1800 seconds and a frequency of 1Hz. The main input variable was load. In System A, the applied loads were 0.05, 0.5, and 1N (138, 296, and 373MPa initial Hertzian contact stress), chosen match the generally used loads in such tribometer in tribocorrosion studies. In addition, such low loads might assist in investigating the nature of the passive film. In system B, the applied loads were 16, 32 and 64 N (474, 597 and 752 MPa (these values are initial Hertzian contact pressure)). After running-in period, with more conforming contact, this corresponded to approximately 15, 30, 60MPa in the normal hip joint during the daily activities [16, 17]. The numerical output variables were the polarization resistance, the total material loss (Kwc), the loss due to mechanical wear (Kw) and the loss due to corrosion or “chemical wear” (Kc). Details of the materials and wear test configurations and test conditions follow.
2.2. The CoCrMo Specimens
The rods were originated from two sources, despite having almost identical elemental compositions and hardness (Table 1). The CoCrMo specimens used in System B were machined from rods of a low-carbon (LC) CoCrMo wrought alloy from Alloy 1 specification in ASTM Standard F1537-07. The tested specimens consisted of disks 20 mm in diameter and 3.67 mm thick for the ball-on-plate system (System A) and 12 mm in diameter and 7 mm in thickness for the pin-on-ball system (System B). The tested surfaces were mechanically polished to a mirror finish (Ra=0.002±0.01μm), cleaned with propanol in an ultrasonic bath, rinsed with distilled water, and dried using warm air prior to testing.
Table 1.
Source, Rockwell hardness, and elemental composition of the low-carbon wrought CoCrMo alloy used in this study.
| Samples | Source | Original Rod Diameter (mm) | Rockwell C Hardness | Chemical Composition (%wt) | ||||||
|---|---|---|---|---|---|---|---|---|---|---|
| C | Co | Cr | Mo | Si | Mn | Al | ||||
| System A | SURGIVAL (Spain) | 20 | 38 | 0.04 | 64.81 | 27.82 | 5.82 | 0.36 | 0.78 | <0.02 |
| System B | ALLVAC (USA) | 29 | 42 | 0.03 | 64.96 | 27.56 | 5.70 | 0.38 | 0.60 | <0.02 |
2.3. The Electrolytes
The electrolyte used for the ball-on-plate configuration (System A) was phosphate buffered solution (PBS) whereas the electrolyte and lubricant used for the pin-on-ball configuration (System B) was bovine calf serum (BCS), supplied by Invitrogen corporation and diluted with a buffered saline solution to have a protein concentration of 30 g/L. Their compositions are given in Tables 2 and 3, respectively. The pH of both electrolytes was adjusted to 7.65±0.04, to be comparable to the pH of human joint fluid (synovial fluid).
Table 2.
Chemical composition of PBS solution, used in System A (total amount: 1L).
| NaCl (g/L) | KH2PO4 (g/L) | KCl (g/L) | Na2HPO4 (g/L) |
|---|---|---|---|
| 8.18 | 0.14 | 0.22 | 1.42 |
Table 3.
Chemical composition of BCS solution, used in System B (total amount: 600mL).
| NaCl (g/L) | EDTA (g/L) | Tris (g/L) | Protein (g/L) |
|---|---|---|---|
| 9 | 0.2 | 27 | 30 |
2.4. Tribocorrosion Tests
2.4.1. Common Electrochemical Protocol
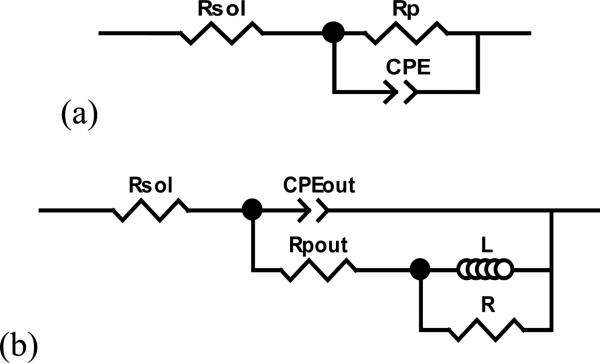
The protocol for all the tribocorrosion tests entailed three phases: initial stabilization before sliding test, sliding test, and final stabilization after sliding test. Electrochemical impedance spectroscopy (EIS) measurements were performed before and after sliding using two potentiostats: model Reference 600, for System A, and G300, for System B (Gamry Instruments, Warminster, PA, USA). Using the ZView software (Scribner Associates, Southern Pines, NC, USA), the Randles EIS equivalent circuit (Figure 1a) was used to determine the polarization resistance (Rp) for System B and System A before sliding tests. For System A, a specially designed equivalent circuit was used to model impedance data after sliding test (Figure 1b).
Figure 1.
Schematic diagram for (a) the three-element Randles equivalent circuit, and (b) the specially designed circuit. Rsol - solution resistance; Rp – polarization resistance; CPE – constant-phase element; CPEout - outer layer constant-phase element; Rpout - outer layer polarization resistance; RL - resistance-inductance.
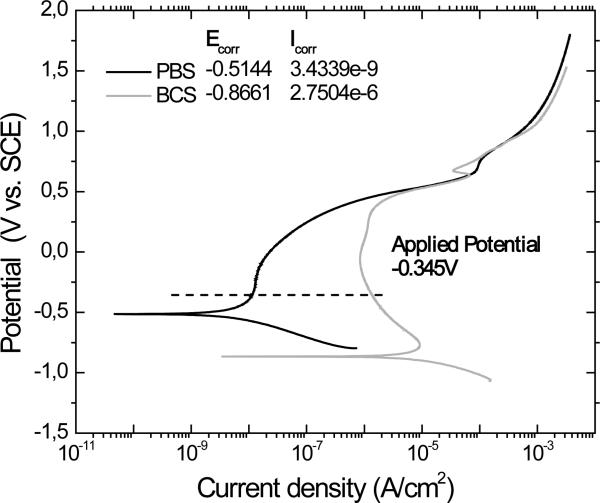
The applied anodic potential of -0.345V vs. SCE for the potentiostatic conditions was chosen based on the potentiodynamic curve from the initial corrosion tests (Figure 2) to represent a passive potential of the CoCrMo alloy in BCS and PBS. The corrosion potential, Ecorr, and the corrosion current density, Icorr, were obtained according to the Tafel's slope method and tabulated in the Figure 2. The changes from cathodic to anodic reactions occur at the corrosion potential (Ecorr). Above this potential the cathodic reactions are negligible and the current is determined by the kinetics of metal oxidation, the anodic reactions. A passive region can also be observed in both curves.
Figure 2.
Polarization curve of low carbon CoCrMo alloy in PBS and BCS solutions. Potential range from -0.8 to 1.8V, scan rate of 1mV/sec.
2.4.2. The Tribometers
System A, Conventional CETR Tribometer
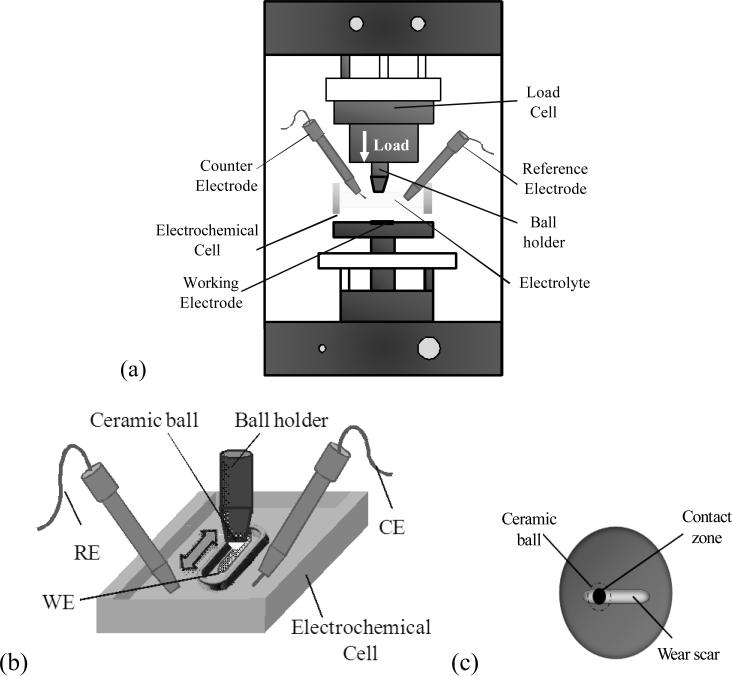
A CETR tribometer (Model UMT-2, CETR, Campbell, California, USA) was used in the ball-on-plate configuration, whereby a 10mm diameter alumina ball slid against a CoCrMo disk in a linearly reciprocating path (Figure 3a). The stroke length was 5 mm. A saturated calomel electrode (SCE) was used as the reference electrode (RE), a platinum (Pt) electrode as counter electrode (CE) and the CoCrMo disc as a working electrode (WE), as shown in Figure 3b). The active area of the working electrode was 2.29cm2. Tests were performed in two different electrochemically controlled techniques: (i) free potential condition (Ecorr) (ii) potentiostatic test with an applied potential of -0.345V vs. SCE. Each test began with a cathodic cleaning treatment (potentiostatic condition at -0.8V vs. SCE) with the purpose to remove oxides that were air-formed at the surface. EIS measurements were carried out in a frequency range from 63kHz to 0.001Hz with 10 frequency/decades within. Each test was started with a fresh alumina ball surface.
Figure 3.
Depiction of the conventional CETR tribometer for System A. (a) Tribometer set-up. (b) Test area. (c) Top view of the test area.
System B, Customized Tribosystem
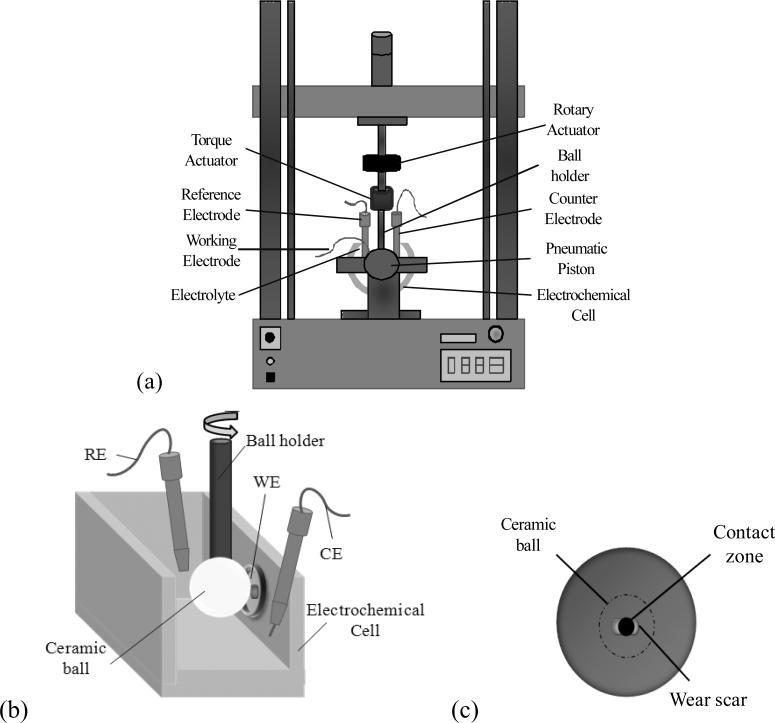
This tribosystem entailed a pin-on-ball configuration in which the flat end of a cylindrical CoCrMo pin was loaded against the equator of a rotationally oscillating 28mm diameter alumina ball (Figure 4). The oscillation frequency was 1Hz, with a ball rotation of ± 15° for 1800 cycles. The RE used was the same as in System A. A graphite rod was used as the counter electrode. The area of the sample exposed to the electrolyte was 1.13cm2. Tests were also performed at Ecorr and under potentiostatic conditions with the same applied potential. The cleaning process was performed at -0.9V vs. SCE. Electrochemical impedance was carried out in a frequency range from 63kHz to 0.001Hz, with 10 frequency/decades. Each test was started with a fresh alumina ball surface.
Figure 4.
Depiction of the pin-on-ball custom built tribometer, System B, used in this study. (a) The tribometer set-up. (b) The test area. (c) Top view of the test area.
The test conditions and a comparison of tribometer Systems A and B are given in Table 4.
Table 4.
Test conditions and a comparison between systems A and B.
| Similarities | Differences | ||
|---|---|---|---|
| System A | System B | ||
| Applied potential | -0.345V | Pin-on-plate | Ball-on-flat |
| Sliding time | 1800 sec | Reciprocating motion | Oscillatory/rotary motion |
| No. of cycles | 1800 | ||
| Frequency | 1Hz | Area exposed to electrolyte (2.28 cm2) | Area exposed to electrolyte (1.13 cm2) |
| Protocol | Three phases | Low loads (0.05N, 0.5N, 1N) | High loads (16N, 32N, 64N) |
| Material (sample) | Low carbon-CoCrMo | PBS solution (30mL) | BCS solution (150mL) |
| Counterbody | Ceramic ball | Total distance (18m) | Total distance (26.4 m) |
| Average velocity | Sliding distance (10 mm/s) | Sliding distance (14.7 mm/s) | |
| Velocity profile | Sinusoidal | Horizontal position of the plate causes the wear debris to spread in the vicinity of the contact zone | Vertical position of the pin causes the release of the wear debris to the solution (under gravity force) |
2.5. Mass Loss Due to Wear and Corrosion
The total mass loss (Kwc) during tribocorrsion is the sum of the loss due to wear (Kw) and that due to corrosion (Kc), so that [13]:
| (1) |
To obtain the total mass loss, Kwc, topographical measurements of the wear scar were made using a scanning white light interferometry microscope (Zygo Corporation, Middlefield, CT, USA), from which the wear volume was calculated using the MetroPro 8 software (Zygo Corporation). The mass loss was then calculated by multiplying this volume by the density of the CoCrMo alloy, 8.30 g/cm3 [18].
The mass loss (in grams) due to corrosion was estimated from Faraday's law
| (2) |
where q is the charge in coulombs passed through the working electrode, M (g/mole) is the atomic weight of the element being dissolved, n is the dissolution valence (in this study, n=2 was used for calculations) and F is Faraday's constant (96490 coulombs/mole). The charge q was calculated by integrating the current i measured during the test over time t (see Figure 5). Hence, the weight loss due to wear is determined by Eq 3
| (3) |
Figure 5.
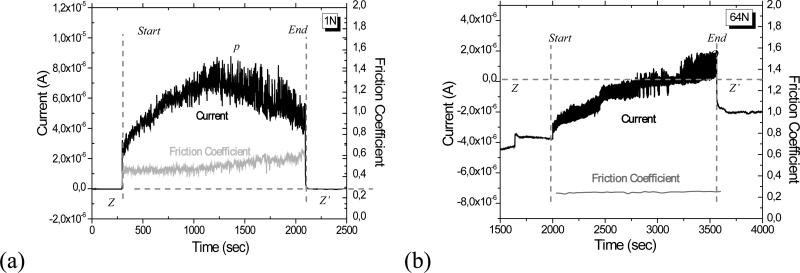
Evolution of the current and the friction coefficient during a 30 minutes sliding run at (a) 1N in PBS solution (System A) and at (b) 64N in BCS solution (System B). Dotted line (Z-Z’) shows zero current. For System B , the current jump at t = ~1600 seconds corresponds to the point of application of the load, before sliding; sliding started at t = 2000 sec.
2.6. Surface Characterization
Morphological characterization of the surface was carried out using different techniques: scanning electron microscopy (SEM) and energy dispersive X-ray spectroscopy (EDS) (Model-Joel JSM-6490 LV, Oxford Instruments, England), white light interferometry (Zygo Corporation, Middlefield, CT, USA).
3. Results
3.1. Evolution of current and friction coefficient during the sliding test
During the tribocorrosion tests, the evolution of current and friction coefficient were monitored as a function of time are shown in Figure 5 for the maximum loads (1N for System A and 64N for System B). When the sliding starts, the current abruptly increases to a higher value, corresponding to a sudden increase in the corrosion rate of the exposed surface as sliding removes the passive film and the surface left behind becomes unprotected. When sliding stops, the current decreases abruptly to a value similar to the initial one, as the metal in the mechanically activated area repassivates. The oscillation of the current and friction coefficient arise from the depassivation and repassivation of the metal surface, and follow the cyclic motion (Figure 5). In addition, the test configuration and electrolyte influenced the evolution of the current and friction coefficient. In System A, the current was anodic throughout and peaked midpoint in time (Figure 5(a)), whereas in System B, the current gradually increased to more anodic values throughout the test (Figure 5(b)). The current increase during the first half of the sliding run for System A is thought to be associated with further damage of the passive layer, an increase in the wear scar width, and roughening of the surface. The decrease in current during the second half of the run suggests the formation of a partially protective film, perhaps associated with oxidized and compacted wear debris tribomaterial [19]. Similar decreases in current with time have been observed in the tribocorrosion of titanium oxycarbide films [20]. For System B, the gradual increase in the current may be connected with the gradual increase of the wear scar area as the test progresses. The current increase is not smooth probably because the current is impacted by the uneven accumulation and egress of the wear debris in the contact zone and by the dynamic nature of film formation and destruction on the metal surface.
3.2 Electrochemical impedance data before and after the sliding
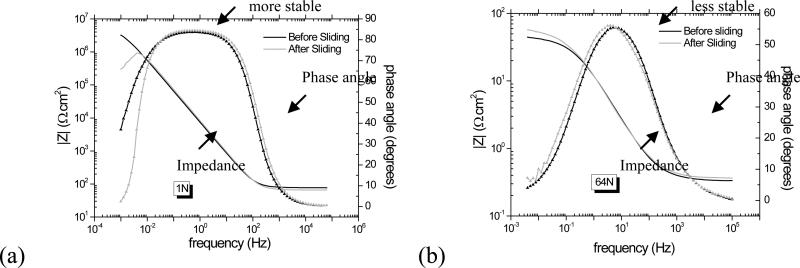
The bode plots (impedance |Z| vs. frequency and phase angle vs. frequency) are presented in Figure 6. For both solutions, only one time constant can be seen in the phase angle (Figure 6, line with symbol) at lower frequencies. At the highest frequencies, the impedance (|Z|) and phase angle values tend to become constant, which is characteristic of resistive behavior and arises from the electrolyte resistance [16-17]. It confirms the presence of a compact, homogeneous and protective passive film on the surface. After sliding, the impedance has decreased in System A (Figure 6(a), grey line, <0.01 Hz), whereas it has increased in System B (Figure 6(b), grey line , <0.01 Hz). The increase denotes a slowing down of the corrosion kinetics, possibly due to the presence of proteins in the BCS solution.
Figure 6.
Bode plot from electrochemical impedance spectroscopy measurements for (a) 1N in PBS solution and for (b) 64N in BCS solution, System A and B, respectively.
For all applied loads, the polarization resistance, Rp, was higher before sliding than after sliding for System A, while the reverse was true for System B. This is shown graphically in Figure 7 for the highest load in each system. The low Rp after sliding (Figure 7 (a)) indicates poor corrosion resistance of the surface in System A, which might be due to the large area of the worm surface (no passive film) and the presence of wear debris in the vicinity of the contact zone. In contrast, the high Rp after sliding (Figure 7 (b)) in System B indicates improved corrosion resistance of the surface, perhaps connected to exposure to the proteins in solution. The constant coverage of the worn area by the alumina counterface and the possibility for wear debris to fall away might be other reasons for this observation [19].
Figure 7.
Polarization resistance before and after sliding at the highest normal load in (a) System A and in (b) System B.
3.3 Wear scar profile and surface characterization
The wear scars shapes were consistent with the motion and shape of the alumina counterface. For System A, they were therefore grooves with an approximately circular arc cross-section (Figure 8 (a)), whereas for System B, they consisted of depressions ranging from almost spherical at low loads to ellipsoidal at high loads (Figure 8 (b)). The ellipsoidal shape stemmed from a slight lateral movement of the rotating ball against the pin when subjected to a high contact pressure. For both systems, the wear volumes could be readily determined from topographical measurements, and the corresponding weight losses are given in Table 5. The longitudinal scratches seen in the wear scars from System A may be associated with wear debris in the contact zone.
Figure 8.
3-dimensional image of the wear scar using Zygo Microscope for (a) System A and (b) System B, with 1N and 64N, respectively.
Table 5.
Wear-corrosion volume loss for the highest normal loads of both systems.
| Normal load | Kwc [μg] | Kw [μg] | Kc [μg] | Kc/Kw | |
|---|---|---|---|---|---|
| System A | 0.05N | 0.08 ± 0.12 | 0.07 ± 0.10 | 0.01 ± 0.02 | 0.13 |
| 0.5N | 5.10 ± 3.03 | 3.83 ± 2.68 | 1.28 ± 0.36 | 0.30 | |
| 1N | 7.09 ± 7.65 | 5.10 ± 8.03 | 2.00 ± 0.40 | 0.35 | |
| System B | 16N | 4.13 ± 0.22 | 3.06 ± 0.16 | 1.07 ± 0.05 | 0.35 |
| 32N | 7.31 ± 0.36 | 5.68 ± 0.89 | 1.63 ± 0.08 | 0.29 | |
| 64N | 19.40 ± 0.99 | 18.87 ± 1.06 | 0.52 ± 0.03 | 0.03 |
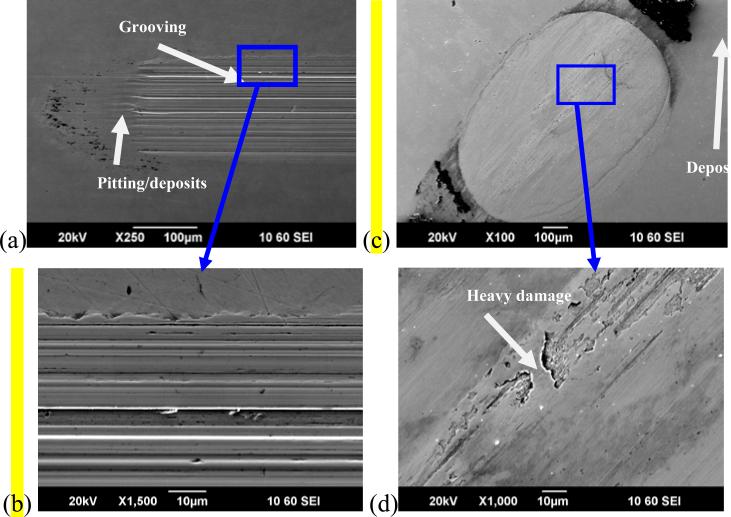
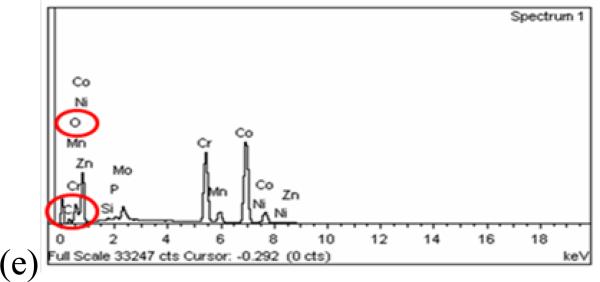
Examination of the wear scars by SEM revealed some pitting corrosion at the motional ends of the wear scars (Figure 9 (a) and (c)). These localized imperfections on the oxide layer were made by wear debris pushed to the edge where the movement stops. The debris damages the protective film, leading to pitting corrosion and corrosion products rich in oxygen as verified by EDS analysis (Figure 9 (e)). Inside the wear track, wear debris particles were observed (Figure 9 (b) and (d)), even though those surfaces had undergone cleaning in an ultrasonic bath prior to examination. These strongly adhering particles can induce current variations during the sliding [19].
Figure 9.
SEM micrographs of the wear scars on the CoCrMo surface for System A (left side, (a) and (b)) at 1N and for System B (right side, (c) and (d)) at 64N. (e) Typical EDS spectrum for pits and passive film on the surface. Si and Mn are impurities in the alloy.
3.4 Weight loss distribution as a function of load
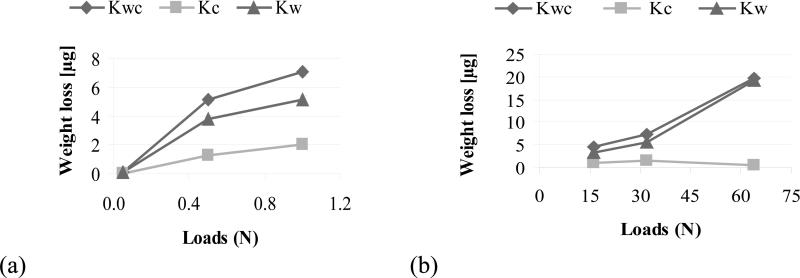
The weight loss distribution in terms of Kwc (total weight loss), Kc (weight loss due to corrosion), and Kw (weight loss due to wear) as a function of load is shown graphically in Figure 10 and tabulated in Table 5 for both systems.
Figure 10.
Total weight loss distribution for (a) System A and (b) System B.
The total weight loss (Kwc) and weight loss due to wear (Kw) increase with load in both systems. Although the weight loss due to corrosion increases with load for System A, it is highest at the intermediate load of 32 N for System B. The contribution of corrosion is consistently small compared with the contribution of mechanical wear (Kwc and Kw, in Figure 10). Because metal loss due to corrosion is estimated from the current measured during the tribocorrosion test, the influence of current from the unworn area should not be neglected [19]. In this study, it is compensated by using the current before sliding as the zero point.
4 Discussion
In this study we evaluated the tribocorrosion behavior of a low-carbon CoCrMo alloy, two test systems, namely, a conventional reciprocating sliding system (System A) and a specially designed tribosystem emulating to some extent the hip joint contact conditions (System B). System A is relevant from a practical point of view because it has been used by various research labs. We therefore also sought to contrast the two test configurations and determine to what extent the simpler configuration matched the more complex in vivo-like configuration, with an aim to capture the key test parameters for evaluating the tribocorrosion behavior of CoCrMo alloys used for joint bearings.
The much higher currents observed in System A compared to System B during sliding (Figure 5) despite the lower normal loads and electrolyte salt concentration suggest that the proteins may have a strong protective effect against tribocorrosion. The markedly higher friction coefficient in System A (0.50) compared to System B (0.25) also suggests that the proteins are acting as effective boundary lubricant. The electrochemical impedance measurements indicate presence of a compact, homogeneous and protective passive film on the surface for both systems. Evidence for this film is seen in SEM micrographs (Figure 9). However, the impedance decrease after sliding at low voltage excitation frequencies observed in System A (Figure 6 (a)) suggests that the film formed may offer less protection after sliding than before. The corresponding increase in impedance for System B (Figure 6 (b)) suggests the opposite, i.e., a more protective film exists after sliding than before. These impedance results are consistent with the trends observed for the polarization resistance, Rp. Its decrease after sliding for System A (Figure 7 (a)) indicates decreased corrosion protection, whereas its increase for System B (Figure 7 (b)) indicates increased protection. The latter is consistent with the formation of protective tribolayer.
The extent and shapes of the wear scars are indicative of the considerable difference in the motions and lubrication in the two systems. In System A, in which an alumina ball slides against a CoCrMo flat (Fig. 3), the horizontal reciprocating motion (back-and-forward) causes the oxide film on the metal to be constantly destroyed and re-formed. When the pin goes forward, it removes the protective film and the clean metal left behind can corrode more easily. It yields galvanic coupling of two distinct surface states of the metal: the passive metal (unworn area) and the bare metal (worn area) exposed to the solution by abrasion of the passive film. In System B, in which an alumina ball rotates right-to-left against a CoCrMo flat (Figure 4), the contact zone is a small and elliptical area (Figure 8 (b)) that restricts access of the electrolyte to corrode the unprotected surface [20-21].
In addition, the mechanical and electrochemical mechanisms during rubbing lead to the release of metallic wear particles, as observed in Figure 8 (c). Those detached particles could form third bodies and be ejected from the contact, and/or be spread on the metal surface, resulting in the formation of solid oxides or dissolved ions. Thus, in System A there is the accumulation of wear particles around the wear scar on the unworn area. Those small localized particles will remove the protective film in that unworn area, inducing pitting corrosion, increasing the size of the corroded area and the total amount of corrosion. On the other hand, in System B the wear particles have a greater chance to disperse into the electrolyte under the influence of gravity [19, 22].
4.1 Synergistic Interactions
A point of particular interest in evaluating tribocorrosion are the synergistic interactions between wear and corrosion, as they will affect the tribological mechanisms and could have a significant influence on the amount of material loss. Stack et al. [9, 13] determined that the ratio Kc/Kw of the chemical wear (Kc) and mechanical wear (Kw) provides a criterion for the magnitude of this synergism and the ensuing dominant regime present in a tribocorrosion system. The value of this ratio of corrosion-to-wear contribution is indicative of the synergistic interaction and is connected to the dominant wear mechanism as follows [13]:
| Ratio of Corrosion-to-Wear Contribution | Degradation Mechanism |
|---|---|
| Kc/Kw ≤ 0.1 | wear |
| 0.1 < Kc/Kw < 1 | wear-corrosion |
| 1< Kc/Kw ≤ 10 | corrosion-wear |
| Kc/Kw >10 | corrosion |
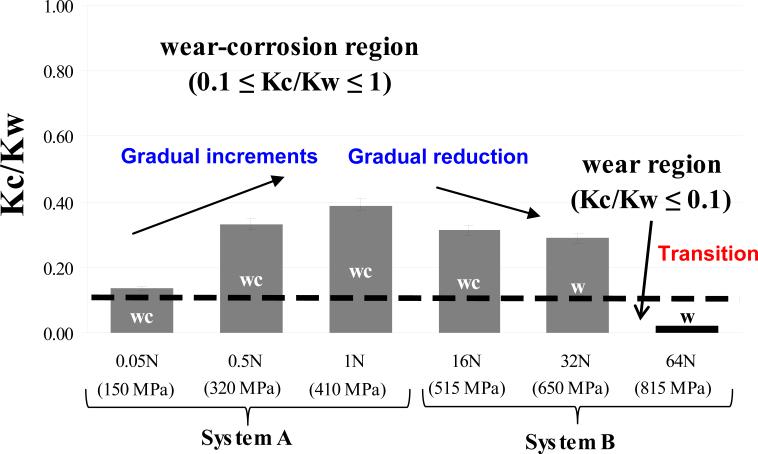
The values of Kc/Kw for Systems A and B are given in Table 5 and shown graphically in Figure 11 as a function of load. In System A, the Kc/Kw ratio lies in the range of 0.1<Kc/Kw<1 for all loads, indicating the mass loss mechanism is a wear dominated corrosion mechanism (wear-corrosion). In System B, a wear-corrosion mechanism also dominates for the first two load. Then there is a transition to wear dominated degradation mechanism at the highest load. It is of interest that the Kc/Kw ratio increases gradually with load for System A, but decreases with load for System B, suggesting that there is a contact stress which maximizes synergism and that mechanical wear can dominate at both low and high loads. The latter is understandable because the corrosion rate is limited by its kinetics whereas the mechanical wear can continue to increase with load. Further, the increase in corrosion with increasing load in System A may be partly associated with frictional heating effects. The transition from wear-corrosion to wear dominated regime is important because it may lead to the destruction of a bio-tribolayer that is consider to increase the wear resistance of CoCrMo alloys [14]. It is therefore important to determine the critical load at which such transition is expected and to compare it with the maximum loads expected for the system.
Figure 11.
Synergistic interactions for each load of two systems. Grey bar: wear-corrosion regime (wc); Black bar: wear regime (w).
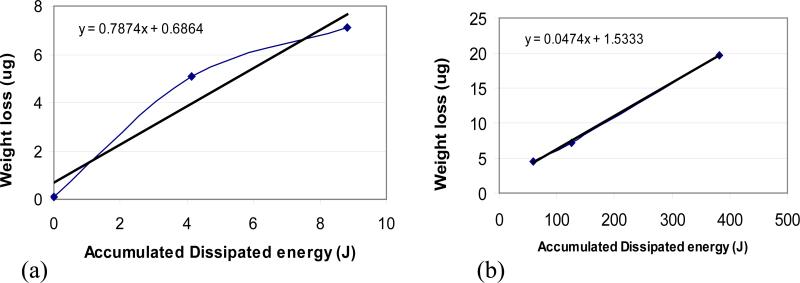
The two systems may also be compared with respect to their wear factors (Table 6). The wear factors for System A are on average 31 times those for System B, suggesting that the dominant wear mechanism is different in the two systems, perhaps due to the presence of proteins in System B. However, other factors, such differences in motion and contact stress may also be significant. Feasibly a more fundamental comparison of the two systems must be made by considering the total wear as a function of the total or accumulated dissipated energy [23-25], obtained by integrating the frictional force over the sliding distance. The wear versus accumulated dissipated energy curves downward for System A (Figure 12 (a)) but is fairly linear for System B (Figure 12 (b)), suggesting that in System A there is a mechanism rendering material removal less efficient at the highest load. A possibility is that wear particles remaining within the wear area protect the surface, either by re-adhering to it or acting as mini ball bearings. The average slope for System A is 17 times that for System B, which is lower than the corresponding ratio for the wear factors (31), suggesting that the dissipated energy offers a somewhat better basis for comparison of the two systems.
Table 6.
Wear factors for Systems A and B.
| Normal load | k – Wear Coefficient (Kwc) | k – Wear Coefficient (Kw) | |
|---|---|---|---|
| System A | 0.05N | 0.0908 | 0.1042 |
| 0.5N | 0.5671 | 0.4252 | |
| 1N | 0.3940 | 0.2832 | |
| System B | 16N | 0.0105 | 0.0080 |
| 32N | 0.0086 | 0.0066 | |
| 64N | 0.0111 | 0.0114 |
Figure 12.
The evolution of weight loss as a function of dissipation energy for system A and System B.
The comparison of results even for tribocorrosion tests following similar protocols can be difficult. Thus, Mischler et al. [22], conducted an multicenter study with seven laboratories in Europe that entailed a prescribed protocol to assure similar conditions with the tribometers, test systems, materials, environment, operating variables, surface cleaning, and electrochemical measurements. It was found that no clear correlation existed between any single parameters and the measured wear rates, but that the current during sliding was closely related to and increased with the wear track area. Consistent with this finding, System A has greater wear track area and corrosion (current) than System B, but the difference electrolytes confound.
4.2 Limitations
Because one of the objectives of this study was to compare a conventional test configuration as used by previous researchers with a test configuration geared to hip bearing applications, there were multiple test conditions that were simultaneously different between the two configurations, making it impossible to deconvolute the effect of each variable. Thus, the difference in motions, the lubricants, normal loads, and contact stresses were different in the two systems, so determining what was the effect of each of these variables when comparing the two systems was not possible. Also, although both tests were conducted under potentiostatic control at -0.345 V versus SCE, there was a possibility of a slight shift from this value [19, 22] during the tribocorrosion tests due to the tribochemical events at the surfaces. In using Faraday's law for the estimation of the mass Kc due to corrosion, the value n = 2 was used, whereas the true value lies somewhere between 2 (Co → Co(II)) and 3 (Cr → Cr(III)). In addition, Pontiaux et al [19] highlighted the possible electrochemical interaction between worn and unworn area during the sliding, leading to the presence of galvanic couple that may impact corrosion processes.
5 Conclusions
The tribocorrosion behavior of a low-carbon CoCrMo alloy used for hip bearing applications was evaluated using two distinct tribometer configurations. In the first configuration, “System A”, a linearly reciprocating 1 alumina ball slid against the metal flat immersed in a phosphate buffer solution (PBS). In the second configuration, “System B”, the flat end of a cylindrical metal pin was pressed against an alumina ball that oscillated rotationally, using bovine calf serum (BCS) as the lubricant and electrolyte. System B was custom-built to more closely emulate in vivo conditions. The following conclusions were drawn:
The tribocorrosion behavior of the CoCrMo alloy is influenced by the test system and required to be considered while interpreting the result.
- It was more favorable in System B, which was closer to in vivo conditions. Thus, comparing System B to System A:
- ○ The electrochemical impedance after sliding increased, whereas it decreased in System A.
- ○ The polarization resistance increased, rather than decreased as in System A, indicating a protective effect.
- ○ The friction coefficient in System B was lower than that in System A (approximately half in the case of highest load 1N and 64N).
- ○ The wear factor and energy dissipation per unit mass loss were over an order of magnitude lower in System B than A.
Except at the normal highest load, the dominant mass loss mechanism was wear-corrosion, suggesting marked synergism between wear and corrosion. At the highest load, 64 N in System B, the dominant mechanism was mechanical wear. Thus, there is a transition from wear-corrosion to mechanical wear somewhere between 32 and 64 N.
The more favorable tribocorrosion behavior of the alloy in System B despite the higher contact stresses may stem from the proteins in the electrolyte lubricant providing boundary lubrication and assisting in the formation of a biotribolayer (Wimmer 2010 [14]). Other factors include less direct exposure of the worn area to the electrolyte.
The results for System B suggest that the dominant mass loss mechanism in metal-on metal bearings is wear-corrosion.
The notable differences between the two systems indicate that emulating key aspects of the in vivo conditions is important.
Further work is required to identify all the key factors impacting the tribocorrosion of CoCrMo in the context of clinical applications. The identification of these factors may allow the formulation of a simplified, canonical tribocorrosion test that embodies the necessary aspects to evaluate alloys for hip bearings. An extensive study is planned to address such issues.
Acknowledgements
This study was funded by Luso-American Foundation (FLAD) grant in Portugal and National Institutes of Health (NIH), RC2 (1RC2AR058993-01) grant in Chicago. A special thanks to Prof. A. Fischer (University of Duisburg-Essen, Germany) for valuable discussion and Prof. R. Urban and Ms. D. Hall for the assistance in SEM characterization. Acknowledgments also go to Dr. Thomas Pandorf of Ceramtech, Plochingen, Germany for providing ceramic heads.
Footnotes
Authors would like to state that the paper received “Kent Ludema”, best paper award at WOM 2011, held at Philadelphia, April 2011.
References
- 1.Morbidity and Morality Weekly Report, MMWR, Prevalence and Most Common Causes of Disability Among Adults - United States, in, Department of health and human services, Centers for Disease Control and Prevention. 2009 May 1;58(16):421–426. [PubMed] [Google Scholar]
- 2.Jacobs JJ, Skipor AK, Patterson LM, Hallab NJ, Paprosky WG, Black J, Galante JO. Metal Release in Patients Who Have Had a Primary Total Hip Arthroplasty. A Prospective, Controlled, Longitudinal Study. J Bone Joint Surg Am. 1998;80:1447–1458. doi: 10.2106/00004623-199810000-00006. [DOI] [PubMed] [Google Scholar]
- 3.Doorn PF, Campbell PA, Worrall J, Benya PD, McKellop HA, Amstutz HC. Metal wear particle characterization from metal on metal total hip replacements: Transmission electron microscopy study of periprosthetic tissues and isolated particles. Journal of Biomedical Materials Research. 1998;42:103–111. doi: 10.1002/(sici)1097-4636(199810)42:1<103::aid-jbm13>3.0.co;2-m. [DOI] [PubMed] [Google Scholar]
- 4.DiCarlo EF, Bullough PG. The biologic responses to orthopedic implants and their wear debris. Clinical Materials. 1992;9:235–260. doi: 10.1016/0267-6605(92)90104-2. [DOI] [PubMed] [Google Scholar]
- 5.Hallab N, Merritt K, Jacobs JJ. Metal Sensitivity in Patients with Orthopaedic Implants. J Bone Joint Surg Am. 2001;83:428. doi: 10.2106/00004623-200103000-00017. [DOI] [PubMed] [Google Scholar]
- 6.Yan Y, Neville A, Dowson D. Biotribocorrosion an appraisal of the time dependence of wear and corrosion interactions: I. The role of corrosion. Journal of Physics D: Applied Physics. 2006;39:3200. [Google Scholar]
- 7.Neville A, Yan Y, Dowson Duncan. Tribo-corrosion properties of cobalt-based medical implant alloys in simulated biological environments. Wear. 2007;263:1105–1111. [Google Scholar]
- 8.Hanawa T, Hiromoto S, Asami K. Characterization of the surface oxide film of a Co-Cr-Mo alloy after being located in quasi-biological environments using XPS. Applied Surface Science. 2001;183:68–75. [Google Scholar]
- 9.Stack MM, Pungwiwat N. Erosion-corrosion mapping of Fe in aqueous slurries: some views on a new rationale for defining the erosion-corrosion interaction. Wear. 2004;256:565–576. [Google Scholar]
- 10.Trezona RI, Allsopp DN, Hutchings IM. Transitions between two-body and three-body abrasive wear: influence of test conditions in the microscale abrasive wear test. Wear. 1999;225-229:205–214. [Google Scholar]
- 11.Adachi K, Hutchings IM. Wear-mode mapping for the micro-scale abrasion test. Wear. 2003;255:23–29. [Google Scholar]
- 12.Jiang J, Stack MM, Neville A. Modelling the tribo-corrosion interaction in aqueous sliding conditions. Tribology International. 2002;35:669–679. [Google Scholar]
- 13.Stack MM, Abdulrahman GH. Mapping erosion-corrosion of carbon steel in oil exploration conditions: Some new approaches to characterizing mechanisms and synergies. Tribology International. 2010;43:1268–1277. [Google Scholar]
- 14.Wimmer MA, Fischer A, Büscher R, Pourzal R, Sprecher C, Hauert R, Jacobs JJ. Wear mechanisms in metal-on-metal bearings: The importance of tribochemical reaction layers. Journal of Orthopaedic Research. 2010;28:436–443. doi: 10.1002/jor.21020. [DOI] [PubMed] [Google Scholar]
- 15.Landolt D, Mischler S, Stemp M. Electrochemical methods in tribocorrosion: a critical appraisal. Electrochimica Acta. 2001;46:3913–3929. [Google Scholar]
- 16.Buscher R, Tager G, Dudzinskil W. Subsurface Microstructure of metal-on-metal hip joints and its relationship to wear particles generation. J. Biomed Material Res Part B: Appl Biomater. 2005;72B:206–214. doi: 10.1002/jbm.b.30132. [DOI] [PubMed] [Google Scholar]
- 17.Yoshida H, Faust A, Wilckens J, Kitagawa M, Fetto J, Chao EY. Three-dimensional hip contact area and pressure distribution during activities of daily living. Journal of Biomechaincs. 2006;39:1996–2004. doi: 10.1016/j.jbiomech.2005.06.026. [DOI] [PubMed] [Google Scholar]
- 18. ATIAllvac, http://www.alleghenytechnologies.com/allvac/pages/Nickel/UNSR31537.htm, in, Pittsburgh, PA , USA, Conculted in September 2010. [Google Scholar]
- 19.Ponthiaux P, Wenger F, Drees D, Celis JP. Wear. 2004;256:459–468. [Google Scholar]
- 20.Mathew MT, Ariza E, Rocha LA, Fernandes AC, Vaz F. TiCxOy thin films for decorative applications: Tribocorrosion mechanisms and synergism. Tribology International. 2008;41:603–615. [Google Scholar]
- 21.Hodgson AWE, Kurz S, Virtanen S, Fervel V, Olsson COA, Mischler S. Passive and transpassive behaviour of CoCrMo in simulated biological solutions. Electrochimica Acta. 2004;49:2167–2178. [Google Scholar]
- 22.Kurz AWEHS, Virtanen S, Fervel V, Mischler S. Corrosion characterization of passive films on CoCrMo with electrochemical techniques in saline and simulated biological solutions. European Cells and Materials. 2002;3(Suppl. 1):26–27. [Google Scholar]
- 23.Mischler S. Triboelectrochemical techniques and interpretation methods in tribocorrosion: A comparative evaluation. Tribology International. 2008;41:573–583. [Google Scholar]
- 24.Fouvry S, Liskiewicz T, Kapsa P, Hannel S, Sauger E. An energy description of wear mechanisms and its applications to oscillating sliding contacts. Wear. 2003;255(1-6):287–298. [Google Scholar]
- 25.Ramalho A, Miranda JC. The relationship between wear and dissipated energy in sliding systems. Wear. 2006;260(4-5):361–367. [Google Scholar]


