

Abstract
We report a novel mechanism of gene regulation in skeletal muscle fibers. Within an individual myofiber nucleus, not all muscle loci are transcriptionally active at a given time and loci are regulated independently. This phenomenon is particularly remarkable because the nuclei within a myofiber share a common cytoplasm. Both endogenous muscle-specific and housekeeping genes and transgenes are regulated in this manner. Therefore, despite the uniform protein composition of the contractile apparatus along the length of the fiber, the loci that encode this structure are not transcribed continuously. The total number of active loci for a particular gene is dynamic, changing during fetal development, regeneration, and in the adult, and potentially reflects the growth status of the fiber. The data reveal that transcription in particular stages of muscle fiber maturation occurs in pulses and is defined by a stochastic mechanism.
Keywords: Skeletal muscle, myonuclei, transcriptional regulation, stochastic regulation
The differentiated skeletal muscle cell, or myofiber, is a multinucleated syncytium. The myofiber is formed by the alignment and fusion of the muscle precursor cells, the myoblasts. During fusion and differentiation, muscle nuclei withdraw irreversibly from the cell cycle partly because of the activity of the retinoblastoma protein, Rb (Schneider et al. 1994). In an adult mouse, a myofiber can contain in excess of 100 nuclei (Franzini-Armstrong and Fischman 1994). Each myofiber is essentially a bundle of myofibrils, which give muscle its contractile properties, enclosed by the plasma membrane. The sarcomere is the structural subunit of the myofibril repeated along the length of the fiber and consists of interlocking thick and thin protein filaments (Craig 1994). The majority of the transcriptional output in a fiber derives from genes encoding the sarcomeric proteins.
Myofibers are dynamic cells that undergo dramatic changes in size during maturation and in response to innervation, exercise, and hormones. During in utero development in rodents, muscle-fiber formation occurs in two temporally distinct stages resulting in the formation of primary and secondary fibers (Hauschka 1994). These immature myofibers differ from adult fibers morphologically in that they have significantly smaller diameters (virtually the width of a nucleus) and the nuclei are located in the center of the cell. Postnatal muscle maturation is marked by a dramatic increase in fiber girth as a result of continued synthesis of myofibrils and the continued lengthening of existing fibers caused by the fusion of muscle precursor cells (Ontell and Dunn 1978). As a consequence of the packing of the interior of the muscle fiber with myofibrils, the nuclei are excluded from the center and reside at the periphery in a fully mature fiber. Should a fiber be damaged or destroyed, muscle precursor cells residing within the basal lamina of fibers termed satellite cells, are recruited for repair or replacement. This regeneration process recapitulates to a large extent the processes of fiber formation and growth that takes place during development (Bischoff 1994).
We report the novel observation that genes encoding proteins that are constitutively present in myofibers are not constitutively active. The frequency of active loci reflects the degree of maturation of the fiber. This has been observed by detecting transcripts of muscle genes localized around the nucleus of origin and by detecting nuclear localized transgene products. Muscle-specific endogenous genes, muscle-specific transgenes, and a ubiquitously expressed transgene all display this phenomenon. The expression in the fiber is a dynamic process as the proportion of transcriptionally active nuclei changes during fiber growth. We have used regenerating muscle as a model system to investigate this. The centrally situated myonuclei in regenerating fibers are easily distinguished from the satellite cells, making the distinction between an inactive myonuclei and a quiescent satellite cell unambiguous. Because regenerating skeletal muscle progresses through a massive growth phase that eventually tapers out, it presents a dynamic system in which to investigate changes in the pattern of gene expression from nuclei within myofibers. All myonuclei are capable of transcription. Furthermore, expression from different loci within a nucleus appears to be independent.
These findings reveal a previously undescribed facet of gene regulation in differentiated tissue. The number of nuclei expressing a gene at one time could be another point at which transcriptional output is regulated, either in addition to or in place of rates of transcription.
Results
The nuclei in a muscle fiber do not have equivalent gene expression
Transcripts for two muscle-specific genes encoding proteins of the thin filament, α-skeletal actin (α-SA) and troponin I slow (TnIs), were detected by in situ hybridization to sections of regenerating muscles. The regeneration protocol ensures that all the fibers in the muscle are destroyed such that any gene expression detected is occurring in newly formed fibers, rather than in mature fibers undergoing repair (Esser et al. 1993). The transcripts of both genes show perinuclear localization, enabling the identification of the nucleus of origin. Both genes encode proteins present in the thin filament of the myofibrils (Schiaffino and Reggiani 1996). Within an individual myofiber, nuclei were detected that were either expressing or not expressing the transcript for the gene analyzed. For both genes, a total of eight muscles from two separate experiments were analyzed. In over 300 fibers examined from various regions of the muscles, between 90% and 100% of the fibers showed variable nuclear expression.
An example of α-SA expression can be seen in fibers of the extensor digitorum longus (EDL) muscle at day 35 after surgery (Fig. 1A). The filled arrow indicates nuclei expressing α-SA, whereas the open arrow shows nuclei in the same fiber that are not expressing α-SA. The expression of the type I or slow-fiber isoform of the troponin I gene, TnIs, was examined in regenerating soleus, which is normally composed of 55% slow-twitch fibers (Schmalbruch 1985). TnIs mRNA expression in soleus showed a similar pattern of gene activity as there were both TnIs-expressing and nonexpressing nuclei in a single fiber. Figure 1B shows an example of TnIs mRNA expression in a regenerating fiber at 21 days after surgery. For both genes, the expressing and nonexpressing nuclei can occur in clusters or domains along the fiber depending upon the stage of regeneration.
Figure 1.
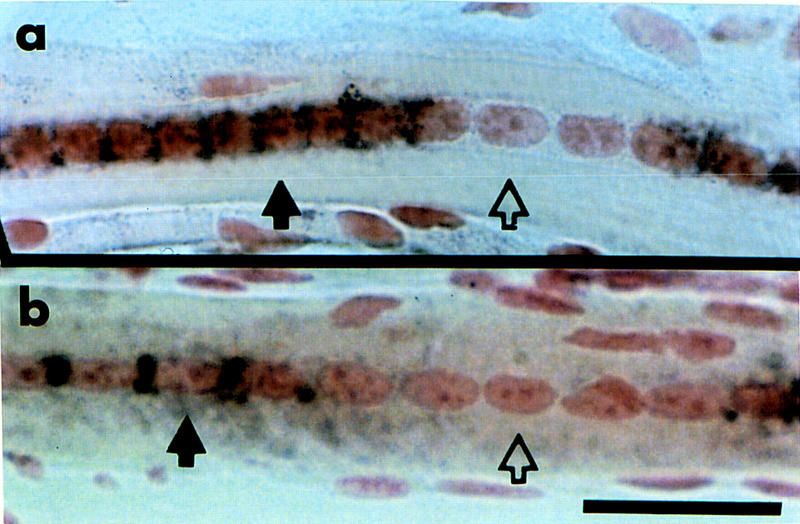
Myonuclei in regenerating muscle fibers are not transcriptionally equivalent. Transcripts of endogenous genes in adult mouse regenerating muscle were detected using in situ hybridization. The brown/black staining around the periphery of the nucleus indicates localization of the mRNA. (a) α-SA transcript was detected in extensor digitorum longus (EDL) muscle at day 35 after regeneration surgery. (b) TnIs transcript was detected in day 21 regenerating soleus muscle. The solid black arrows indicate myonuclei expressing the gene; the open arrows show a myonucleus in the same fiber that is not expressing the gene. Scale bar, 25 μm.
Transgenes are not expressed in all myofiber nuclei
The expression of three different transgenes was investigated in regenerating adult mouse muscle. For each transgenic line, sections from four muscles of two experimental mice were examined at 35 days after surgery. In each muscle, nuclei in ⩾90% of the fibers examined displayed variable expression of the transgene. TnIsUSE–95X1nucZ consists of the minimal promoter sequences from the human TnIs gene linked to a nuclear localized lacZ reporter gene and is expressed only in slow-twitch fibers of mouse muscle (Corin et al. 1995). The nuclear localization signal directs transport of the gene product back into the nucleus and, at a much reduced level, to one or at most two nuclei on either side of the source of expression as determined with electron microscopy. Any transport of gene product into a neighboring nucleus is evident readily by a greatly reduced level of product deposition (data not shown). β-Galactosidase activity in regenerating soleus from TnIsUSE–95X1nucZ transgenics was detected at day 35 after surgery. In four soleus, examples can be seen of regions in which not all the nuclei are expressing the transgene (Fig. 2A). Analyses were performed on mice either hemizygous or homozygous for the transgene.
Figure 2.
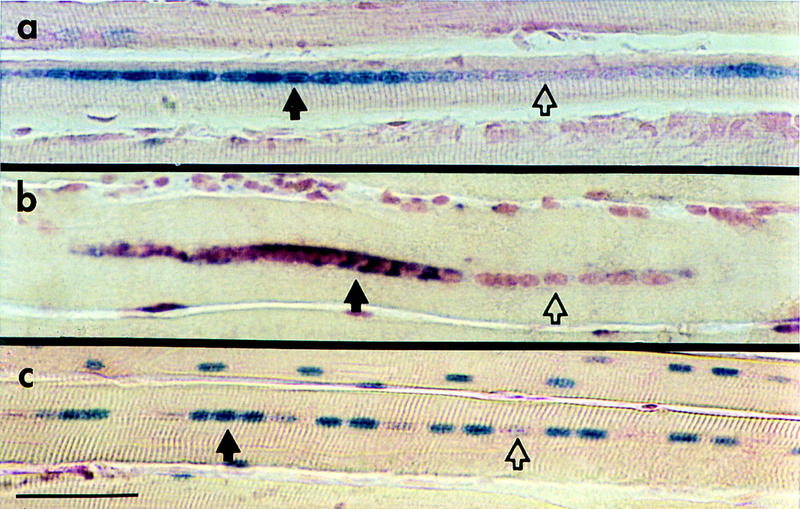
Transgene expression does not occur in all myofiber nuclei. Sections of regenerating fibers at day 35 postsurgery from transgenic mice showing nuclei expressing (solid arrows) or not expressing (open arrows) the transgene. The nuclei have been counterstained with nuclear fast red. (a) Soleus from a TnIsUSE–95X1nucZ mouse assayed for β-galactosidase activity. The nucleus stains blue if it contains β-galactosidase activity. (b) EDL from a −2000HSA–CAT mouse assayed for CAT transcripts by in situ hybridization. Purple staining in and around the nucleus indicates localization of transcripts. (c) EDL from a HMG–CoA–lacZ homozygous female assayed for β-galactosidase activity. Scale bar, 50 μm.
−2000HSA–CAT consists of the promoter of the human skeletal actin (HSA) gene linked to the CAT reporter gene (Brennan and Hardeman 1993). This transgene gives rise to intron-containing and completely processed transcripts that are shown by in situ hybridization to be localized in and around the expressing nucleus. Figure 2B shows an example of −2000HSA–CAT expression after regeneration surgery on the EDL muscle. The fiber shown contains both −2000HSA–CAT-expressing and nonexpressing nuclei. For both muscle-specific transgenes, expressing and nonexpressing nuclei appeared clustered in domains.
The previous examples show that the phenomenon applies to muscle-specific genes and transgenes. It was of interest to examine the expression of a ubiquitously expressed transgene in muscle fibers. HMG–CoA–lacZ consists of the promoter regions of the mouse 3-hydroxy-3-methylglutaryl coenzyme A (HMG CoA) reductase gene linked to a lacZ reporter gene with a nuclear localization signal (Tam and Tan 1992). The transgene is located on the X chromosome and only female mice homozygous for the transgene were analyzed. HMG–CoA reductase is a key enzyme in the cholesterol biosynthesis pathway and is expressed in all tissues. The HMG–CoA–lacZ transgene is expressed in almost all mouse tissues, including skeletal muscle. In regenerating EDL, HMG–CoA–lacZ expression did not occur in all nuclei within a fiber (Fig. 2C). Interestingly, unlike the muscle-specific endogenous genes and transgenes, HMG–CoA–lacZ-expressing and nonexpressing nuclei did not occur in clusters or domains. This may reflect a regulatory distinction between housekeeping gene products and those that are incorporated into muscle architecture.
To determine if tissue sectioning resulted in a loss of nuclear material that could account for diminished gene activity, confocal scanning microscopy was used to visualize successive planes through the myofiber nuclei. Sections of regenerating soleus at day 40 from TnIsUSE–95X1nucZ transgenics were treated with β-galactosidase antibody and propidium iodide (PI) and scanned on a confocal microscope. By comparing confocal scans of the same subset of myonuclei visualized with propidium iodide and β-galactosidase antibody, it was possible to determine whether the whole nucleus was present when β-galactosidase was not detected. The PI signal indicates the presence of nuclear material. Figure 3 shows the middle four slices of a complete scan throughout a set of myonuclei. Figure 3A shows a set of myonuclei visualized with antibody to β-galactosidase, two of which are negative (arrows). PI staining (Fig. 3B) shows that the positive and negative (arrows) nuclei are equivalent. Therefore, we conlcude that β-galactosidase-negative nuclei are negative because of an absence of transgene expression, rather than because of a loss of material occurring during sample preparation or sectioning.
Figure 3.

Confocal scanning microscopy of myofiber nuclei. (a) Four 0.5-μm optical sections from the middle of a complete scan through a regenerating myofiber of a TnIsUSE–95X1nucZ soleus. β-Galactosidase protein was detected using a rhodamine-labeled antibody. Arrows indicate two nonexpressing nuclei. (b) Same subset of myonuclei visualized with propidium iodide. Arrows indicate the same nuclei as in a. The intensity of the PI signal was equivalent in the presence or absence of β-galactosidase indicating that the lack of β-galactosidase was not caused by a lack of nuclear material. Scale bar, 10 μm.
Differential nuclear expression in isolated myofibers
A comparison of myonuclei expresson was made between regenerating and mature, nonmanipulated muscle fibers using isolated, intact myofibers. In each case, fibers were isolated and pooled from six freshly dissected flexor digitorum brevis (FDB) muscles of three TnIsUSE–95X1nucZ mice using a protocol that also removes most of the satellite cells (Bischoff 1986; Carroll et al. 1995; see Materials and Methods). The FDB muscle contains 30% slow/type I fibers as determined by the presence of the slow-fiber isoform of myosin heavy chain, MyHC-β (data not shown). This type of analysis bypasses some complicating aspects of working with sections of regenerating and adult muscle. First, detection of this phenomenon in intact fibers confirms that nonexpressing myonuclei are not an artifact of sectioning. Second, mature muscle nuclei reside at the periphery of the fiber. As the fiber-isolation protocol removes most of the satellite cells from the myofiber, nonexpressing nuclei in the adult can be identified more confidently as being located within the plasma membrane of the myofiber.
Figure 4B shows a typical example of an intact regenerating FDB fiber at 21 days after surgery. Clearly, there are expressing and nonexpressing nuclei within the same fiber, supporting the proposal that the phenomenon occurs generally in muscle. Nuclei expressing muscle-specific genes at this stage of regeneration occur in domains, and are rarely interspersed with single nonexpressing nuclei as evidenced in Figure 4B. A region containing six to seven β-galactosidase-expressing nuclei is flanked by similar-sized regions of nonexpressing nuclei. Active versus inactive domains are not associated with any overt morphological structures either within or external to the fiber. Figure 4A shows a typical example of a mature, nonmanipulated fiber stained for β-galactosidase activity. In contrast, in this mature fiber in which the nuclei are not in close proximity to one another, but rather dispersed at the periphery of the cell, expressing and nonexpressing nuclei are random.
Figure 4.
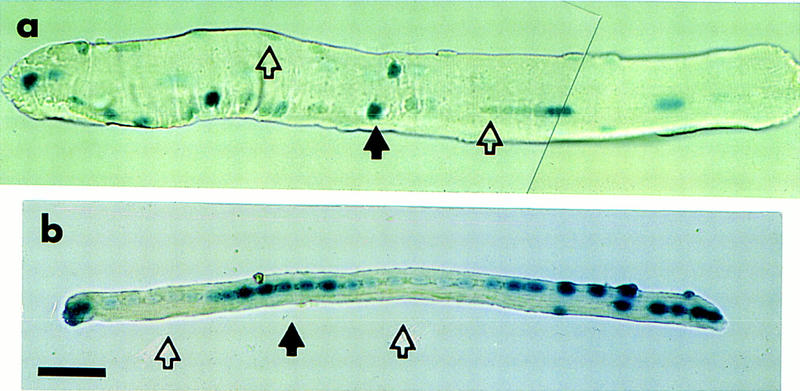
Isolated whole fibers also show heterogeneous gene activity. FDB muscles from TnIsUSE–95X1nucZ adult mice were treated enzymatically to dissociate the myofibers and remove the satellite cells. The isolated fibers were assayed for β-galactosidase-activity. (a) A fiber from a nonnmanipulated FDB muscle. The solid arrow indicates an expressing nucleus; open arrows indicates nonexpressing nuclei. (b) A regenerating fiber from FDB muscle 21 days after surgery. This shows a domain of transgene expression (solid arrow) flanked by domains of transgene inactivity (open arrows). Scale bar, 50 μm.
The proportion of expressing nuclei in a muscle fiber changes during muscle development and regeneration
Muscle fibers are dynamic cells that undergo changes in diameter sizes during periods of growth pre- and postnatally and in response to hormones and innervation status (Ontell and Dunn 1978; Schiaffino and Reggiani 1996). Does the proportion of expressing nuclei in a myofiber reflect its growth status? To address this question, we quantitated the number of expressing nuclei in fetal and adult muscles of TnIsUSE–95X1nucZ transgenics and in a time course of regeneration.
Muscle-fiber formation in utero in rodents occurs in two discrete periods resulting in the formation of primary and secondary fibers (Hauschka 1994). The immature fibers are relatively small in diameter compared with adult fibers. We wanted to determine if the increase in fiber diameter during normal myofiber maturation is accompanied by a change in number of transcriptionally active nuclei. Sections of hind limbs from days post coitum (dpc) 16.5 TnIsUSE–95X1nucZ transgenic fetuses were assayed for β-galactosidase activity. The nuclei in the immature fiber are aligned, which makes the myonuclei easily distinguished from the mononucleated muscle precursor cells. The number of β-galactosidase-positive versus negative nuclei were scored within fibers from the quadriceps (Quad) and tibialis anterior (TA) muscles, and in the isolated adult fibers of the FDB muscle. The protocol for isolation of the FDB fibers removes most or all of the satellite cells, allowing β-galactosidase to be scored from myonuclei only. The number of expressing nuclei per fiber were scored as a percent of the total number of nuclei in the fiber. The results from each muscle type were graphed as separate histograms, shown in Figure 5.
Figure 5.
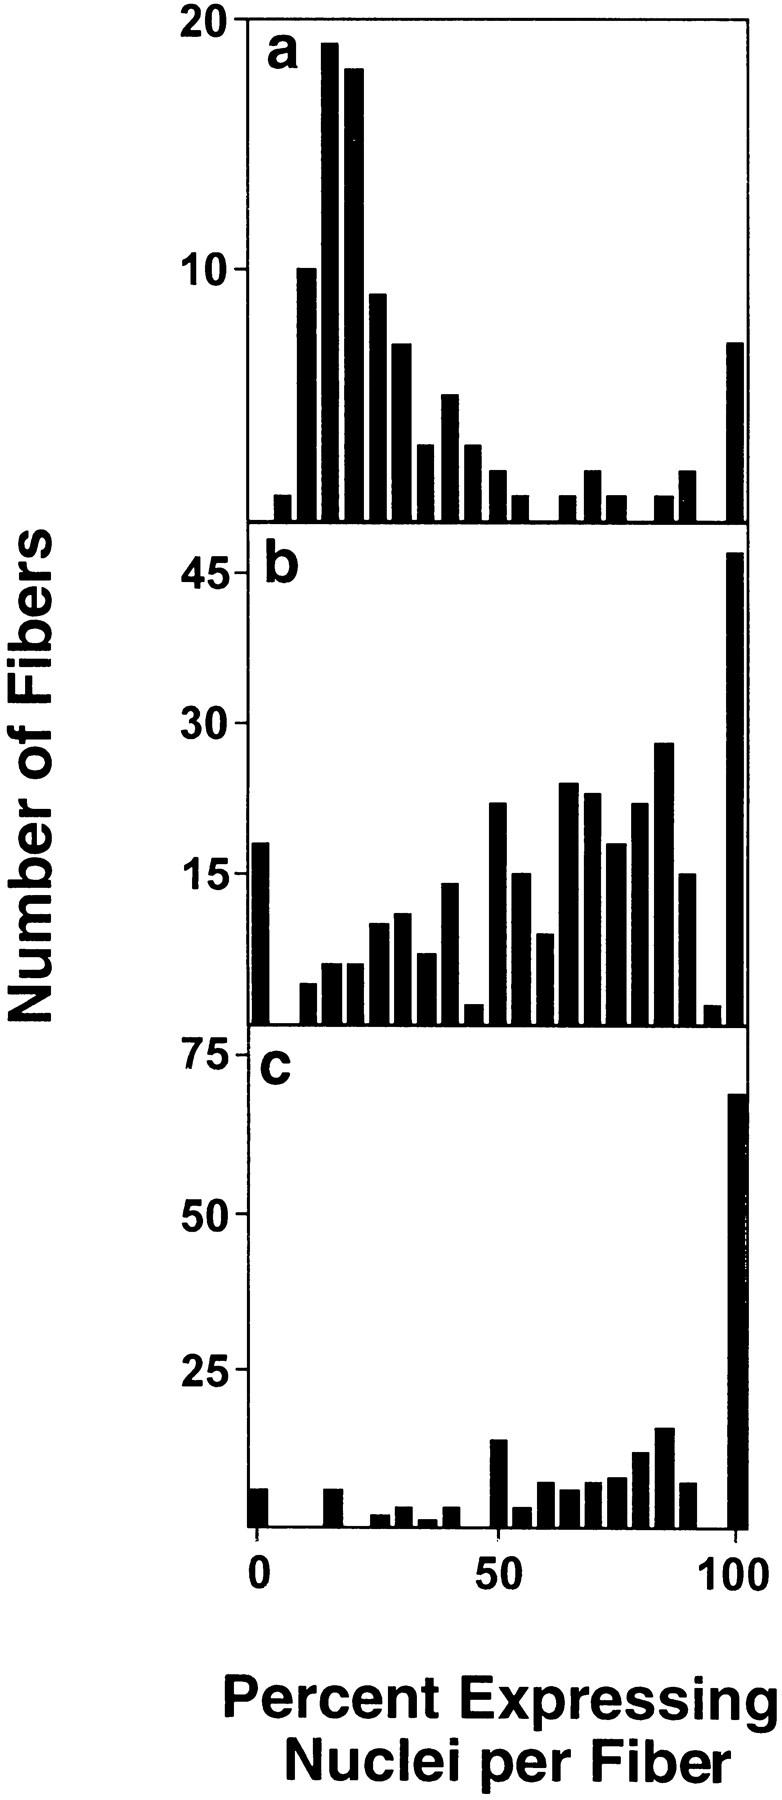
The proportion of expressing myonuclei reflects developmental age in mouse muscles. (a) Isolated fibers from six FDB muscles of three adult TnIsUSE–95X1nucZ mice were scored individually to determine the percentage of β-galactosidase expressing nuclei per fiber. Fibers (98) were scored with an average of 34 nuclei per fiber. Sections of hindlimbs from four dpc 16.5 TnIsUSE–95X1nucZ fetuses were scored for the number of β-galactosidase expressing versus nonexpressing myonuclei per fiber in Quad (b) and TA (c) muscles. Fibers (303) from Quad and 170 fibers from TA were counted with an average of nine nuclei per fiber (minimum of six). The percent values obtained in each sample were grouped into fifth percentile intervals. For each sample, the number of fibers was plotted against the percent of expressing nuclei per fiber.
The results show that at the adult time point, the majority of FDB fibers contain 15%–20% β-galactosidase-expressing nuclei. This is lower than in the fetal time point, in which the majority of the Quad and the TA muscle fibers have >50% of nuclei expressing β-galactosidase. This indicates that there is a developmentally controlled down-regulation of genetic output in the myofibers and it is manifested by a reduction in the proportion of expressing nuclei in a myofiber. The small number of fibers in the adult sample with 95%–100% β-galactosidase expression can be attributed to naturally occurring regenerating fibers. The minor peak at 0%–5% in the dpc 16.5 Quad sample could be due to the maturation of these fibers resulting in the down-regulation of the developmental isoforms, such as TnIs, and the appearance of the mature, fast-twitch isoforms (Sutherland et al. 1993).
In the early stages of regeneration, the fiber has a small diameter approximately the same as that of the nuclei. As the fiber matures, the number of myofibrils increases, leading to an increase in fiber diameter. During this period of rapid growth it is possible that more contractile protein gene loci are recruited and hence these genes are transcribed in more nuclei. To test this possibility, the proportion of nuclei expressing either an endogenous gene or transgene (α-SA or −2000HSA–CAT, respectively) were scored in regenerating EDL muscles at days 15, 21, and 35 after surgery. Eight EDL muscles were analyzed from two separate sets of experimental animals. Figure 6 shows examples of in situ hybridization results from each time point. The number of expressing nuclei per fiber were calculated as a percent of the total number of nuclei in the fiber. This value was averaged over the number of fibers scored at each regeneration time point. A significant decrease in the proportion of expressing nuclei was seen between days 15 and 21 for both α-SA and −2000HSA–CAT loci (from 93% ± 6 to 65% ± 9 and 92% ± 3 to 72% ± 11, respectively, see Table 1). No significant change occurred between days 21 and 35, suggesting that a major growth period has ended by day 21.
Figure 6.
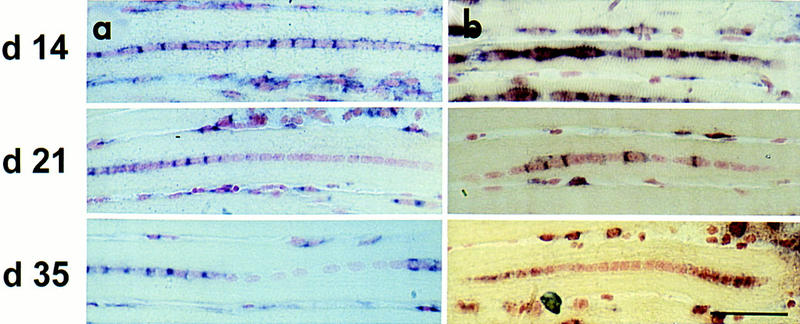
The proportion of expressing nuclei in myofibers changes during regeneration. Regenerating EDL muscles of −2000HSA–CAT transgenics collected at days 14, 21, and 35 after surgery. In situ hybridization (purple staining in and around the nucleus) to α-SA (a) and −2000HSA–CAT mRNA (b) shows a decrease in the proportion of expressing nuclei in a myofiber over the time course of regeneration. Scale bar, 50 μm.
Table 1.
Quantitation of expressing nuclei per fiber during regeneration
|
|
|
Day of regeneration
|
||
|---|---|---|---|---|
| 15
|
21
|
35
|
||
| α-SA | no. of fibers scored | 353 | 243 | 360 |
| average no. of nuclei/fiber scored | 13 | 26 | 22 | |
| average no. of expressing nuclei/fiber ±S.D. | 93% ± 6 | 65% ± 9 | 64% ± 7 | |
| −2000HSA–CAT | no. of fibers scored | 80 | 89 | 77 |
| average no. of nuclei/fiber scored | 11 | 26 | 20 | |
| average no. of expressing nuclei/fiber ±S.D. | 92% ± 3 | 72% ± 11 | 68% ± 15 | |
Nuclei were scored in regenerating EDL muscles from −2000HSA–CAT transgenics. The percentage of expressing nuclei (as determined by in situ hybridization) was calculated for each fiber. This was averaged over the total number of fibers counted.
Myofiber nuclei retain their transcriptional potential
The previous results show that nuclear expression in the myofiber is dynamic. The proportion of transcribing nuclei in a fiber alters during growth periods. This raises the issue of whether any nucleus in a mature fiber is capable of transcription or whether transcriptional activity is restricted to a subpopulation. To investigate this we examined the expression of the splicing factor SC-35 within the myofiber nuclei. SC-35 is an essential non-snRNP component of the spliceosome (Fu and Maniatis 1990) which exists in discrete regions in the nucleus and associates with intron containing pre-mRNAs. Inhibition of transcription with α-amanitin leads to a reduction in the size and number of SC-35 domains within the nucleus (Moen et al. 1995).
The distribution of SC-35 in myonuclei of regenerating soleus from TnIsUSE–95X1nucZ transgenic mice was examined at day 35 after surgery. The presence of β-galactosidase in a nucleus was determined either with an antibody to β-galactosidase or by histochemical enzymatic assay. SC-35 was detected with an antibody provided by X.D. Fu (Fu and Maniatis 1990). Confocal scans of nuclei expressing and not expressing β-galactosidase were examined for both the number and size of SC-35 domains. Nonexpressing nuclei were visualized with propidium iodide (PI). Both the distribution and the size of the SC-35 domains was identical (∼40 loci) in β-galactosidase-expressing and nonexpressing myonuclei (Fig. 7). In contrast, cells adjoining the fibers, possibly satellite cells, contained fewer, smaller, and less intense SC-35-positive loci (data not shown). Our findings suggest that although some nuclei are not expressing a gene of interest, they are nevertheless transcriptionally competent.
Figure 7.
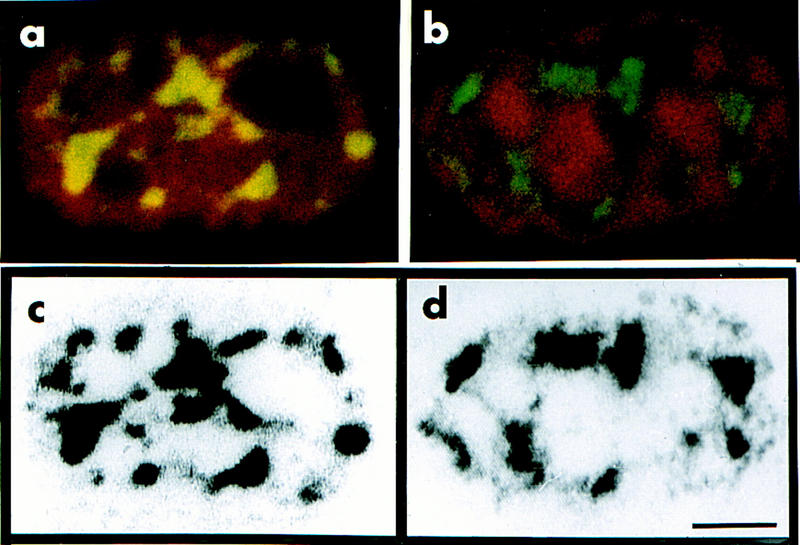
The distribution and abundance of the spliceosome protein, SC-35, is similar in β-galactosidase-expressing and nonexpressing myonuclei. β-Galactosidase and SC-35 were detected with antibodies in regenerating soleus from a TnIsUSE–95X1nucZ mouse. (a,b) Confocal optical scans of myofiber nuclei shown as combined algorithmic images. (a) Nucleus containing β-galactosidase (red) and SC-35 (yellow). (b) β-Galactosidase-negative nucleus (as determined by enzymatic assay—data not shown) containing SC-35 (green). The DNA was visualized with PI (red). (c,d) Black-and-white image of SC-35 distribution in a and b, respectively. A comparison of c and d shows that the distribution and abundance of SC-35 does not appear to differ in the presence or absence of β-galactosidase protein. Scale bar, 5 μm.
Loci are expressed independently in a myofiber
We further examined the transcriptional potential of myofiber nuclei by determining the activity of independent loci simultaneously. β-Galactosidase activity was assayed in myofiber nuclei together with in situ detection of either endogenous α-SA or TnIs transcripts. This dual detection assay was carried out in regenerating fibers at days 21 and 35 from TnIsUSE–95X1nucZ soleus muscle. All possible combinations of endogenous gene and transgene expression were seen at both regeneration time points examined. Examples of the combinations of gene expression are shown in Figure 8. Figure 8A shows a regenerating soleus fiber at day 21 that has nuclei expressing β-galactosidase only and nuclei expressing both α-SA and β-galactosidase. Figure 8B shows an example from regenerating soleus at day 35 that contains nuclei expressing α-SA only. Figure 8C shows an example of a nucleus that is expressing neither of the loci assayed.
Figure 8.
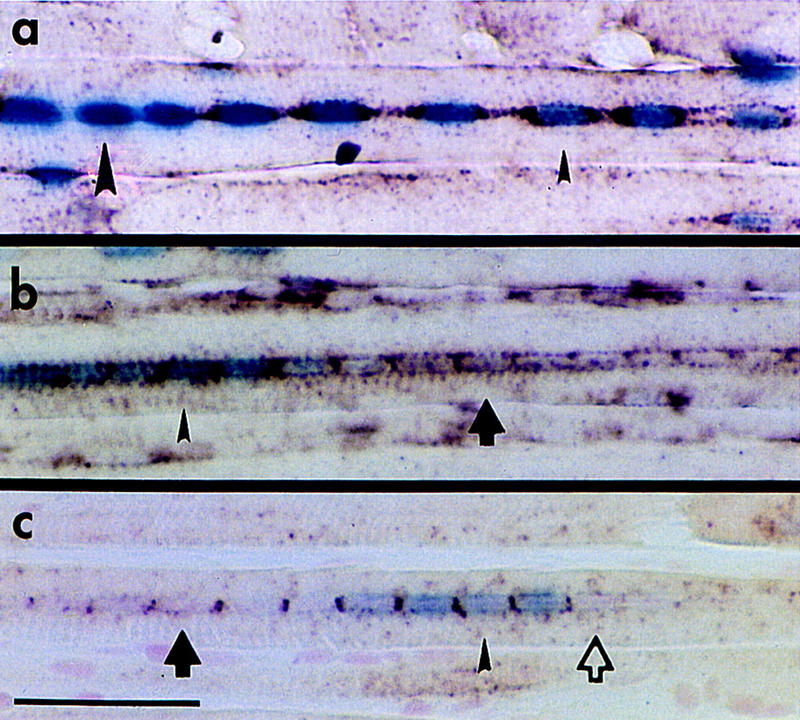
The distribution of active loci appears to be independent. The distribution of an endogenous transcript (α-SA or TnIs) was codetected with the expression of β-galactosidase in TnIsUSE–95X1nucZ regenerating soleus muscles. All combinations of β-galactosidase activity and endogenous gene expression were found in the fibers. (a) A regenerating fiber at 21 days with β-galactosidase activity (blue nuclei) and α-SA transcripts as detected by in situ hybridization (brown staining around the periphery of nuclei). The large arrowhead indicates a nucleus with β-galactosidase activity only; the small arrowhead indicates a nucleus expressing both α-SA transcripts and β-galactosidase. (b) A regenerating fiber at day 35 assayed for α-SA transcripts and β-galactosidase activity. Nucleus expressing α-SA only (arrow), and both α-SA and β-galactosidase (small arrowhead). (c) A regenerating fiber at day 35 assayed for TnIs transcripts and β-galactosidase activity. Nucleus expressing neither β-galactosidase nor TnIs (open arrow), TnIs only (solid arrow), and both TnIs and β-galactosidase (arrowhead). Scale bar, 50 μm.
The results of this double assay were quantified by scoring all combinations of gene expression seen in fibers at 21 days after regeneration surgery. Table 2 shows the frequency of the combinations of expression of α-SA transcript and TnIsUSE–95X1nucZ, and TnIs transcript and TnIsUSE–95X1nucZ. The coincidence of β-galactosidase activity (from the TnIsUSE–95X1nucZ locus) and α-SA transcript was 57% ± 4 (s.e.m.) of nuclei in a fiber. TnIsUSE–95X1nucZ expression alone occurred in 20% ± 4 of nuclei. α-SA transcript was detected alone in 18% ± 3 of nuclei per fiber. Neither locus was expressed in 5% ± 1 of nuclei in a fiber. These combinations of expressing loci were found when endogenous TnIs and TnIsUSE–95X1nucZ expression were assayed in the same section. The frequency of nuclei in a fiber expressing both TnIs and TnIsUSE–95X1nucZ was 49% ± 5. TnIsUSE–95X1nucZ expression alone was seen in 12% ± 3 of nuclei per fiber, whereas TnIs transcripts alone were detected in 27% ± 4. The proportion of nuclei per fiber expressing neither gene was 11% ± 2.
Table 2.
Coexpression frequencies of endogenous gene and transgene expression in the same fiber
| Transgenic locusa/ endogenous locus
|
Locusb
|
Total no. fibers counted
|
Average no. of nuclei per fiber
|
|||
|---|---|---|---|---|---|---|
| +/+
|
+/−
|
−/+
|
−/−
|
|||
| α-SA | 57% ± 4c | 20% ± 4 | 18% ± 3 | 5% ± 1 | 52 | 20 |
| TnIs | 49% ± 5 | 12% ± 3 | 27% ± 4 | 11% ± 2 | 42 | 25 |
Nuclear localized β-galactosidase activity was codetected with either endogenous α-skeletal actin (α-SA) or troponin I slow (TnIs) transcripts in day 21 regenerating soleus muscles of TnIsUSE–95S1nucZ transgenic mice.
TnIsUSE–95X1nucZ transgene.
(+) Expression of this locus (loci); (−) absence of expression of this locus (loci).
Average proportion of nuclei per fiber ± S.E.
These values were used to determine whether or not expression from the transgene locus is independent of expression of the endogenous locus in the fibers. In the case of codetection of α-SA and TnIsUSE–95X1nucZ expression, a total of 77% of all nuclei in a fiber expressed α-SA. This is the sum of the proportion of nuclei only expressing α-SA and α-SA plus TnIsUSE–95X1nucZexpressing nuclei (20% + 57%). The frequency of TnIsUSE–95X1nucZ-expressing nuclei is 75%. If the expression of these two loci within a single nucleus were completely independent, the expected frequency of nuclei expressing both loci is the product of the frequencies of expression of each, i.e. 75% multiplied by 77%. The resulting value of 58% is very close to the observed, which is 57%. Two-by-two tables were used to determine the expected frequencies for all of the combinations of endogenous and transgene expression, using the same method as in the above example (Table 3). This was done for both the α-SA and TnIs results. A comparison of the observed values with the calculated values shows that they are very similar, with the expected frequencies coming close to the observed frequencies. This indicates that the control of gene expression within a myofiber nucleus occurs independently at the level of each locus.
Table 3.
Comparison of observed and expected frequencies show that the two loci are expressed independently in the same fiber
|
|
TnIsUSE–95X1nucZ
|
Total
|
|
|---|---|---|---|
| +
|
−
|
||
| α-SA + | 57 (58) | 20 (19) | 77 |
| − | 18 (17) | 5 (6) | 23 |
| Total | 75 | 25 | |
| TnIs + | 49 (47) | 27 (30) | 76 |
| − | 12 (14) | 11 (9) | 23 |
| Total | 61 | 39 | |
Observed frequencies (boldface type) for each category are taken from Table 2. The expected frequencies (italics) are calculated by multiplying the totals in the same row and column. (+) Expressing nuclei; (−) nonexpressing nuclei. All values are percentages.
Discussion
Our results demonstrate that loci within myofiber nuclei are not transcriptionally equivalent, despite the presence of a common cytoplasm. We have reported the patterns of expression of endogenous genes and transgenes in developing, regenerating and mature muscle fiber syncytia. The endogenous genes encode sarcomeric proteins and the transgene promoters are from sarcomeric or housekeeping gene sequences. The myofibrils, of which the sarcomere is the basic subunit, run the entire length of the myofiber. It is expected that the products, and hence expression of these genes, are required along the length of a muscle fiber. Despite this apparent homogeneity of the myofiber, we detect a proportion of nuclei in myofibers that are not expressing a gene of interest. The simultaneous detection of two gene products within a myofiber indicates that loci are independently expressed within a nucleus. This suggests that a given locus alternates between transcriptional activity and inactivity.
There are examples of localized gene expression in muscle fibers. The transcripts for the α-subunit of the acetylcholine receptor are concentrated at the neuromuscular junction (Merlie and Sanes 1985; Fontaine et al. 1988) and originate from the myonuclei lying directly below this structure (Fontaine and Changeux 1989). Myosin heavy chain (MyHC) transcript accumulates at the myotendinous junctions in stretched muscle fibers (Dix and Eisenberg 1990). In both of these examples, there is a functional reason for the regionalization of gene expression. The acetylcholine receptor is part of the nerve-signaling pathway and therefore only occurs at the neuromuscular junction. The accumulation of MyHC transcripts at the myotendinous junctions probably occurs because this is the site of fiber lengthening after periods of stretch (Dix and Eisenberg 1990). However, the patterns of expression that we observed show no obvious regionalization to specific areas of the muscle fiber and have no apparent relationship to the final distribution of the endogenous gene product.
The number of active loci reflects the maturity of the muscle fiber
The difference in the number of expressing loci in adult and embryonic mouse limbs and in regenerating muscle suggest that there is specific regulation of the proportion of expressing loci in a muscle fiber. The number of expressing loci or nuclei per fiber declines as the muscle matures. At embryonic day 16.5, the percentage of expressing nuclei per fiber is less in upper limb muscles, the Quad (majority of fibers contain between 50%–100% expressing nuclei) compared with a muscle of the lower limb, the TA (majority of fibers contain 100% expressing nuclei) (Fig. 6). This suggests that the upper limb is more developmentally advanced than the lower limb at this stage, possibly requiring less transcriptional output to build the sarcomeres. The transgene TnIsUSE–95X1nucZ used in these experiments is derived from the slow-fiber-specific isoform of the troponin I gene family. Although this isoform is expressed preferentially in all newly formed fibers (Sutherland et al. 1993), upon maturation of the muscle, expression is restricted to slow-twitch fibers (Zhu et al. 1995). There is a more dramatic difference in the number of expressing nuclei between the fetal time points and the adult time point. In the adult, the majority of slow-twitch fibers in the FDB contain less than 50% expressing nuclei.
Quantitation of loci in regenerating tissue of adults (Table 1) also suggests that a regulatory mechanism is dictating the proportion of loci in the fiber that are expressing a gene at a given time. The process of regeneration recapitulates to a significant extent that of myogenesis (Bischoff 1994). During regeneration, new fibers are formed by the fusion of the activated satellite cells. α-SA is expressed in all embryonic, neonatal, and adult fibers (Sassoon et al. 1988). Therefore, the changes seen in the proportion of α-SA-expressing nuclei during regeneration must relate to fiber growth rather than a developmental program of gene expression. We see the largest change in α-SA expression between days 14 and 21 after regeneration surgery. This implies that the greatest demand for protein synthesis, as reflected in transcriptional output, occurs prior to day 21.
All myofiber nuclei are transcriptionally competent
Two lines of evidence indicate that the loci in myofiber nuclei are maintained in a potentially transcriptionally active state. The distribution of the spliceosome protein, SC-35, was used as a marker of transcriptional activity in myonuclei. SC-35 becomes less abundant when transcription is inhibited by α-amanitin (Moen et al. 1995). The distribution of SC-35 was identical regardless of the transcriptional status of the TnIsUSE–95X1nucZ locus. Secondly, an analysis involving the simultaneous detection of TnIsUSE–95X1nucZ transgene activity and endogenous α-SA or TnIs mRNA provides stronger evidence that each locus is capable of independent transcriptional activity. The results demonstrate that two different genes can be expressed in the same or different myonuclei at a given time. These results must be interpreted with some caution since the products detected were transcript and protein. The presence of a long-lived protein such as β-galactosidase may not reflect the status of its transcript. However, the detection of α-SA or TnIs transcript in the absence of β-galactosidase protein supports our proposal that the loci can be activated independently in different myonuclei.
Evidence for heterogeneous loci activity in different tissues
Several mechanisms have been reported that could account for variable expression of loci within cells. Preferential expression of one allele such as monoallelic expression, might explain variable expression of transgenes, however it cannot explain the pattern of expression of the endogenous genes. In other words, monoallelic expression does not provide a mechanism for shutting off both copies of an endogenous gene. It is also an unlikely explanation for the expression of the transgenes used in this study as loci in mice both hemi- and homozygous for the TnIsUSE–95X1nucZ transgene behaved similarly. Variable expression of transgenic loci can be caused by insertion-site effects resulting in position-effect variegation (PEV) (Dobie et al. 1997). Again, it is an unlikely mechanism for our observations. A feature of PEV in transgenics is that the percentage of cells expressing the transgene in a tissue differs among siblings. The same percentage of expressing and nonexpressing loci per fiber was observed in siblings and in four separate lines of TnIsUSE–95X1nucZ mice (data not shown). Finally, the dynamic expression patterns observed during development and regeneration for both muscle-specific genes and transgenes does not fit with a fixed, heritable expression pattern characteristic of PEV.
There are examples in the literature of heterogeneity of gene expression in an apparent uniform cell population in the absence of overt stimulation. When muscle is denervated, the AChR α-subunit transcripts no longer localize to the neuromuscular junction, but are distributed along the entire length of the fiber. However, only ∼10% of the myonuclei express the AChR α-subunit (Fontaine et al. 1988). Nuclear heterogeneity of AChR α-subunit expression is also observed in intermediate motor endplate formation during development and in primary cultures of muscle cells (Fontaine and Changeux 1989).
Several studies in liver and cultured hepatocytes reported a lack of uniform expression of liver-specific genes or transgenes. Kennedy et al. (1995) observed that a liver-specific transgene was only expressed in 10% of hepatocytes from two transgenic lines. These cells appeared to be distributed randomly and the percentage of expressing cells remained constant at different developmental ages. Michaelson (1993) found that an allelic isoform of a liver-specific protein was not expressed in all cells. Lin et al. (1986) reported that a small percentage of hepatocytes express very-low-density apolipoprotein II prior to estrogen stimulation. Estrogen treatment resulted in more expressing cells rather than the elevation of existing expression levels. van Roon et al. (1989) observed that the expression of three enzymes in embryonic hepatocytes, carbamoylphosphate synthetase, phosphoenolpyruvate carboxykinase, and arginase, is uncoordinated. In a finding similar to ours, all combinations of expression of these three enzymes in individual hepatocytes were found. Steroid-hormone treatment resulted in the coordinated expression of the enzymes in all cells.
Ross et al. (1994) reported that only 10% of stably transfected macrophages expressed a construct containing lacZ driven by the HIV-1 long terminal repeat. The percentage of expressing cells remained constant upon subcloning-expressing cells. White et al. (1995) studied the expression of HIV- and hCMV-based constructs in cloned cell lines. They found that basal expression was restricted to a subpopulation of cloned cells and sodium butyrate treatment increased the proportion of expressing cells. Furthermore, preliminary evidence suggested that transcription in unstimulated, resting cells occurred in pulses. Taken together, these examples and our data indicate that loci are not constitutively active, but instead display pulses of transcriptional activity.
Stochastic mechanism of transcriptional activity
The gene-expression patterns reported in the previous examples are consistent with the notion that transcription is a stochastic event. The probability of transcription occurring at a particular locus is influenced by the enhancement of factors interacting with regulatory binding sites. Much of the work in support of this mechanism has been done in cell cultures in which gene activity was determined on a cell-by-cell basis rather than as an average of the entire cell population. Weintraub (1988) suggested that there is a low probability that transcription complexes form on gene promoters, and that enhancers stabilize transcription complexes, thus increasing the likelihood of transcription occurring. Walters et al. (1995) expanded this by proposing an on/off model of transcription: enhancers act to increase the probability but not the rate of transcription.
The on/off model of transcription is supported by the results from Fiering et al. (1990) and Ko et al. (1990) in which the addition of transcriptional activators increased the number of expressing templates in the transfected cell population, but apparently not the rates of transcription from each template. Ross et al. (1994) have theorized that transcription is a stochastically determined event that occurs infrequently and in short pulses. This model suggests that rates of transcription do not change; the number of active templates changes to alter genetic output.
Gene activity in muscle fibers
Our findings indicate that there are at least three phases of transcriptional activity of muscle-specific genes. In periods of rapid fiber growth, such as during development in utero and regeneration in the adult, virtually all loci within a fiber are recruited. A transitional phase occurs during fiber maturation, in which the number of loci active at a given time declines. Here the loci for a particular gene appear to be active or inactive in clusters or domains of nuclei within a myofiber. This may occur because the centrally located myonuclei are adjacent, allowing communication between sets of nuclei and sharing of transcription factor pools. Finally, in a fully mature fiber under normal conditions in the absence of overt stimulation, expression of a locus appears to be random.
The activity of muscle-specific loci in the mature fiber is compatible with a stochastic model of gene expression. Transcriptional output in these skeletal muscle fibers appears to be regulated in part by changing the number of active loci or templates. We propose that the proportion of expressing loci in a fiber is altered by factors that can change the probability of transcription occurring from a template. Physiological signals for fiber growth and regeneration could act to increase the production and/or concentration of transcription factors, thus increasing the chance of transcriptional activation. During the transitional phase of regeneration, where there appear to be domains of active and inactive loci, loci in a domain could be regulated as a single unit because of the close proximity of the nuclei within the fiber. Alternatively, at this stage of fiber growth, the mechanism of regulation of loci is between a stimulated and stochastic state.
This model predicts that loci will be activated independently as chance governs the formation of an active transcription complex. This was shown to be the case in the codetection experiments. The TnIsUSE–95X1nucZ transgene loci and endogenous TnIs loci display independent expression patterns despite shared regulatory regions. What they lack in common is their chromosomal location and perhaps the location within the nucleus governs the availability of specific factors for a particular locus. In conclusion, several different lines of evidence indicate that in a maturing fiber, the activity of a particular muscle locus is transient, that the mechanism of regulation at least in the adult fiber appears to be stochastic, and that transcription occurs in pulses.
Materials and methods
Mice
The transgenic mouse lines have been described previously: TnIsUSE–95X1nucZ (Corin et al. 1995), −2000HSA–CAT (Brennan and Hardeman 1993), HMG–CoA–lacZ (Tam and Tan 1992). Unless stated otherwise, analyses were performed on mice hemizygous for the transgene.
Regeneration surgery
The protocol has been described previously (Esser et al. 1993). Surgery was performed on EDL, soleus or FDB of 2–3 month old mice. Essentially, the muscle was destroyed by injection of the myotoxic drug, marcaine, along the muscle length after isolating the muscle from the vasculature.
In situ hybridization
Fresh frozen tissue was sectioned at 10 μm onto poly-(l)-lysine-coated glass slides. The tissue was fixed in 4% paraformaldehyde preheated to 50°C. Two, 1-min washes in 2× SSC were followed by 5 min in 0.1 m TEA/0.25% acetic anhydride. The tissue was again rinsed twice for 1 min in 2× SSC followed by a 1-min wash in phosphate-buffered saline (PBS). Sections were dehydrated through an ethanol gradient and left to air dry for 1 hr. The slides were prehybridized at 50°C in 1× hybridization mix (Sigma)/50% deionized formamide for 3–4 hr. Riboprobe (50–150 ng per sample) was diluted with an equal amount of formamide, denatured for 30 sec at 95°C, and added to 25 μl of 1× hybridization mix/50% deionized formamide/10% dextran sulfate. Hybridization was carried out overnight at 50°C. The next day sections were washed in 2× SSC/50% formamide then 1× SSC/50% formamide, each at 37°C for 1 hr followed by a wash in 0.5× SSC for 30 min at room temperature. Nonduplex RNA was removed by 20 μg/ml RNase A digestion in 0.5 m NaCl, 1 mm EDTA, 10 mm Tris (pH 7.5) for 30 min at 37°C. Slides were then washed in 0.5× SSC.
To detect bound probe, slides were washed briefly in buffer 1 (15 mm NaCl, 100 mm Tris at pH 7.5) and blocked at room temperature for 30 min in 2% normal sheep serum/0.3% Triton X-100 in buffer 1. Antibody [anti-DIG sheep IgG conjugated to alkaline phosphatase (Boehringer)] was bound overnight at 4°C at 1:1000 in 1% normal sheep serum/0.3% Triton X-100 in buffer 1. Excess antibody was washed off in buffer 1. Bound antibody was detected by color reaction with 4-nitroblue tetrazolium chloride (NBT)/X-phosphate (5-bromo-4-chloro-3-indolyl-phosphate) (Boehringer DIG detection kit) in 10 mm NaCl, 50 mm MgCl2, 100 mm Tris (pH 9.5) at room temperature or 37°C until sufficient color had developed. The reaction was stopped by rinsing the slides in 2 mm EDTA, 100 mm Tris (pH 8.0). Slides were stained with nuclear fast red (Vector), dehydrated, and mounted in Canada Balsam (BDH, Gurr).
Generation of DIG-labeled riboprobes
The Boehringer Mannheim DIG RNA Labeling Kit was used. All probes were generated from EcoRI or HindIII linearized plasmids using T7 (Boehringer) or T3 (Promega) RNA polymerase. The α-SA probe was generated from a clone of the 5′ end of the mouse α-SA gene containing 58 bp of the 5′ UTR and 57 bp of the first intron in pBluescriptKS(+) (Sassoon et al. 1988). A 250 bp riboprobe for CAT mRNA was generated from a clone of the 5′ end of CAT in pBluescriptSK(+) (Zhu et al. 1995). The TnIs probe was synthesized from a clone containing 217 bp of the amino-terminal region of the mouse TnIs mRNA in pBluescriptSK(+) (Zhu et al. 1995).
Tissue collection and β-galactosidase assay
Tissue was either freshly frozen in cold isopentane immediately after collection or freshly fixed in 2% paraformaldehyde (PFA) in PBS for 7 min at room temperature, rinsed, perfused overnight with 25% sucrose in PBS, then frozen as above. Tissue was sectioned at 6–10 μm and fixed in 2% PFA in PBS or 0.25% glutaraldehyde in 43 mm K2HPO4, 9.5 mm NaH2PO4, 125 mm NaCl for 3 min at room temperature. After fixation, sections were rinsed in PBS then incubated at 37°C in 1 mg/ml X-gal (5-bromo-4-chloro-3-indolyl β-d-galactoside), 5 mm potassium ferricyanide, 5 mm potassium ferrocyanide, 2 mm MgCl2, 0.02% NP-40 in PBS. When sufficient color had developed, the reaction was stopped by rinsing in PBS.
Isolation and β-galactosidase assay of single muscle fibers
The fibers of the FDB muscle were dissociated enzymatically by adapting the protocols of Carroll et al. (1995) and Bischoff (1986). The intact muscle was incubated in 1.5 mg/ml of unfractionated collagenase (Sigma, type IA) in Ringer’s solution (154 mm NaCl, 3.3 mm KCl, 2.7 mm CaCl2, 6 mm NaHCO3, 5.6 mm glucose at pH 7.4) with gentle rocking for 3 hr at 37°C. The muscle was rinsed three times for 5 min each in Ringer’s solution at room temperature. Fibers were dissociated by gentle trituration in Ringer’s solution with a wide-mouth pipette. Satellite cells were removed by trypsinization (0.125%, Sigma) in Ringer’s solution for 10 min at 37°C. The fibers were then sedimented three times through Ringer’s solution in 10-ml tubes. This separates the majority of the mononucleated cells from the fibers, as the fibers sediment at a faster rate. The fibers were then fixed for 5 min in 2% PFA in PBS at room temperature, washed in PBS, stained in X-gal (1 mg/ml) for 1 hr at 37°C, washed in PBS, and wet mounted for light microscopy.
Immunohistochemistry
SC-35 was detected using a modified protocol of Fu and Maniatis (1990). The soleus muscle was freshly fixed in paraformaldehyde and sucrose embedded as described above. Anti-SC-35 (a gift from X.D. Fu) was diluted 1:50 in blocking solution (20% fetal calf serum/0.5% Tween-20 in PBS) and incubated overnight at 4°C. After washing in PBS, primary antibody was detected with a FITC-conjugated goat anti-mouse IgG diluted 1:50 (Jackson Immunoresearch Labs) in blocking solution for 1 hr at room temperature. β-Galactosidase antibody (Cappel) was diluted 1:250 in blocking solution (1% bovine serum albumin, 0.5% cold-water fish-skin gelatin, 2% donkey serum, 0.1% triton X-100) and incubated 30 min at 37°C. After washing three times (1% milk powder, 0.1% Triton X-100 in PBS) then twice in PBT (0.1% Triton X-100 in PBS), slides were incubated with rhodamine-conjugated donkey anti-rabbit IgG (Jackson Immunoresearch Laboratories) diluted 1:100 in blocking solution for 1 hr at room temperature. Where necessary, nuclei were counterstained with propidium iodide (5 mg/ml in PBS). Slides were mounted in 80% glycerol, 20% PBS, 2.5% DABCO (Sigma) for fluorescence microscopy.
Combination of β-galactosidase assay with in situ hybridization
Tissue was collected and sectioned as described previously, fixed at room temperature in 4% PFA in PBS for 5 or 8 min, rinsed 5 min in PBS, stained with X-gal (1 mg/ml), then fixed again and treated for in situ hybridization, using the same protocol as described previously.
Acknowledgments
We thank P. Rowe for his support and encouragement, E. Whitelaw, D. Martin, S. Hauschka, P. Gunning, D. Spector, S. Hughes, and G. Lyons for their helpful advice and comments, and X.-D. Fu for providing the SC-35 antibody. We appreciate the interest and information provided by T. Robertson. We are grateful to J. Joya and the CMRI Animal Facility under the direction of L. Ferrara for providing the transgenic mice. This work was supported by grants from the National Health and Medical Research Council of Australia to E.C.H and the National Science Foundation (DCB-9020998), the Muscular Dystrophy Association, and the American Heart Association to R.P.W.
The publication costs of this article were defrayed in part by payment of page charges. This article must therefore be hereby marked ‘advertisement’ in accordance with 18 USC section 1734 solely to indicate this fact.
Footnotes
E-MAIL ehardeman@cmri.usyd.edu.au; FAX 61-2-9687-2120.
References
- Bischoff R. Proliferation of muscle satellite cells on intact myofibers in culture. Dev Biol. 1986;115:129–139. doi: 10.1016/0012-1606(86)90234-4. [DOI] [PubMed] [Google Scholar]
- ————— . The satellite cell and muscle regeneration. In: Engel AG, Franzini-Armstrong C, editors. Myology. New York, NY: McGraw Hill; 1994. pp. 97–118. [Google Scholar]
- Brennan KJ, Hardeman EC. Quantitative analysis of the human alpha-skeletal actin gene in transgenic mice. J Biol Chem. 1993;268:719–725. [PubMed] [Google Scholar]
- Carroll SL, Klein MG, Schneider MF. Calcium transients in intact rat skeletal muscle fibers in agarose gel. Am J Physiol. 1995;269:C28–C34. doi: 10.1152/ajpcell.1995.269.1.C28. [DOI] [PubMed] [Google Scholar]
- Corin SJ, Levitt LK, O’Mahoney JV, Joya JE, Hardeman EC, Wade R. Delineation of a slow-twitch-myofiber-specific transcriptional element by using in vivo somatic gene transfer. Proc Natl Acad Sci. 1995;92:6185–6189. doi: 10.1073/pnas.92.13.6185. [DOI] [PMC free article] [PubMed] [Google Scholar]
- Craig R. The structure of the contractile filaments. In: Engel AG, Franzini-Armstrong C, editors. Myology. New York, NY: McGraw-Hill; 1994. pp. 134–175. [Google Scholar]
- Dix DJ, Eisenberg BR. Myosin mRNA accumulation and myofibrillogenesis at the myotendinous junction of stretched muscle fibers. J Cell Biol. 1990;111:1885–1894. doi: 10.1083/jcb.111.5.1885. [DOI] [PMC free article] [PubMed] [Google Scholar]
- Dobie K, Mehtali M, McClenaghan M, Lathe R. Variegated gene expression in mice. Trends Genet. 1997;13:127–130. doi: 10.1016/s0168-9525(97)01097-4. [DOI] [PubMed] [Google Scholar]
- Esser K, Gunning P, Hardeman E. Nerve-dependent and -independent patterns of mRNA expression in regenerating skeletal muscle. Dev Biol. 1993;159:173–183. doi: 10.1006/dbio.1993.1231. [DOI] [PubMed] [Google Scholar]
- Fiering S, Northrop JP, Nolan GP, Mattila PS, Crabtree GR, Herzenberg LA. Single cell assay of a transcription factor reveals a threshold in transcription activated by signals emanating from the T-cell antigen receptor. Genes & Dev. 1990;4:1823–1834. doi: 10.1101/gad.4.10.1823. [DOI] [PubMed] [Google Scholar]
- Fontaine B, Changeux J-P. Localization of nicotinic acetylcholine receptor α-subunit transcripts during myogenesis and motor endplate development in the chick. J Cell Biol. 1989;108:1025–1037. doi: 10.1083/jcb.108.3.1025. [DOI] [PMC free article] [PubMed] [Google Scholar]
- Fontaine B, Sassoon D, Buckingham M, Changeux J-P. Detection of the nicotinic acetylcholine receptor α-subunit mRNA by in situ hybridizaton at neuromuscular junctions of 15-day-old chick striated muscle. EMBO J. 1988;7:603–609. doi: 10.1002/j.1460-2075.1988.tb02853.x. [DOI] [PMC free article] [PubMed] [Google Scholar]
- Franzini-Armstrong C, Fischman DA. Morphogenesis of skeletal muscle fibers. In: Engel AG, Franzini-Armstrong C, editors. Myology. New York, NY: McGraw-Hill; 1994. pp. 74–96. [Google Scholar]
- Fu XD, Maniatis T. Factor required for mammalian spliceosome assembly is localized to discrete regions in the nucleus. Nature. 1990;343:437–441. doi: 10.1038/343437a0. [DOI] [PubMed] [Google Scholar]
- Hauschka SD. The embryonic origin of muscle. In: Engel AG, Franzini-Armstrong C, editors. Myology. New York, NY: McGraw-Hill; 1994. pp. 3–73. [Google Scholar]
- Kennedy S, Rettinger S, Flye MW, Ponder KP. Experiments in transgenic mice show that hepatocytes are the source for postnatal liver growth and do not stream. Hepatology. 1995;22:160–168. [PubMed] [Google Scholar]
- Ko MS, Nakauchi H, Takahashi N. The dose dependence of glucocorticoid-inducible gene expression results from changes in the number of transcriptionally active templates. EMBO J. 1990;9:2835–2842. doi: 10.1002/j.1460-2075.1990.tb07472.x. [DOI] [PMC free article] [PubMed] [Google Scholar]
- Lin C-T, Palmer W, Wu J-Y, Chan L. Estrogen induction of very low density apolipoprotein II synthesis, a major avian liver yolk protein, involves the recruitment of hepatocytes. Endocrinology. 1986;118:538–544. doi: 10.1210/endo-118-2-538. [DOI] [PubMed] [Google Scholar]
- Merlie JP, Sanes JR. Concentration of acetylcholine receptor mRNA in synaptic regions of adult muscle fibres. Nature. 1985;317:66–68. doi: 10.1038/317066a0. [DOI] [PubMed] [Google Scholar]
- Michaelson J. Cellular selection in the genesis of multicellular organization. Lab Invest. 1993;69:136–151. [PubMed] [Google Scholar]
- Moen PT, Jr, Smith KP, Lawrence JB. Compartmentalization of specific pre-mRNA metabolism: An emerging view. Hum Mol Genet. 1995;4:1779–1789. doi: 10.1093/hmg/4.suppl_1.1779. [DOI] [PubMed] [Google Scholar]
- Ontell M, Dunn RF. Neonatal muscle growth: A quantitative study. Am J Anat. 1978;152:539–556. doi: 10.1002/aja.1001520408. [DOI] [PubMed] [Google Scholar]
- Ross IL, Browne CM, Hume DA. Transcription of individual genes in eukaryotic cells occurs randomly and infrequently. Immunol Cell Biol. 1994;72:177–185. doi: 10.1038/icb.1994.26. [DOI] [PubMed] [Google Scholar]
- Sassoon DA, Garner I, Buckingham M. Transcripts of alpha-cardiac and alpha-skeletal actins are early markers for myogenesis in the mouse embryo. Development. 1988;104:155–164. doi: 10.1242/dev.104.1.155. [DOI] [PubMed] [Google Scholar]
- Schiaffino S, Reggiani C. Molecular diversity of myofibrillar proteins: Gene regulation and functional significance. Physiol Rev. 1996;76:371–423. doi: 10.1152/physrev.1996.76.2.371. [DOI] [PubMed] [Google Scholar]
- Schmalbruch H. Muscle fibre types in mammalian muscles. In: Oksche A, Vollrath L, editors. Handbook of microscopic anatomy: Skeletal muscle. Berlin, Germany: Springer-Verlag; 1985. pp. 159–204. [Google Scholar]
- Schneider JW, Gu W, Mahdavi V, Nadal-Ginard B. Reversal of terminal differentiation mediated by p107 in Rb−/− muscle cells. Science. 1994;264:1464–1471. doi: 10.1126/science.8197461. [DOI] [PubMed] [Google Scholar]
- Sutherland CJ, Esser KA, Elsom VL, Gordon ML, Hardeman EC. Identification of a program of contractile protein gene expression initiated upon skeletal muscle differentiation. Dev Dyn. 1993;196:25–36. doi: 10.1002/aja.1001960104. [DOI] [PubMed] [Google Scholar]
- Tam PP, Tan SS. The somitogenetic potential of cells in the primitive streak and the tail bud of the organogenesis-stage mouse embryo. Development. 1992;115:703–715. doi: 10.1242/dev.115.3.703. [DOI] [PubMed] [Google Scholar]
- van Roon MA, Aten JA, van Oven CH, Charles R, Lamers WH. The initiation of hepatocyte-specific gene expression within embryonic hepatocytes is a stochastic event. Dev Biol. 1989;136:508–516. doi: 10.1016/0012-1606(89)90276-5. [DOI] [PubMed] [Google Scholar]
- Walters MC, Fiering S, Eidemiller J, Magis W, Groudine M, Martin DI. Enhancers increase the probability but not the level of gene expression. Proc Natl Acad Sci. 1995;92:7125–7129. doi: 10.1073/pnas.92.15.7125. [DOI] [PMC free article] [PubMed] [Google Scholar]
- Weintraub H. Formation of stable transcription complexes as assayed by analysis of individual templates. Proc Natl Acad Sci. 1988;85:5819–5823. doi: 10.1073/pnas.85.16.5819. [DOI] [PMC free article] [PubMed] [Google Scholar]
- White MRH, Masuko M, Amet L, Elliott G, Braddock M, Kingsman AJ, Kingsman SM. Real-time analysis of the transcriptional regulation of HIV and hCMV promoters in single mammalian cells. J Cell Sci. 1995;108:441–455. doi: 10.1242/jcs.108.2.441. [DOI] [PubMed] [Google Scholar]
- Zhu L, Lyons GE, Juhasz O, Joya JE, Hardeman EC, Wade R. Developmental regulation of troponin I isoform genes in striated muscles of transgenic mice. Dev Biol. 1995;169:487–503. doi: 10.1006/dbio.1995.1163. [DOI] [PubMed] [Google Scholar]