Abstract
We developed a generalized framework for multiplexed resequencing of targeted regions of the human genome on the Illumina Genome Analyzer using degenerate indexed DNA sequence barcodes ligated to fragmented DNA prior to sequencing. Using this method, the DNA of multiple HapMap individuals was simultaneously sequenced at several ENCODE (ENCyclopedia of DNA Elements) regions. We then evaluated the use of Bayes factors for discovering and genotyping polymorphisms from aligned sequenced reads. If we required that predicted polymorphisms be either previously identified by dbSNP or be visually evident upon reinspection of archived ENCODE traces, we observed a false-positive rate of 11.3% using strict thresholds (Ks>1,000) for predicting variants and 69.6% for lax thresholds (Ks>10). Conversely, false-negative rates ranged from 10.8% to 90.8%, with those at stricter cut-offs occurring at lower coverage (< 10 aligned reads). These results suggest that >90% of genetic variants are discoverable using multiplexed sequencing provided sufficient coverage at the polymorphic base.
Introduction
Genome-wide association (GWA), candidate gene, and linkage studies have identified thousands of moderately sized genomic regions that are associated with human disease but where comprehensive resequencing is needed to identify the genetic variant causing the association. In particular, GWA studies have identified hundreds of disease-associated haplotypes, typically spanning 5 to 100kb1–3. A logical next step is to identify and resequence all genetic variants within the associated haplotype in order to identify the functional variants among the many non-functional evolutionarily linked neighboring polymorphisms. Next-generation DNA sequencing technologies are in principle well-suited to this task due to their capabilities for high-throughput low-cost sequencing. While these technologies offer massive sequencing capacity, it is still difficult, time-consuming, and/or expensive to resequence large numbers of samples across moderately sized genomic regions (5kb-1Mb).
Simultaneous resequencing of large numbers of individuals for a targeted region is possible by bar-coding or indexing the reads from each individual with a short identifying oligonucleotide4–7. While indexing has the obvious benefit of multiplexing samples within a run, DNA indexing offers two key additional advantages: direct measure of base-by-base error rate and reduction of array-to-array or day-to-day variability. Previous pioneering efforts to develop DNA indexing have shown considerable promise, however adoption is still in its infancy and considerable challenges remain, including the development of practical and cost-effective approaches for short-read platforms. Beyond these experimental challenges, there exist few analytical frameworks that are characterized for discovering and genotyping genetic variants across a targeted interval using multiplexed short-read sequence data from multiple individuals.
In this manuscript we report an experimental and analytical approach for simultaneous sequencing of multiple individuals using DNA indexes on the Illumina Genome Analyzer (GA). We use a degenerate six-base index to evaluate optimal index size and we assess performance of the method by resequencing HapMap individuals across ENCODE regions that have previously been capillary sequenced. We develop a Bayesian analytical framework that leverages the inherent ability of indexing to measure error and to reflect variability in sequencing coverage.
Results
Experimental Design
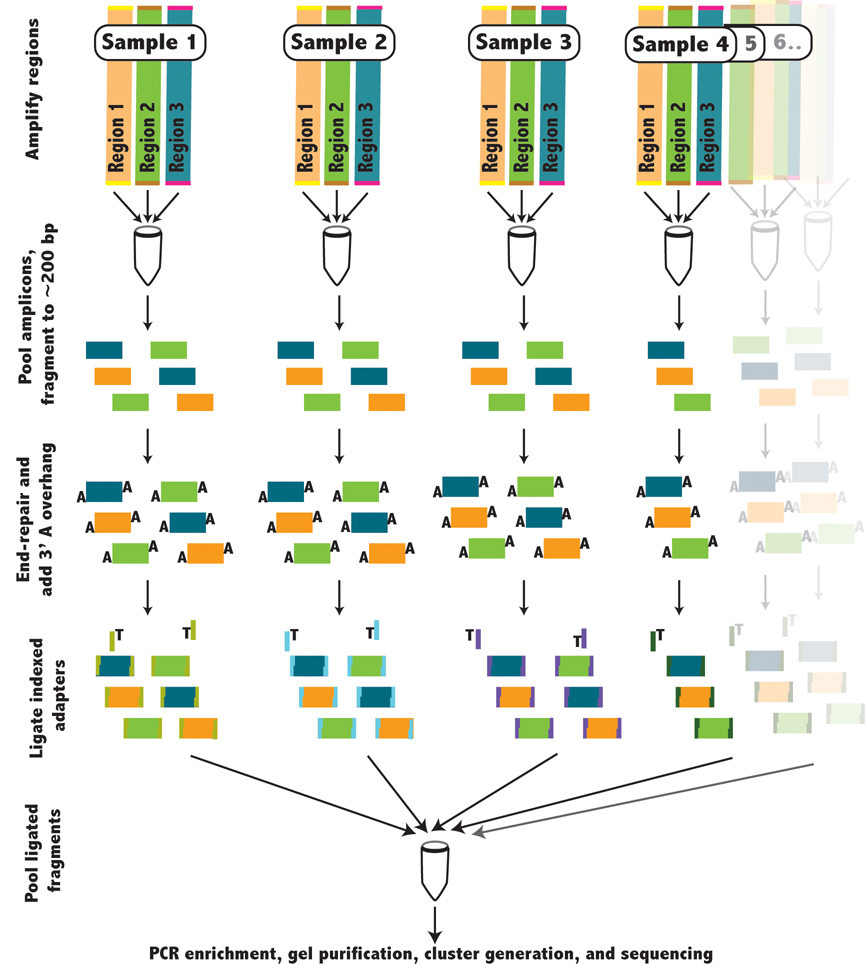
Our experimental protocol for indexing is summarized in figure 1 and further detailed in the supplementary methods. We amplified multiple 5kb regions (supplementary table 1 and 2) by long-range PCR, for 46 individuals genotyped by the ENCODE projects1,8. Amplicons were equimolar pooled for each individual, digested, blunt end-repaired, flanked by an adenosine overhang, and ligated to one of the 46 indexed adapters (supplementary table 3 and 4). Following ligation, samples from all individuals were pooled into a single sample (referred to as an indexed library), purified, enriched by PCR, and sequenced on the Illumina GA on a single lane of an 8 lane flow-cell. We prepared two libraries, Library A, consisting of 10 5kb amplicons covering 50 kb, and Library B, consisting of 14 5kb amplicons covering 70kb (supplementary table 2). Library A contains both regions that were previously capillary sequenced and regions that were not sequenced within the ENCODE project, whereas Library B contains only regions previously sequenced within the ENCODE project.
Figure 1.
Schematic describing the preparation of indexed libraries. The red box indicates the indexing step, where for each person a unique indexed adapter was ligated to the fragmented genomic DNA.
Index Design
We used a six-base design, which allows us to control, tolerate, and measure error during base-calling of the index. The six-base index provides substantial degeneracy: only 46 of the 4096 possible nucleotide combinations were utilized (see supplementary table 4 for indexes). Moreover, indexes were chosen so that 1, and in some cases 2, sequencing errors could be tolerated without an index being incorrectly identified as being a different valid index. While not implemented in this study, utilizing each of the four nucleotides within an index may provide for higher accuracy base-calling since each base would have to be correctly called at least once within a sequenced read.
Using this design strategy, 48 of the 4096 possible 6-mers were synthesized and used as indexes for multiplexed sequencing. Perfect alignment of any index should occur at ~0.1% by chance. The 6th base of the index was an obligate thymidine necessary for ligation of the adenosine overhang. The first and fifth bases were identical to detect biases during normalization and calculation of the deconvolution matrix. In practice, we used 46 of the 48 indexes to allow for plate layouts that included positive and negative controls.
Index Performance
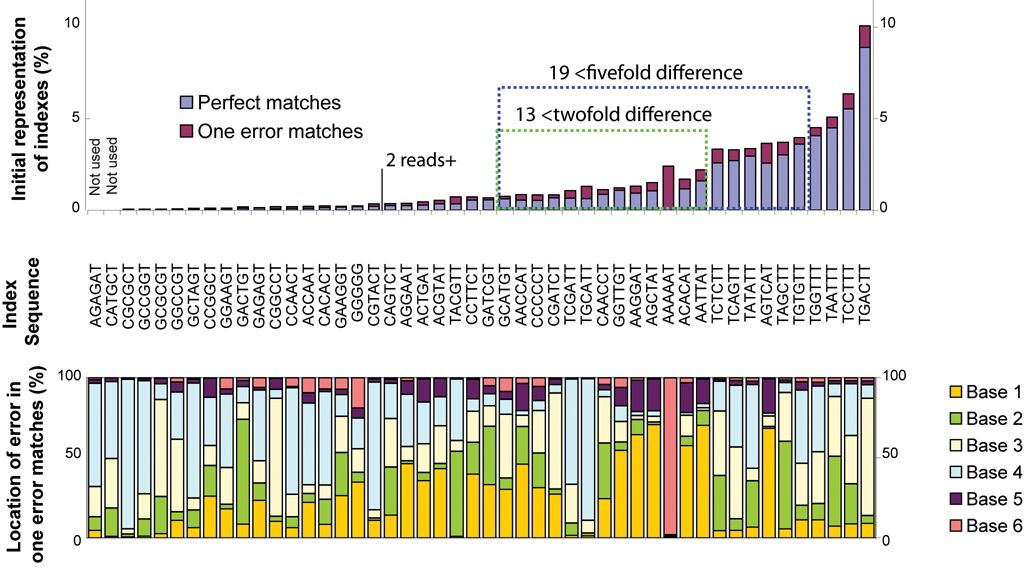
Typically, 3–10 million short-read (32 or 42 base) sequences were generated for each lane of an 8-lane flow cell, though early sequencing runs exhibited greater variability in the number of sequenced reads. After filtering using Illumina analysis pipeline defaults, approximately 45–50% of the reads remained. We observed a large spread in the number of counts per index (figure 2). Although a systematic reason for the initial spread in index performance was not identified, weaknesses in index design were obvious in some cases. For example, ‘AAAAAT’ which was frequently read as ‘AAAAAAT’, perhaps due to an oligonucleotide synthesis bias. A few indexes that were not well represented were complementary to other sections of the adapter sequence, possibly hindering adapter formation. Resequencing the same library gave nearly the identical distribution of reads regardless of run performance, indicating that the distribution is likely not due to a post-PCR enrichment step. Furthermore, recreating libraries and sequencing different individuals in additional sequencing runs did not substantially alter performance for indexes that were substantially under-represented or over-represented. Of the 46 initial indexes, 19 indexes varied by less than a factor of 5 between the most and least common index and 13 indexes varying by less than a factor of 2. While some of the initial index variability was consistent between sequencing runs, retrospective analysis of gel images suggests that a portion of the index variance may be due to subtle differences in DNAse digestion of pooled amplicons, whereby the number of available ligation targets is higher for samples that are digested with higher efficiency. In runs subsequent to these initial libraries (data not shown), we observed that using gel-images of the PCR-enriched products or qPCR, to quantify the ligated adapter prior to pooling, reduced index variability such that the best covered index was observed 5-fold more frequently than the least covered index. By comparison the same ratio was 11-fold without quantification of the ligated primers prior to pooling. While future studies may improve index variability still further, it may be effectively managed without substantially affecting workflow, by requiring higher average coverage within a study, by sequencing on two lanes with different indexes, or by sequestering samples with deficient coverage for later runs.
Figure 2. Comparison of index performance.
Index variability in initial sequencing runs (Library A) used for evaluating index performance are shown (top graph). Percentages of reads aligning to the reference sequence are listed by index, without introduction of normalization methods. A total of 30 indexes were present in >0.05% of all aligned reads. Highlighted in the blue box are 19 indexes with less than 5 fold difference in index frequencies, used in subsequence studies. Indexes matching with 0 errors are in blue bars and indexes with 1 error are in magenta bars. The bottom graph shows the location of errors by base, for each index.
Index-level coverage
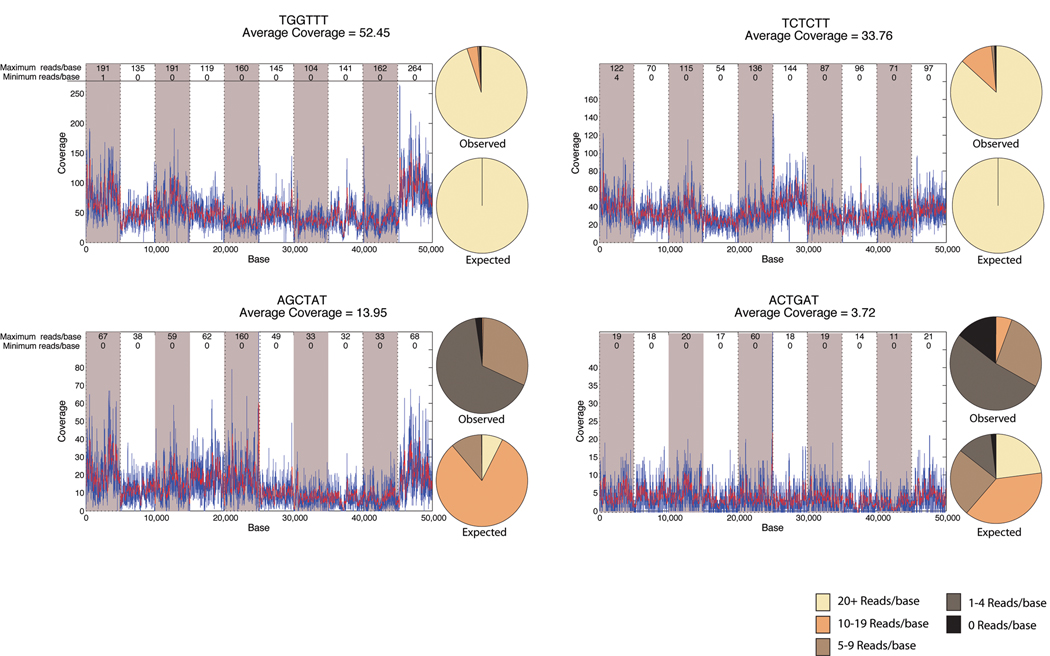
As shown for a subset of library A, coverage across individual 5kb amplicons was even and generally free of large gaps (figure 3). We did observe base-to-base variability in the coverage, as expected from alignment of short reads. Both between amplicons and within an amplicon, some deviation from the expected Poisson distribution was observed. Clearly amplicon-to-amplicon variability contributes to some extent to the departure from the expected Poisson distribution. For a given index, we observed approximately a 1.5 to 2.0 fold difference between the amplicons with the most and fewest number of reads. Inspecting gel images for selected amplicons confirmed that these observed differences within regions were largely due to uneven pooling of amplicons. The observed amplicon-to-amplicon variability is likely to be due to the fact that we utilized median concentrations across the plate when pooling amplicons for an individual, rather than individually pipetting each amplicon based on its specific concentration.
Figure 3. Relationship between mean and local coverage.
Example coverage of 4 individuals sequenced within a single line of an 8-lane flow-cell for 10 pooled amplicons as part of Library A. Amplicons are shown consecutively for each individual by the alternating shaded background. Index sequence and mean coverage for that individual are shown above each graph. The maximum and minimum coverage is shown for each amplicon in the top of the graph. Overlaying pie charts show the observed distribution of bases across all amplicons and the expected distribution determined from a Poisson distribution of the mean coverage, binned by 0 reads, 1–4 reads, 5–9 reads, 10–19 reads, and >20 reads.
Comparing a given amplicon across indexes (i.e. across individuals), there is clearly some base-level correlation in coverage based on the positions of spikes and valleys within the coverage plots (figure 3). Within a single amplicon there was also departure from a Poisson distribution, evident from the fact that the same bases had little or no coverage across individuals. Indeed, there is consistency between individuals with regard to bases that are under or over-represented. The rank correlation coefficient between indexes at a given base averaged 0.408, suggesting that local sequence (or base order) accounts for slightly less than half of the base-to-base variability in coverage.
Error reduction/Alignment strategy
Depending on alignment rules, aligning a short read to a reference sequence reduces the sequencing error rate at the cost of limiting discovery. We aligned 35-base pair sequences, allowing for only a single error. We are thus essentially limited to identifying single base substitutions in an aligned read, while limiting error to 1/35 or 2.8% as explained below. We further required that two stretches of 11 or more consecutive bases match the reference sequence or that the read have at least one stretch of 15 consecutive matches to the reference sequence. In both cases, our aligner required that the final 2 bases match the reference sequence to insure we did not over-align an error at the final base. The rules for alignment were largely chosen to control error, and would falsely align a randomly generated sequence in less than 0.1% of alignments in a 100kb region. Given our tolerance for 1 error in alignment, we expect a maximum per-base error rate of 2-3% (1 error in 35bases ≈ 2.8%).
Alignment of short-reads has advantages. For example, one would expect that we would have greater difficulty detecting closely neighboring single nucleotide polymorphisms (SNPs) since we mostly limit our aligner to 1 non-consecutive mismatch. However, the short-reads stochastically overlap and these various types of neighboring genetic variants are observed by alignment of multiple sequences not spanning both variants.
Polymorphism discovery
Polymorphism discovery is a primary goal for resequencing an association interval for a GWA study, particularly under the common variant hypothesis. Indeed, in some cases one may only wish to know which bases are polymorphic for custom-genotyping on a separate platform.
We first provide an intuitive explanation of our analysis approach for polymorphism discovery, noting that detailed equations are provided in the methods. We utilized a Bayes factors to compare the probability that the distribution of mismatched bases arises from sequencing error to the probability that the distribution of mismatches arises from diploid polymorphism. For example, if 20% of reads for a given base were non-concordant with the reference sequence across all individuals, and the non-concordant bases were due to the presence of a SNP, one would expect each individual to be homozygous (0% or 100% concordance with reference) or heterozygous (concordance split 50/50). On the other hand, if the 20% non-concordant bases were due to sequencing error, then the number of non-concordant bases for each individual would follow a binomial distribution around 20% (e.g. person 1~20.5%, person 2~19.3%, person 3~20.7%, etc). As described below, the error estimates required to calculate the probability of a genetic variant being a true variant are readily obtainable when individuals are indexed and multiplex-sequenced. Further, indexed and multiplexed sequencing removes run-to-run biases which would confound these estimates if all aspects of experimental design were not properly randomized. Bayes factors are particularly effective for the uneven coverage inherent to short read sequencing, and provide a mechanism to control false positives in light of more or less evidence.
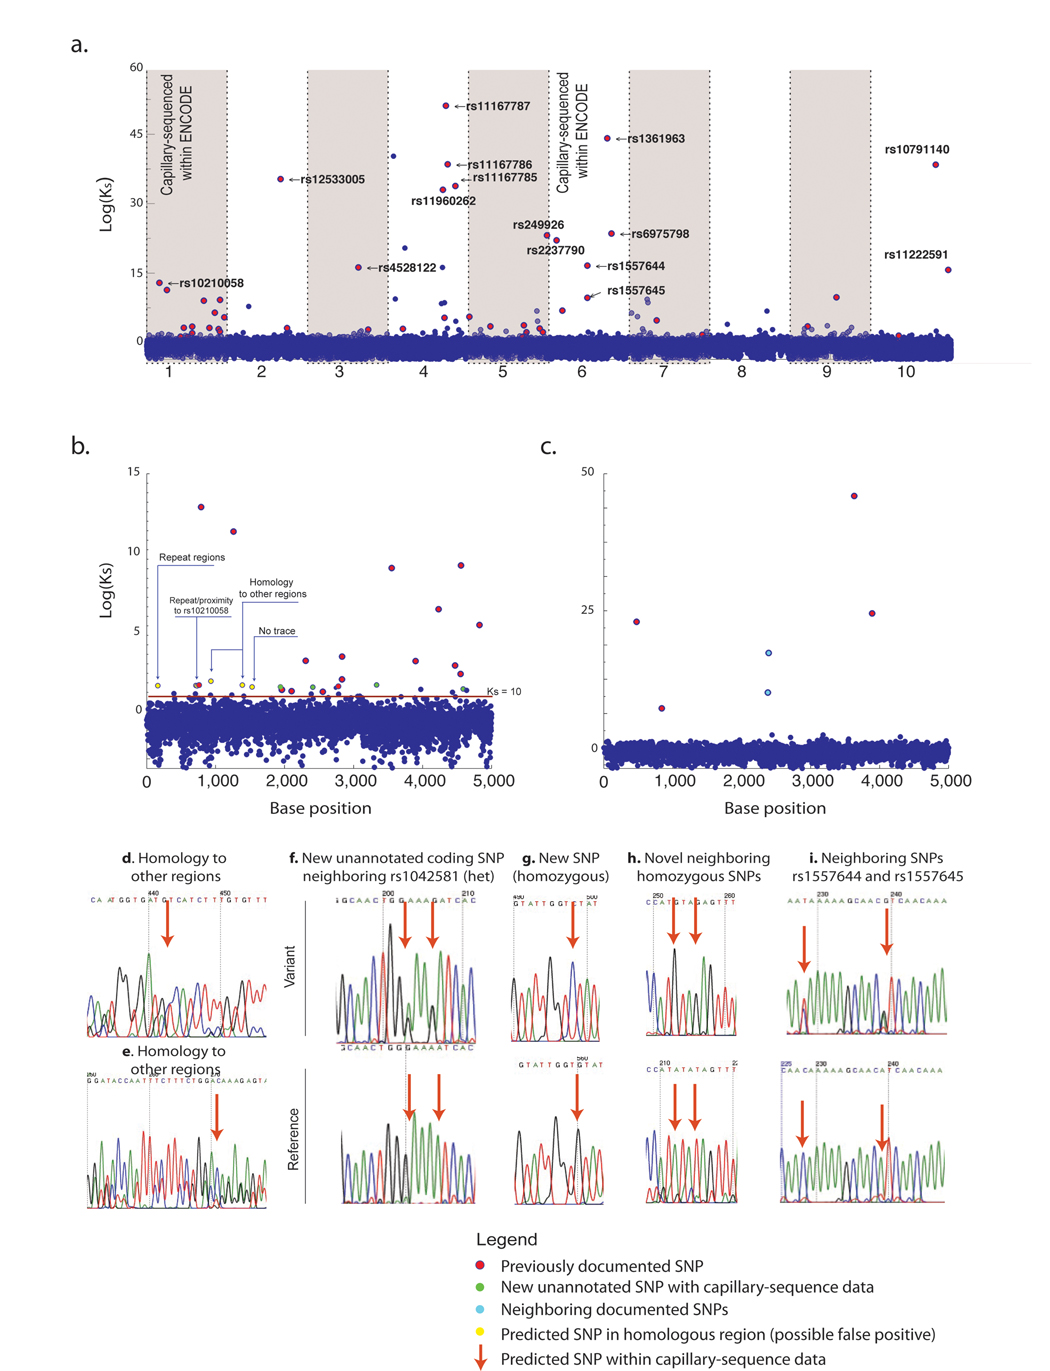
Sequenced regions were analyzed base-by-base for all individuals by calculating a polymorphism discovery Bayes factor (defined as Ks in equation 2). An example plot of Ks across each base (of 50kb) is shown in figure 4 for Library A; a similar analysis was conducted for Library B (supplemental figure 1).
Figure 4. Discovery of variant bases by simultaneous analysis of all individuals.
(a.) The Bayes-factor for polymorphism discovery(Ks) is plotted for each of the10 sequenced 5kb amplicons from Library A. Exact positions matching known polymorphisms are colored as red spheres and the dbSNP identifier is provided for the most significant SNPs. Black bars at top indicate locations of documented SNPs. A magnified view of amplicon 1 (b.) and amplicon 6 (c.) is provided to compare variants predicted by indexed-multiplexed sequencing to previous deep capillary sequencing results for the same individuals as part of the ENCODE project. (d–e.) Examples of false-positives arising from sequence homology to elsewhere in the genome. (f–i.) Examples of sequence traces validating the discovery of novel SNPs not previously annotated in ENCODE capillary sequencing traces. Similar analysis was conducted on Library B (shown in the supplementary figure 1).
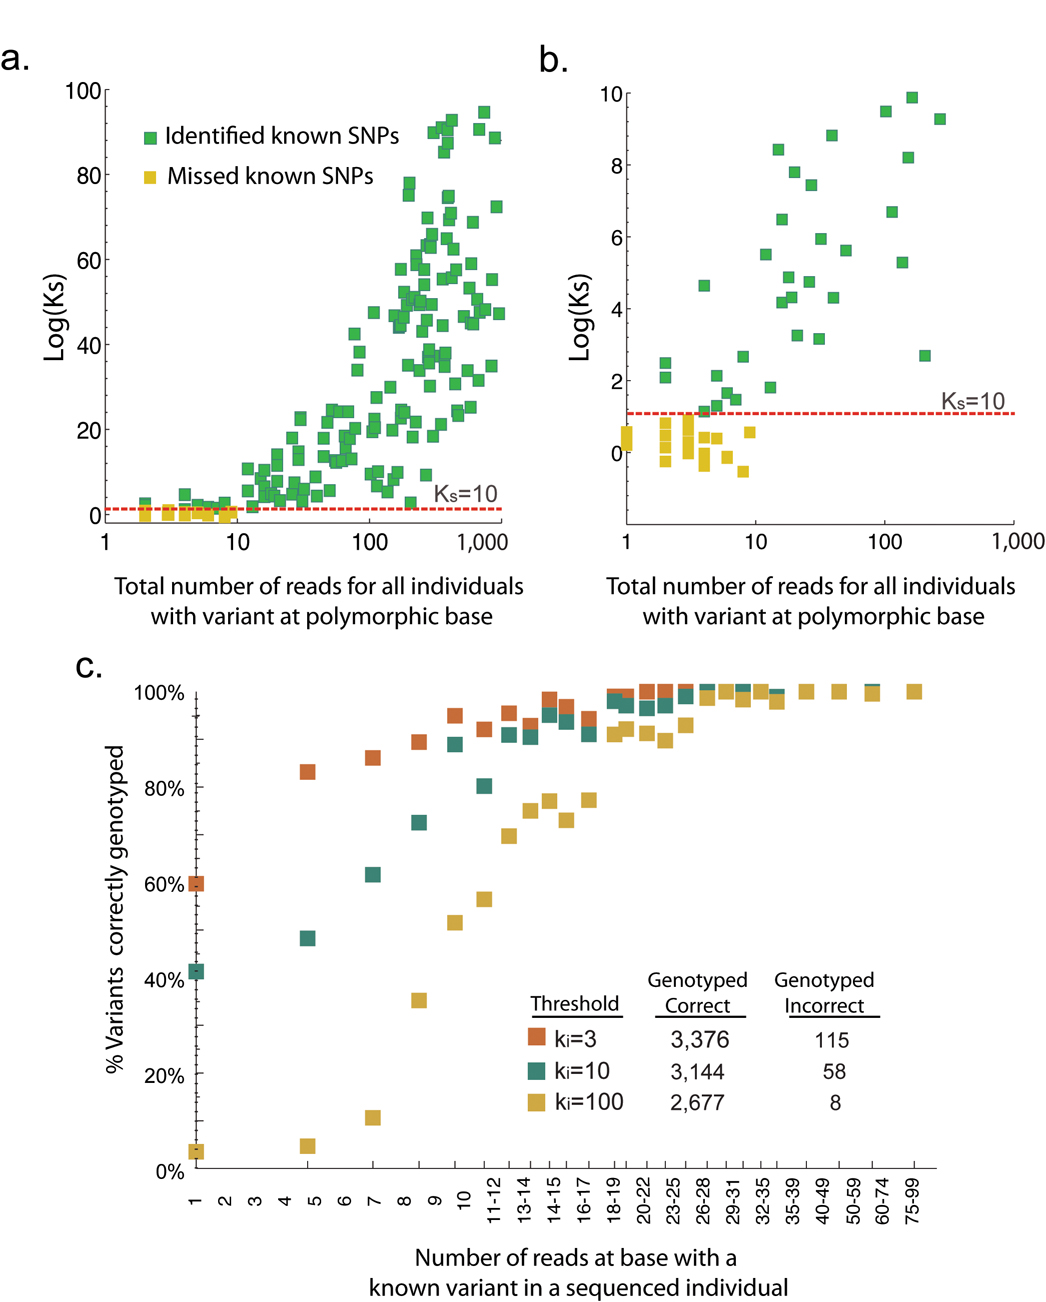
We next evaluated false-positive and false negative rates to assess our experimental and analytical framework for variant discovery (table 1 for Library B and figure 5 for both Library A and B). False positives are particularly difficult to quantify since not all polymorphic sites are known, even in previously resequenced regions. In our analysis, to be defined as a false positive, a variant must not exactly match the location of variants within dbSNP, and must not have trace sequencing data indicating a previously missed variant. In some cases trace sequence data was not available or unreliable. Consequently, the false positive rate is expected to be an upper estimate since the exact position must be validated as polymorphic by an existing database. False negative rates were determined by calculating if a base known to be polymorphic in our library of HapMap individuals reached previously specified Ks thresholds. This calculation of false-negative rates does have some bias, since it does not take into account coverage of the polymorphic base. Figure 5 plots the dependence of Ks on coverage.
Table 1.
Evaluation of false positive and false negative rates for polymorphism discovery at various Ks and Ki thresholds, irrespective of coverage. Rates are calculated using Library B since all regions had been previously resequenced within the ENCODE project. (Upper) Predicted polymorphic bases at a given threshold for Ks were evaluated by comparison to known polymorphisms within dbSNP and to ENCODE capillary sequencing traces (see main text for details). False negatives rates reflect that greater base coverage is required to exceed larger Ks thresholds and that many polymorphisms become insufficiently covered for polymorphism discovery at these levels (see figure 5 for relation between coverage and Ks). (Lower) Evaluation of variant genotype calling at different thresholds for Ki.
| Polymorphism discovery by Ks threshold | ||||
|---|---|---|---|---|
| Threshold (Ks) | Polymorphisms predicted | True positives Validated by dbSNP or NCBI Trace Archive | False positives Not identified in dbSNP or NCBI trace archive | False negatives Irrespective of coverage |
| 3 | 932 | 112 | 88.0% | 9.2% |
| 10 | 352 | 107 | 69.6% | 10.8% |
| 100 | 131 | 99 | 24.4% | 32.3% |
| 1000 | 106 | 94 | 11.3% | 90.8% |
| Individual variant calling/genotyping (AA, AB, BB) by Ki threshold | ||
|---|---|---|
| Threshold (KI) | Genotyped correctly | Genotyped incorrectly |
| 3 | 3,376 | 115 |
| 10 | 3,144 | 58 |
| 100 | 2,677 | 8 |
| 1000 | 2,397 | 7 |
Figure 5. Relationship between base-level coverage and Bayes-factor for polymorphism discovery and variant genotyping.
(a.) The y-axis is Log(Ks) and the x-axis is the total coverage across only those individuals with a non-reference genotype at a known polymorphism (AB or BB). (b.) Same, zoomed to lower Ks and lower coverage. (c.) The percent of the time the correct genotype was determined is plotted versus the coverage of the variant within the individual. Plots contain cumulative statistics using variant discovery and genotyping within both Library A and B.
As expected, setting a higher threshold for Ks gives fewer false positives. In table 1 for Library A, as Ks increases from 10 to 1,000 the false positive rate decreases from 69.6% to 11.3%. Likewise, with fixed coverage we observe the false negative rate increasing from 10.8% to 90.8% as Ks increases from 10 to 1,000. A more detailed discussion of false-negative and false-positive rates is provided in the supplementary methods. Referring to figure 5, all the false negatives occur when the cumulative coverage of individuals with the rarer variant is less than 10 reads. Further highlighting the dependence of false-negatives on coverage, all polymorphisms that were covered by 20+ reads (summed across individuals known to differ from the reference) have a Ks >1,000. Overall, we observed that 90% of variants were detectable, though designing for >20 reads will be essential for controlling false negatives.
Through the course of analyzing bases with a Ks > 100 for false positives, using NCBI archived ENCODE traces, new SNPs were discovered that were evident in visual reinspection of capillary traces, but that had not been annotated in dbSNP (figure 4f–h). These examples demonstrate that index-based resequencing can identify novel variants even in heavily sequenced and heavily annotated regions. Within Library B, it is intriguing to note that two variants with a Ks>100 were not SNPs but actually insertions (rs11279266 is a 1bp insertion and rs10555419 is a 6bp insertion). Thus it is possible to identify genetic variants explicitly not allowed within the alignment scheme.
Genotyping individuals at known polymorphisms
Since false negatives are clearly tied to coverage, we explored the influence of coverage further by analyzing the above regions in an individual-by-individual analysis. Derived in Equation 3 within the methods, Ki is an analogous Bayes-factor for an individual having the rarer allele at a known polymorphic base. Conceptually, it can be thought of as a specific individual’s contribution to Ks. Shown in high granularity (figure 5c), we calculate the percentage of variants correctly identified in an individual given a certain number of reads. For example, when the coverage for a base was ~20 reads (averaging from 16 to 24), we detected >80–90% of the bases at Ki>10, with a false-positive rate of 1.6%. In comparison to polymorphism discovery, the low false-positive rates of genotyping at a known polymorphic base are due to the fact that we are no longer assessing thousands of bases for a rare event, but rather assessing a few dozen individuals for a more frequent event.
Discussion
Our experience suggests that achieving adequate coverage is one of the most important factors in the design of a multiplexed targeted resequencing experiment. Depending on assumptions made within the experiment, the desired coverage (and as a consequence, the cost) can vary substantially. Key considerations include whether the objective is (1) discovering genetic variants for genotyping by a separate method such as custom SNP genotyping, (2) conducting polymorphism discovery and variant calling within one sequencing experiment, and/or (3) exhaustively resequencing for all common and rare variants.
Exhaustive polymorphism discovery is the next major phase for GWA studies. Shown in Figure 4, indexing of short-reads is surprisingly robust at polymorphism identification. For example, even when a highly restrictive error alignment scheme was used, we were able to identify a novel coding SNP three bases from an annotated SNP. Additionally, it is encouraging to see the discovery of insertions using an alignment scheme only allowing substitutions. Finally, it is a highly encouraging that an automated analysis strategy for short-read data can uncover novel variants, even in regions that were previously sequenced for variant discovery using these HapMap individuals.
Based on the false-positive and false-negative rates, a critical factor will be how to balance coverage and cost. In table 1, utilizing a threshold of Ks > 1,000, we observe a low false-positive rate (11.3%) and a high false-negative rate (90.8%). Since we required that the exact base must be polymorphic in an existing database, the actual false-positive rate may be lower. As evident in figure 5, false negatives are due to the additional coverage (>10 reads) is required for overcoming higher Ks thresholds. Considering the substantial base-to-base variability in figure 3, one would not simply want to design for an average coverage of 10 reads. Rather, by designing for ~50 reads or more, one may minimize both the false negative and false-positive rates, given coverage variability of short-read sequencing.
While whole-genome sequencing may be the primary motivator for improvements in sequencing technology, it is clear that next-generation technologies are immediately useful for focused hypothesis-driven sequencing of linkage peaks, groupings of candidate genes, or sequencing the entire known coding sequence of the human genome. In this report, we developed per-individual indexing of pooled PCR amplicons to carry out targeted sequencing. However, it is straightforward to envision using other sample preparation methods, such as genome partitioning 9–12. One could replace the pooled amplicons from our experimental outline (figure 1) with total genomic DNA and complete the partitioning by a hybridization approach after pooling ligated amplicons. Indeed, variation discovery through the resequencing of all candidate regions implicated in a disease across dozens, and possibly hundreds, of individuals could be significantly accelerated by merging multiplex capture, indexing, and next-generation sequencing approaches into a single protocol.
Methods
Amplification and pre-ligation sample preparation
Two primary amplicon libraries (Library A and B, specific targeted regions listed in supplementary table 2) were constructed from individually amplified 5kb regions using long-range PCR. Regions composing a library were chosen from the ENCODE project and selected to provide a sampling of different genomic region types. Only a portion of the overall ENCODE regions have been previously sequenced as part of the SNP discovery portion of the ENCODE project. Library A was a composite of previously sequenced regions and regions not sequenced in ENCODE. Library B was entirely composed of regions that were previously sequenced. Flanking primers for each amplicon (supplementary table 5) were manually selected. While we did not screen for the existence of known polymorphisms within the primer sequences, such effort would be advisable in future efforts. A detailed description of region amplification, amplicon pooling, fragmentation, preparation of 48 adapters, end-repair, ligation, PCR enrichment, cluster generation and sequencing on the Illumina Genome Analyzer are provided in the supplementary methods.
Analysis – Base calling and alignment
Illumina GA images were analyzed using a modified Illumina GA (0.2.2.6) processing pipeline. Descriptions of the modifications and all scripts are available at bioinformatics.tgen.org. A default matrix deconvolution file was used for base-calling by ‘Bustard’ based on a control phi-X library provided by Illumina. Following base-calling a script was used to access all sequences, regardless of quality score. We deviated from the default cut-offs provided by Illumina’s ‘GERALD’ process since it was found that sequence quality was better controlled by matching to an index (46/4096 or 0.1% by chance) or matching with 1 or fewer errors to the reference sequence. Bases were aligned by progressively truncating the sequence at the 5’ end until a unique alignment was obtained with a probability of stochastic alignment of less than 1%. This approach is distinct from recently described short-read alignment schemes13, but clearly has some of the same features.
Aligned sequences were summarized into a binomial of counts agreeing (ai) or disagreeing (bi) with the reference sequence for the ith individual of n total individuals for each base (s). The error rate (θs) is the percentage of reads disagreeing with the reference sequence across all samples. Model 1 (M1) assumes that the error rate for an individual equals the error rate for all individuals, or θi = θs. Therefore we can estimate θs as:
| Equation 1 |
Model 2 (M2) assumes that for some individual i we have θi ≠ θs. To calculate this likelihood we use a hyperprior offset (σs) for three possible genotypes. The hyperprior can be thought of as conditioning on the zygosity of the individual and thus reflecting the uncertainty of the genotype of the individual at a given base. In this analysis we focus on the detection of biallelic SNPs but triallelic or other types of SNPs could be considered under more complex models. The Bayes factor for a base position is:
| Equation 2 |
In equation 2, Ks is the Bayes factors across all individuals and is calculated for each SNP. The value for Ks is effectively identifying polymorphisms at a base, and determination of the individuals that show the rare variant is accomplished by Ki:
| Equation 3 |
The analysis for rare variants in the above equation uses the prior probability of p(σs) derived from the distribution across all individuals and all bases initially assuming all other individuals are homozygous for the reference allele, which is a reasonable assumption given that novel variants are assumed to be rare. By successive iterations, p(σs) is then recalculated by calling variants AA, AB, and BB under a given threshold (e.g. Ki={3,10,100}), and recalculating p(σs) based on these variant calls. Plots of Bayes factors vs. error rates are provided in supplementary figure 2 to show distribution of Bayes factors and their correlation with error rate.
If a SNP is known it is also reasonable to use other prior information at a base, such as allele frequency in the population. However, prior information on the location and allele frequency of known SNPs was not used in this study in order to better evaluate the effectiveness of the underlying framework.
Supplementary Material
Supplementary File Title
Supplementary Figure 1 Polymorphism discovery and Ks values
Supplementary Figure 2 Bayes factors vs. non-reference bases
Supplementary Table 1 Primers
Supplementary Table 2 Selected Regions
Supplementary Table 3 Adapter sequences
Supplementary Table 4 DNA indexes appended to each adapter
Supplementary Table 5Known SNPs and Ks values
Supplementary Methods None
Acknowledgments
We wish to acknowledge funding from the state of Arizona, National Heart Lung and Blood Institute (U01 HL086528) and the Stardust foundation.
Footnotes
Competing Financial Interests
G. Nunn has a commercial interest as an employee of Illumina.
References
- 1.Frazer KA, Ballinger DG, Cox DR, et al. Nature. 2007;449(7164):851. doi: 10.1038/nature06258. [DOI] [PMC free article] [PubMed] [Google Scholar]
- 2.Nature. 2007;447(7145):661. doi: 10.1038/nature05911. [DOI] [PMC free article] [PubMed] [Google Scholar]
- 3.Zondervan KT, Cardon LR. Nat Protoc. 2007;2(10):2492. doi: 10.1038/nprot.2007.366. [DOI] [PMC free article] [PubMed] [Google Scholar]
- 4.Meyer M, Stenzel U, Myles S, et al. Nucleic Acids Res. 2007;35(15):e97. doi: 10.1093/nar/gkm566. [DOI] [PMC free article] [PubMed] [Google Scholar]
- 5.Parameswaran P, Jalili R, Tao L, et al. Nucleic Acids Res. 2007;35(19):e130. doi: 10.1093/nar/gkm760. [DOI] [PMC free article] [PubMed] [Google Scholar]
- 6.Milosavljevic A, Harris RA, Sodergren EJ, et al. Genome Res. 2005;15(2):292. doi: 10.1101/gr.3162505. [DOI] [PMC free article] [PubMed] [Google Scholar]
- 7.Hamady M, Walker JJ, Harris JK, et al. Nat Methods. 2008;5(3):235. doi: 10.1038/nmeth.1184. [DOI] [PMC free article] [PubMed] [Google Scholar]
- 8.Birney E, Stamatoyannopoulos JA, Dutta A, et al. Nature. 2007;447:7146–799. doi: 10.1038/nature05874. [DOI] [PMC free article] [PubMed] [Google Scholar]
- 9.Albert TJ, Molla MN, Muzny DM, et al. Nat Methods. 2007;4(11):903. doi: 10.1038/nmeth1111. [DOI] [PubMed] [Google Scholar]
- 10.Hodges E, Xuan Z, Balija V, et al. Nat Genet. 2007;39(12):1522. doi: 10.1038/ng.2007.42. [DOI] [PubMed] [Google Scholar]
- 11.Porreca GJ, Zhang K, Li JB, et al. Nat Methods. 2007;4(11):931. doi: 10.1038/nmeth1110. [DOI] [PubMed] [Google Scholar]
- 12.Okou DT, Steinberg KM, Middle C, et al. Nat Methods. 2007;4(11):907. doi: 10.1038/nmeth1109. [DOI] [PubMed] [Google Scholar]
- 13.Jeck WR, Reinhardt JA, Baltrus DA, et al. Bioinformatics. 2007;23(21):2942. doi: 10.1093/bioinformatics/btm451. [DOI] [PubMed] [Google Scholar]
Associated Data
This section collects any data citations, data availability statements, or supplementary materials included in this article.
Supplementary Materials
Supplementary File Title
Supplementary Figure 1 Polymorphism discovery and Ks values
Supplementary Figure 2 Bayes factors vs. non-reference bases
Supplementary Table 1 Primers
Supplementary Table 2 Selected Regions
Supplementary Table 3 Adapter sequences
Supplementary Table 4 DNA indexes appended to each adapter
Supplementary Table 5Known SNPs and Ks values
Supplementary Methods None


