

Abstract
We present evidence for potential biomarker utility of a mitochondrial complex I subunit, (NDUFS3) in discriminating normal and highly invasive breast carcinoma specimens obtained from clinical patients. Besides being a robust indicator of breast cancer aggressiveness, NDUFS3 also shows clear signatures of a hypoxia/necrosis marker in invasive ductal carcinoma specimens. Statistically significant positive correlation was observed between nuclear grade and NDUFS3 expression level in the tumor specimens analyzed. We support these findings with a plausible mechanism involving mitochondrial complex I assembly defects and/or redox buffering induced mitochondrial dysfunction during the process of cancer cell transformation. From a clinical standpoint, this novel observation adds value in augmenting the current receptor-based biomarkers for better accuracy in diagnosis and predicting survival rate in patients with breast carcinoma.
Keywords: Breast carcinoma, Mitochondrial Complex I, NDUFS3, Hypoxia, Biomarkers
1. Introduction
Ductal Carcinoma In situ (DCIS) is a histologically distinct, pre-invasive stage of breast carcinoma. Early detection of DCIS-associated precancerous lesions can significantly enable the complete removal of the lesions by lumpectomy or mastectomy – which can be further helped by radiation therapy where needed.[1,2] However from a clinical standpoint, even for the women who have been treated for DCIS, there is still difficulty in predicting the likelihood of DCIS recurrence and/or the likelihood of DCIS-invasive carcinoma transition. Biomarkers are qualitative and quantitative predictors of clinical outcomes based on a molecular understanding of the disease as well as the technological resources to interrogate the disease status with high sensitivity.[3,4,5] Current biomarkers for breast cancer include those that are either specific to receptor status (e.g., estrogen or herugulin receptors) and those that are generic to all type of cancer pathology (e.g., Ki67 positivity).[6,7] Despite the availability of these biomarkers, their utility is limited to cases which show specific receptor status and are not applicable to certain class of invasive breast cancers (e.g., triple negative breast cancers). A more prudent strategy will be to identify putative metabolic biomarkers that can target a larger ensemble of cancer transformation phenotype independent of their genetic background and/or receptor status – but targeting a more fundamental bioenergetic pathway of cancers.[8,9,10,11,12,13] In this short communication, we present evidence for potential metabolic biomarker utility of a mitochondrial complex I assembly subunit. NADH dehydrogenase [ubiquinone] iron-sulfur protein 3 (NDUFS3) is one of the precursor subunits in the 45-subunit mitochondrial complex I. As a catalytic subunit, it has been shown to play a vital role in the proper assembly of intact, functional complex I in the human mitochondrial respiratory chain.[14,15,16,17] Implications of complex I deficiency/dysfunction in a variety of neurodegenerative disorders have been documented.[14,18,19,20] However, there is no published evidence for its role in cancer pathology. In an attempt to identify mitochondrial role in breast cancer etiology and progression, we discovered that NDUFS3 subunit expression is a robust indicator of invasiveness in ductal and lobular carcinoma. Furthermore, NDUFS3 expression also was found to be significantly higher in hypoxic/necrotic regions of the breast cancer specimens from clinical patients (tissue arrays) thereby revealing its potential biomarker utility as a hypoxia marker in breast cancer and quite possibly, other cancer types as well. To the best of our knowledge, this is one of the first reports of mitochondrial/metabolic biomarker in breast carcinoma. We postulate a potential mechanism for our observations based on a cell culture studies in this paper.
2. Materials & Methods
2.1 Tissue Immunofluorescence
Human breast cancer tissue arrays were purchased from Biomax US Inc., (Rockville, MD, USA). Tissue array slides were deparrafinized in xylene/ethanol and then heated in citrate buffer for antigen retrieval (10mM Sodium Citrate, pH 6) at 98°C for 45 minutes. After blocking (2%BSA/PBS at 37°C) for 30 minutes, primary antibody staining was done over night with the following working concentrations: NDUFS3 1:200; NDUFB8 1:200; Porin 1:1000 (Mitosciences, Eugene, OR). Fluorescent visualization was enabled by anti-mouse Alexa594 conjugated secondary antibody counterstained with nuclear dye, DAPI (50ng/ml). Similar protocol was adopted for two-dimensional cell cultures. For specific metabolic perturbation experiments reported in this study, MDA-MB-231and MCF-10A cells were seeded on 18 mm glass cover slips in 12 well plates (100,000–150,000 cells/well) and then treated with 50µg/ml and 100ug/ml chloramphenicol for 24 hr and in another experiment with 1µM ROT for 24 hr.
2.2 Metabolic measurements
Cells grown in 12-well plate were treated with 0 –100µM H2O2 for 24 hours after which they were trypsinized and stained with trypan blue. Cell viability was determined by calculating the cell count and for each concentration and expressing as a percentage of total number of cells. Lactate measurement was done by measuring the extracellular lacte after incubating the cells for 1 hour in 100µl serum free media. Mitochondrial membrane potential was measured by incubating the cells with 200nM TMRM in PBS for 20 min and then analyzed by FACScan flow cytometer (BD Biosciences). For immunoblotting, 25µg protein was loaded on SDS-PAGE gel and transferred to PVDF membrane overnight. Membrane was then blocked with primary antibodies mouse NDUFS3 (1:2000; Mitosciences) and rabbit β-actin (1:5000; Abcam) overnight at 4°C. Next day, IR Dye labeled secondary antibodies (Antimouse 1:5000; Anti Rabbit 1:5000; 926–32221; Licor Biosciences) were used for visualization of bands using the Odyssey Scanner (Licor Biosciences). For SiRNA transfection, cells were seeded in 12 well plate (50,000 cells/well). Following 24 hour culture, 75ng SiRNA solution (NDUFS3_3; Gene ID 4722; Qiagen,USA), (NDUFS3_5; Gene ID 4722; Qiagen,USA), was added according to the manufacturer’s instruction. The cells were incubated for 48 hours and then lactate measurement, TMRM FACS and western blot were done as described above.
2.3 Image Acquisition and Analysis
Wide-field epifluorescence microscopy imaging systems (Olympus IX 70, Orca ER camera & Nikon AZ100, Nikon Qi camera) were employed in collecting all the images reported in this study. Appropriate filter cubes for collecting fluorescence from the specimen (DAPI filter: 360/40 nm excitation; 400 nm LP dichroic; 460/50 nm emission & Alexa 594 filter :595/30 nm excitation; 600 nm LP dichroic; 620/50 nm emission). Nuclear grade analysis was done by optimizing the DAPI labeling protocol for good signal-to-noise ratio as well as for rapid readout of the images. Supporting tumor cell proliferation studies were carried out by labeling the tissue arrays with Ki67 tagged with Alexa 488 fluorophore. Typical time of acquisition per image (1392 × 1040 pixels) was under 2 seconds. Tissue fluorescence images obtained by the aforementioned protocols were analyzed for three morphometric parameters namely, nuclear size, circularity and nuclear count. We recently demonstrated that nuclear area fraction is a reliable indicator of tumor aggressiveness.[21] This parameter yields a comprehensive picture of nuclear distribution which takes into account both the nuclear size/shape and the nuclear count. We extended this parameter in validating breast tissues arrays in the present study.
2.4 Statistical Analysis
All statistical analysis was done using the open source statistical software R. Two sided t-test is used to compare two independent means. The assumption of normal distribution of the data is tested with the Shapiro-Wilk test. The distribution of NDUFS3 expression values by group was summarized in a box-plot diagram. The boxes represent 25th–75th percentiles of the NDUFS3 expression values in each group. The whisker bars represent the lowest and highest datum still within 1.5 interquartile range. The median values are indicated by the darker horizontal band. Pearson’s correlation coefficient was used to estimate the correlation between nuclear area fraction and NDUFS3 expression levels.
3. Results
3.1. NDUFS3 expression is significantly higher in breast cancer tissues
Immunofluorescence studies in a series of breast tumor specimens obtained in a microarray format revealed a significantly higher NDUFS3 expression in invasive breast cancer specimens. Figure 1 shows representative immunofluorescence images from human breast cancer tissues. These initial studies were then extended to breast tissue array containing a larger ensemble of invasive ductal carcinoma (IDC) specimens. Supplemental Table 1 summarizes the complete list of tumor characteristics, patient age and tumor staging. The invasive ductal carcinoma specimens had the highest NDUFS3 expression whereas only moderate increase was observed in mildly aggressive mucinous carcinoma cases‥ Detailed statistical analysis of this data set (Figure 1b) further confirmed that invasive ductal carcinoma is associated with a significantly higher NDUFS3 expression. No specific exclusion of the available data was carried out so that the candid statistical analysis will reveal significance regardless of the heterogeneity in patient and tumor characteristics.
Figure 1. NDUFS3 expression is upregulated in invasive cancer.
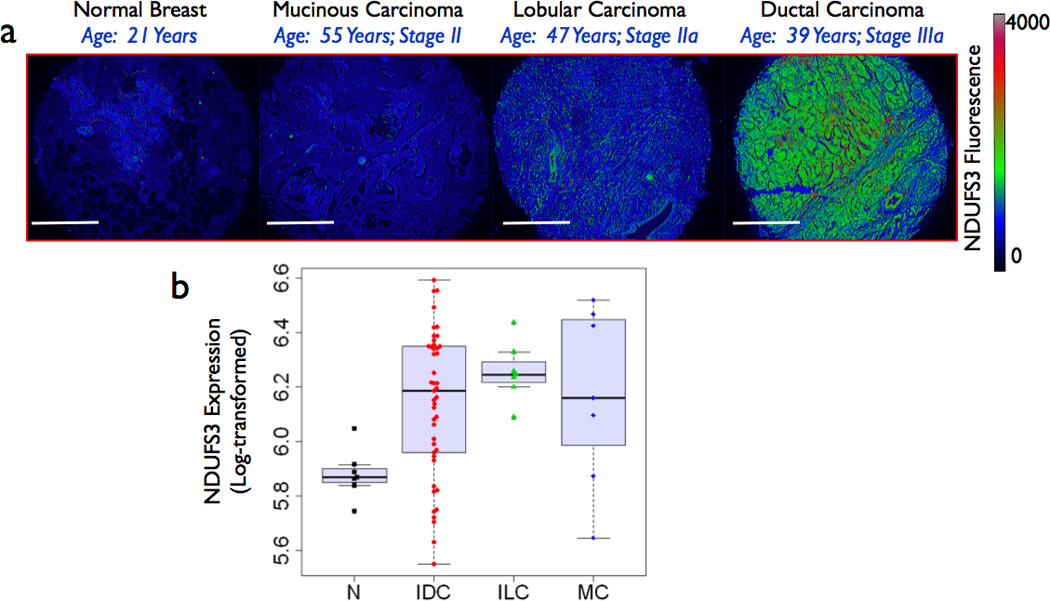
(a) Representative immunofluorescence images from four clinical specimens (normal (N) mucinous carcinoma (MC), invasive lobular carcinoma (ILC) and invasive ductal carcinoma (IDC). Spatial distribution of NDUFS3 fluorescence intensities is shown in the pseudo-color images. Scale bars: 500µm (b) Detailed statistical analysis of expanded study with 80 clinical breast specimens (normal and tumors) shows significant difference between normal and all the three tumor types studied (p < 0.05). A box plot summaries the NDUFS3 expression distributions of expanded study with 80 clinical breast specimens (normal and tumors) for normal, and all three tumor types studied. More details about the statistical analysis can be found in the main text and the supplemental data.
3.2 NDUFS3 expression is preferentially upregulated in hypoxic/necrotic tumor sites
In order to understand the further ramifications of our initial observations, we analyzed all the IDC specimens and made a striking observation that the most significant increase in NDUFS3 expression in these specimens occurred only in hypoxic or necrotic regions of the tumor tissues. Figure 2 shows a representative set of images demonstrating this observation. Hypoxic and necrotic regions can be easily identified by the distinct nuclear morphometry where the apoptotic nuclei show a highly condensed nuclei (smaller size and increased DAPI fluorescence) whereas severely necrotic regions of the tumor show a high degree of nuclear fragmentation and a significant loss of DAPI fluorescence. As can be seen from these images, NDUFS3 expression has a preferential increase in the comedo-DCIS type and in particular, the hypoxic and necrotic regions. It is important to note that such necrotic regions do not show corresponding increase in another non-catalytic mitochondrial complex I subunit, NDUFB8 [inset of Figure 2(l)]. This comparison further confirms that observed increase in NDUFS3 is not an artifact of labeling but a genuine effect that has a plausible origin in the catalytic activity of mitochondrial complex I. Reduced oxygen availability in hypoxic regions can have either of two effects on the tumor cell mitochondria: (a) initiation of apoptosis due to hypoxic signals and (b) mitochondrial adaptation by reprogramming the translational and transcriptional apparatus so that the concomitant onset of mitochondrial assembly defects/dysfunction further exacerbate tumor glycolysis (Warburg phenotype).[20,22,23,24,25,26] Our data in Figure 2 suggests that mitochondrial defects and the resulting NDUFS3 expression profile could be associated with the progressive increase in tumor apoptosis and necrosis. Together these observations point out to the fact that NDUFS3 expression levels are strong indicators of tumor aggressiveness and also tumor hypoxia.
Figure 2. Hypoxic and necrotic regions of invasive ductal carcinoma show preferential upregulation of NDUFS3.
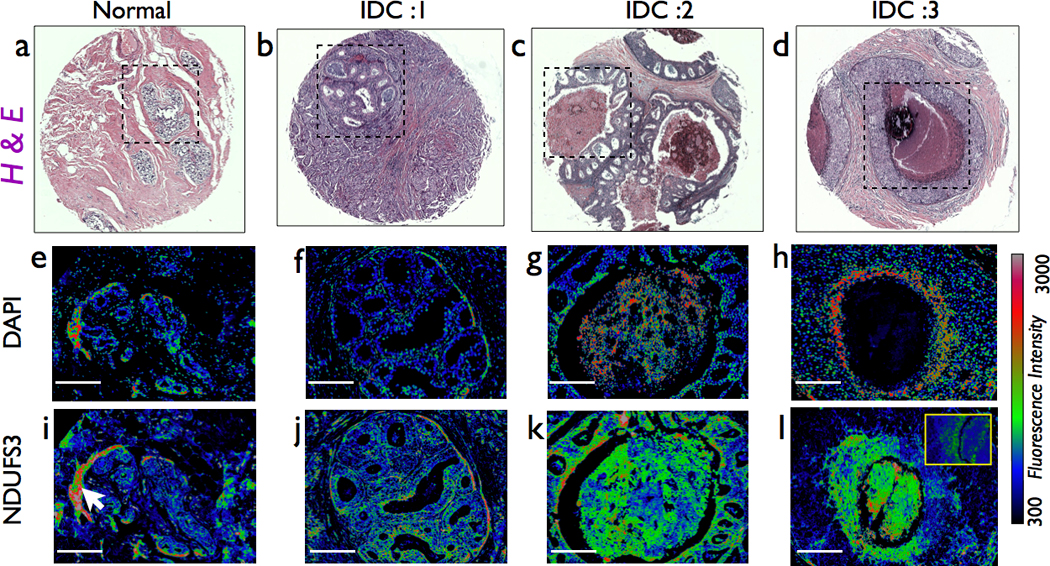
(a–d) Representative histopathology images of a normal and three ductal carcinoma (IDC1,2 &3) specimens showing various degrees of nuclear grade. (e–h) nuclear fluorescence staining by DAPI in regions marked in H&E images. As can be seen, DAPI fluorescence clearly indicate the progressive transition from normal epithelial nuclear morphology to more apoptotic/necrotic nuclear morphology as can be seen from nuclear condensation and fragmentation. In the extreme case of severe necrosis (2h), nuclear staining is completely absent inside the comedo-DCIS region while the periphery is still marked by hypoxic, high intensity, condensed nuclei. The bottom-most panel shows the spatial distribution of NDUFS3 expression (i–l). It is clear that NDUFS3 expression is preferentially higher in the hypoxic/necrotic regions of the tumor sections. The inset of (l) shows a immunofluorescence image of non-catalytic NDUFB8 expression from a serial tissue section from the same patient specimen. NDUFB8 does not show the drastic increase in the necrotic region where NDUFS3 does display a preferential up-regulation. The white arrow in (i) indicates an artificial increase in NDUFS3 expression in normal breast tissue area that was caused by a labeling artifact in a folded tissue region. For all the images shown in (e–l), scale bars: 200µm.
3.3. Increased NDUFS3 expression correlates with the extent of tumor aggressiveness
We recently reported a nuclear grade imaging approach to quantify the extent of tumor aggressiveness.[21] As shown in Figure 2 (and supplemental Figure S1), an increase in nuclear grade and Ki67 expression coincided with the extent of NDUFS3 expression profile thereby suggesting that NDUFS3 expression is linked with the extent of tumor aggressiveness. Figure 3a shows the nuclear grade analysis performed from the images in Figure 2. These data support the currently used nuclear grade as a morphological parameter in tumor staging. By considering the nuclear grade (nuclear area fraction) as the commonly used “gold standard”, we further established that the NDUFS3 expression in these specimens correlates very well with the nuclear area fraction (Pearson’s correlation coefficient −0.849). Together these results validate NDUFS3 expression as a robust indicator of aggressive tumor phenotype in clinical specimens.
Figure 3. Nuclear grade analysis in the tumor tissue sections.
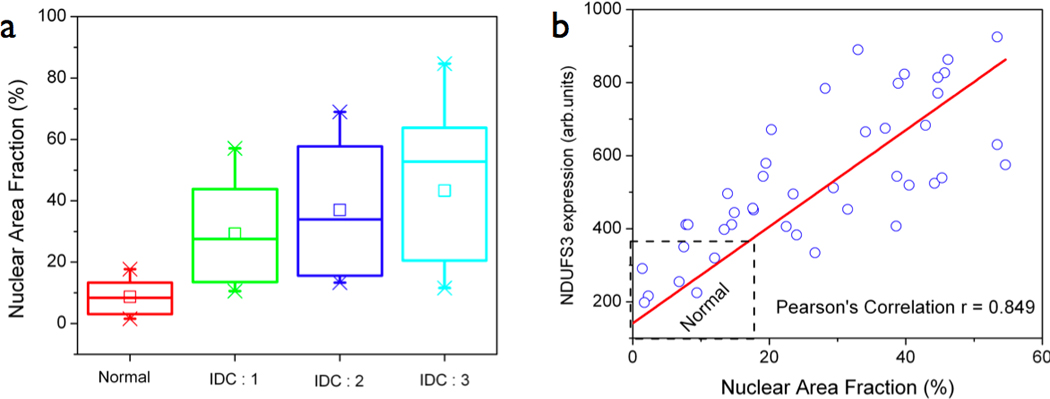
(a) Nuclear area fraction was calculated as described in the text and presented as box plot showing the variation across the four specimens analyzed from Figure 2. It is clear that the normal specimen has relatively low nuclear area fraction (20%) and the nuclear grade progressively increases in invasive ductal carcinoma specimens of increasing aggressiveness. (b) A linear correlation profile between nuclear area fraction and NDUFS3 expression with a Pearson’s correlation coefficient (r = 0.849) confirms that NDUFS3 expression can be a valid indicator of tumor aggression as compared with the pathological gold standard, nuclear grade.
3.4 Redox Buffering / Mitochondrial assembly defects could contribute to the observed increased in NDUFS3 expression
In order to understand the plausible sources of the observed NDUFS3 expression profile in aggressive cancer tissues, we resorted to cell culture based system where we compared the non-tumorigenic, normal epithelial cells (MCF10A) and tumorigenic, metastatic breast carcinoma cells (MDA-MB-231). As shown in Figure 4a, the untreated breast cancer cells (MDA231) have significantly higher NDUFS3 expression as compared with the untreated normal epithelial cells. Since NDUFS3 is a precursor subunit in the mitochondrial Complex I assembly, we suspected that an increase in this subunit expression could either arise from translational defects and/or mitochondrial assembly defects. In order to verify if inhibition of mitochondrial translation could lead to an accumulation of NDUFS3, we treated the normal and breast cancer cells with 100µg/ml chloramphenicol for 24 hours and monitored the NDUFS3 expression by immunofluorescence. Inhibition of mitochondrial translation led only to a modest increase in NDUFS3 expression. Gene silencing of NDUFS3 with SiRNA led to distinct metabolic changes in MDA231 cells further confirming that mitochondrial function in the cancer cells are more susceptible to NDUFS3 levels and vice versa (Figure 4b).
Figure 4. In vitro cell culture based studies on NDUFS3 effects.
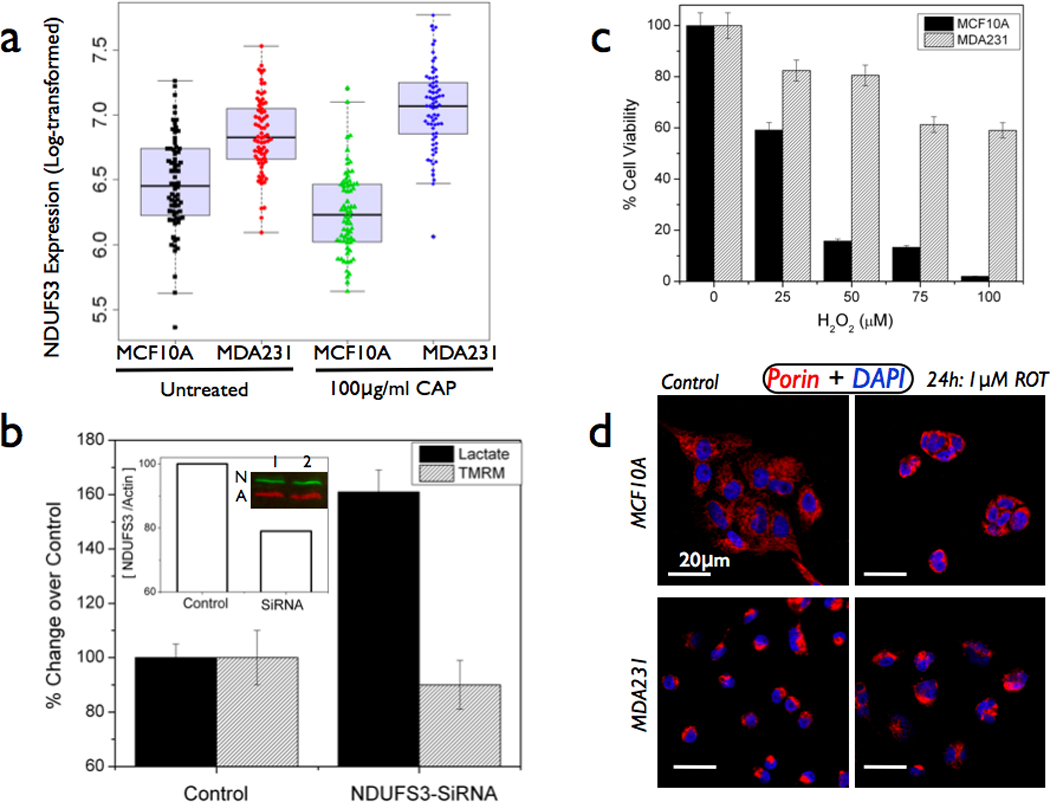
(a) Comparison of normal epithelial cells (MCF10A) and metastatic breast carcinoma cells (MDA-MB-231) reveals a significantly higher basal levels of NDUFS3 in the cancer cells. A box plot summaries the NDUFS3 expression distributions among four groups. Treatment of mitochondrial translation inhibitor (100µg/ml chloramphenicol (CAP)) also maintains this difference in NDUFS3 expression. Two-way ANOVA analysis (supplemental table ST2) showed that Normal-Cancer cells group showed significant difference but not the Untreated-Chloramphenicol group. (b) Gene silencing of NDUFS3 in MDA-MB-231 cells (only representative SiRNA data is shown out of total two sequences studied) exacerbates the metabolic deregulation (60% increase in lactate and 10% decrease in mitochondrial membrane potential as measured with the TMRM probe) in the cancer cells. Inset shows the immunoblot result with control (1) and SiRNA (2) lanes probed for NDUFS3(N) & loading control beta-actin (A); (c) Demonstration of redox buffering effect in breast cancer cells by monitoring the increased tolerance to exogenous reactive oxygen species (ROS) inducer, hydrogen peroxide. Normal cells (MCF10A) show acute sensitivity to ROS induction by severe compromise in cell viability whereas cancer cells (MDA231) show increased tolerance to ROS insult. (d) Similar effect was also seen with endogenous ROS inducer (mitochondrial complex I inhibitor, Rotenone). Normal cells display clear, filamentous mitochondrial morphology but they show strong sensitivity to ROT treatment by an acute shrinking of the mitochondrial structure (probed by mitochondrial porin antibody). On the other hand, cancer cells display a rounded, non-filamentous mitochondrial morphology that was not significantly affected by rotenone treatment. These data suggest a plausible, constitutive defect in mitochondrial complex I structure in the cancer cells studied.
Another source of constitutive mitochondrial dysfunction is the altered redox poise in cancer cells. In fact, chemoresistant cancer cells escape cell death induced by reactive oxygen species (ROS) by modulating their redox status (e.g., glutathione-induced redox buffering) which in turn offers the cancer cells an increased tolerance to ROS.[25,28] To exacerbate this ROS-induced mitochondrial damage, cancer cells also have another distinct biochemical hallmark namely, the apparent increase in glycolytic activity over the mitochondrial activity owing to their metabolic transformation. This phenomenon, Warburg effect, has been well documented in earlier publications.[20,27] An immediate consequence of Warburg phenotype in cancer cells is their ability to evade mitochondrial apoptosis and/or upregulation of their glycolytic potential even in the presence of oxygen (aerobic glycolysis). Figures 4c&d show representative data demonstrating that MDA231 cells have an increased tolerance to ROS insult (both exogenous and endogenous) as compared with normal MCF10A cells. Exogenous ROS inducer hydrogen peroxide could decrease the viability of MCF10A cells more drastically than the cancer cells. Interestingly, mitochondrial complex I inhibition by rotenone (endogenous ROS inducer) leads to significant change in mitochondrial structure (assembly defects and/or functional defects) in normal cells. On the other hand, even the untreated cancer cells have altered structure as detected with mitochondrial porin immunofluorescence and rotenone treatment did not cause any significant change in mitochondrial structure suggesting an increased tolerance of the cancer cells to ROS. This data further illustrates that an altered mitochondrial structure/function in cancer cells could be the potential mechanism by which these cells show a constitutively high NDUFS3 expression as a result of mitochondrial assembly defects.
4. Discussion
Common wisdom predicts an intricate relationship between structure and function of any cellular component and mitochondrial paradigm is no exception. Another layer of complexity arises from the fact that mitochondrial biogenesis is governed both by nuclear and mitochondrial genomes. A compromise in proper assembly of these individual complexes can lead to mitochondrial dysfunctions. Last few decades of research in understanding Warburg effect and the concomitant metabolic alterations in cancers have led to a consensus that mitochondrial dysfunction could be vital in contributing to breast cancer etiology. NDUFS3 has been shown earlier to be a critical regulator of mitochondrial complex I assembly. Our results indicate that NDUFS3 has a novel role in discriminating invasive ductal carcinoma from normal breast tissues. Since our data were obtained from clinically relevant, human breast cancer patients, these observations add further credibility to the hypothesis that mitochondrial dysfunction arising from complex I assembly defects could be a viable source of metabolic deregulation in cancer. A recent study reported that mitochondrial translation inhibition led to defects in mitochondrial ND subunits which in turn, led to a significant accumulation of the complex I precursor subunit, NDUFS3.[29] Even though our studies did not address the role of mitochondrial ND subunits in the normal and cancer cells, the cell-based studies certainly point to the direction where NDUFS3 expression can be modulated by the altered metabolic status of the cancer cells as well as by alterations in mitochondrial assembly. We speculate that with an increase in tumor aggressivenss and the onset of hypoxia, mitochondrial assembly defects can be more common thereby leading to the observed increase in NDUFS3 expression in invasive ductal carcinoma specimens.
Current clinical practice for staging the tumors involves nuclear grade and the extent of hypoxia. The finding that catalytic NDUFS3 expression (but not the non-catalytic NDUFB8 expression) is significantly high in hypoxic/necrotic regions of the tumor bears an unique place in tumor staging. We recently demonstrated that it is possible to directly image nuclear morphometry and tissue topology for tumor margin assessment in lumpectomy specimens in preclinical animal models.[21] The distinct correlation between nuclear area fraction ( a measure of cancer invasiveness) and NDUFS3 expression (Pearson’s correlation coefficient =0.84) further validates our conclusions. It will be intriguing to see if the observed hypoxic profile of NDUFS3 expression is an adaptive response of mitochondria to oxygen availability in comedo-necrosis phase of the ductal carcinoma. We believe that a systematic understanding of molecular mechanisms behind the observed NDUFS3 upregulation (and possibly mitochondrial complex I deregulation) could enable us in predicting the progressive transition from precancerous ductal carcinoma in situ (DCIS) to invasive forms of breast carcinoma thereby adding value to the current methods of estimating survial rate and prognosis in patients being treated for DCIS. A mechanistic study of our present observations is beyond the scope of this short communication. However, our preliminary in vitro metabolic measurements in normal epithelial cells and metastatic carcinoma cell lines point out to plausible roles of redox buffering and/or mitochondrial translation defects in contributing to the high expression in NDUFS3 in invasive breast carcinoma. A more detailed mechanistic exploration of the present findings will be the subject of a future preclinical animal study in the laboratory.
In conclusion, we have uncovered a novel, biomarker potential of a mitochondrial complex I subunit protein, NDUFS3 – as a robust indicator of breast cancer progression and invasiveness as well as of hypoxia/necrosis in clinical specimens of invasive ductal carcinoma. We envision that NDUFS3 and other potential metabolic biomarkers can be augmented with the currently available biomarkers so that a multiparmetric, biomarker assay panel (genetic and metabolic) can be developed to yield a better accuracy in prediction of the different stages of breast cancer, therapeutic monitoring and better prognosis.
Supplementary Material
Acknowledgements
We gratefully acknowledge financial support from Susan G Komen for Cure foundation (Career Catalyst Research Award #KG090239), National Cancer Institute/National Institutes of Health (ARRA Stimulus Award #R21-CA124843). We thank Dr Bruce Gewertz and Dr Leon Fine for their intramural support and encouragement.
Footnotes
Publisher's Disclaimer: This is a PDF file of an unedited manuscript that has been accepted for publication. As a service to our customers we are providing this early version of the manuscript. The manuscript will undergo copyediting, typesetting, and review of the resulting proof before it is published in its final citable form. Please note that during the production process errors may be discovered which could affect the content, and all legal disclaimers that apply to the journal pertain.
References
- 1.Patani N, Cutuli B, Mokbel K. Current management of DCIS: a review. Breast Cancer Res Treat. 2008;111:1–10. doi: 10.1007/s10549-007-9760-z. [DOI] [PubMed] [Google Scholar]
- 2.Virnig BA, Shamliyan T, Tuttle TM, Kane RL, Wilt TJ. Diagnosis and management of ductal carcinoma in situ (DCIS) Evid Rep Technol Assess (Full Rep) 2009:1–549. [PMC free article] [PubMed] [Google Scholar]
- 3.O'Driscoll L, Clynes M. Biomarkers and multiple drug resistance in breast cancer. Curr Cancer Drug Targets. 2006;6:365–384. doi: 10.2174/156800906777723958. [DOI] [PubMed] [Google Scholar]
- 4.McArthur HL, Dickler MN. Biomarkers in breast cancer. Cancer Biol Ther. 2008;7:21–22. doi: 10.4161/cbt.7.1.5590. [DOI] [PubMed] [Google Scholar]
- 5.Ross JS, Linette GP, Stec J, Clark E, Ayers M, Leschly N, Symmans WF, Hortobagyi GN, Pusztai L. Breast cancer biomarkers and molecular medicine. Expert Rev Mol Diagn. 2003;3:573–585. doi: 10.1586/14737159.3.5.573. [DOI] [PubMed] [Google Scholar]
- 6.Ross JS. Breast cancer biomarkers and HER2 testing after 10 years of anti-HER2 therapy. Drug News Perspect. 2009;22:93–106. doi: 10.1358/dnp.2009.22.2.1334452. [DOI] [PubMed] [Google Scholar]
- 7.Santisteban M, Reynolds C, Barr Fritcher EG, Frost MH, Vierkant RA, Anderson SS, Degnim AC, Visscher DW, Pankratz VS, Hartmann LC. Ki67: a time-varying biomarker of risk of breast cancer in atypical hyperplasia. Breast Cancer Res Treat. 2010;121:431–437. doi: 10.1007/s10549-009-0534-7. [DOI] [PMC free article] [PubMed] [Google Scholar]
- 8.Thompson CB. Metabolic enzymes as oncogenes or tumor suppressors. N Engl J Med. 2009;360:813–815. doi: 10.1056/NEJMe0810213. [DOI] [PMC free article] [PubMed] [Google Scholar]
- 9.Tennant DA, Duran RV, Boulahbel H, Gottlieb E. Metabolic transformation in cancer. Carcinogenesis. 2009;30:1269–1280. doi: 10.1093/carcin/bgp070. [DOI] [PubMed] [Google Scholar]
- 10.Bellance N, Lestienne P, Rossignol R. Mitochondria: from bioenergetics to the metabolic regulation of carcinogenesis. Front Biosci. 2009;14:4015–4034. doi: 10.2741/3509. [DOI] [PubMed] [Google Scholar]
- 11.Perou CM, Sorlie T, Eisen MB, van de Rijn M, Jeffrey SS, Rees CA, Pollack JR, Ross DT, Johnsen H, Akslen LA, Fluge O, Pergamenschikov A, Williams C, Zhu SX, Lonning PE, Borresen-Dale AL, Brown PO, Botstein D. Molecular portraits of human breast tumours. Nature. 2000;406:747–752. doi: 10.1038/35021093. [DOI] [PubMed] [Google Scholar]
- 12.Petit PX, Zamzami N, Vayssiere JL, Mignotte B, Kroemer G, Castedo M. Implication of mitochondria in apoptosis. Mol Cell Biochem. 1997;174:185–188. [PubMed] [Google Scholar]
- 13.Zamzami N, Larochette N, Kroemer G. Mitochondrial permeability transition in apoptosis and necrosis. Cell Death Differ. 2005;12 Suppl 2:1478–1480. doi: 10.1038/sj.cdd.4401682. [DOI] [PubMed] [Google Scholar]
- 14.Benit P, Slama A, Cartault F, Giurgea I, Chretien D, Lebon S, Marsac C, Munnich A, Rotig A, Rustin P. Mutant NDUFS3 subunit of mitochondrial complex I causes Leigh syndrome. J Med Genet. 2004;41:14–17. doi: 10.1136/jmg.2003.014316. [DOI] [PMC free article] [PubMed] [Google Scholar]
- 15.Dieteren CE, Willems PH, Vogel RO, Swarts HG, Fransen J, Roepman R, Crienen G, Smeitink JA, Nijtmans LG, Koopman WJ. Subunits of mitochondrial complex I exist as part of matrix- and membrane-associated subcomplexes in living cells. J Biol Chem. 2008;283:34753–34761. doi: 10.1074/jbc.M807323200. [DOI] [PMC free article] [PubMed] [Google Scholar]
- 16.Efremov RG, Baradaran R, Sazanov LA. The architecture of respiratory complex I. Nature. 2010;465:441–445. doi: 10.1038/nature09066. [DOI] [PubMed] [Google Scholar]
- 17.Procaccio V, Lescuyer P, Bourges I, Beugnot R, Duborjal H, Depetris D, Mousson B, Montfort MF, Smeets H, De Coo R, Issartel JP. Human NDUFS3 gene coding for the 30-kDa subunit of mitochondrial complex I: genomic organization and expression. Mamm Genome. 2000;11:808–810. doi: 10.1007/s003350010160. [DOI] [PubMed] [Google Scholar]
- 18.Klimova T, Chandel NS. Mitochondrial complex III regulates hypoxic activation of HIF. Cell Death Differ. 2008;15:660–666. doi: 10.1038/sj.cdd.4402307. [DOI] [PubMed] [Google Scholar]
- 19.Saada A, Vogel RO, Hoefs SJ, van den Brand MA, Wessels HJ, Willems PH, Venselaar H, Shaag A, Barghuti F, Reish O, Shohat M, Huynen MA, Smeitink JA, van den Heuvel LP, Nijtmans LG. Mutations in NDUFAF3 (C3ORF60), encoding an NDUFAF4 (C6ORF66)-interacting complex I assembly protein, cause fatal neonatal mitochondrial disease. Am J Hum Genet. 2009;84:718–727. doi: 10.1016/j.ajhg.2009.04.020. [DOI] [PMC free article] [PubMed] [Google Scholar]
- 20.Warburg O. On respiratory impairment in cancer cells. Science. 1956;124:269–270. [PubMed] [Google Scholar]
- 21.Nyirenda N, Farkas DL, Ramanujan VK. Preclinical Evaluation of Nuclear Morphometry and Tissue Topology for Breast Carcinoma Detection and Margin Assessment. Breast Cancer Research and Treatment. 2011;126:345–354. doi: 10.1007/s10549-010-0914-z. [DOI] [PMC free article] [PubMed] [Google Scholar]
- 22.Huang G, Chen Y, Lu H, Cao X. Coupling mitochondrial respiratory chain to cell death: an essential role of mitochondrial complex I in the interferon-beta and retinoic acidinduced cancer cell death. Cell Death Differ. 2007;14:327–337. doi: 10.1038/sj.cdd.4402004. [DOI] [PubMed] [Google Scholar]
- 23.Hanahan D, Weinberg RA. The hallmarks of cancer. Cell. 2000;100:57–70. doi: 10.1016/s0092-8674(00)81683-9. [DOI] [PubMed] [Google Scholar]
- 24.Mathupala SP, Ko YH, Pedersen PL. Hexokinase-2 bound to mitochondria: cancer's stygian link to the "Warburg Effect" and a pivotal target for effective therapy. Semin Cancer Biol. 2009;19:17–24. doi: 10.1016/j.semcancer.2008.11.006. [DOI] [PMC free article] [PubMed] [Google Scholar]
- 25.Soderdahl T, Enoksson M, Lundberg M, Holmgren A, Ottersen OP, Orrenius S, Bolcsfoldi G, Cotgreave IA. Visualization of the compartmentalization of glutathione and protein-glutathione mixed disulfides in cultured cells. Faseb J. 2003;17:124–126. doi: 10.1096/fj.02-0259fje. [DOI] [PubMed] [Google Scholar]
- 26.Ott M, Gogvadze V, Orrenius S, Zhivotovsky B. Mitochondria, oxidative stress and cell death. Apoptosis. 2007;12:913–922. doi: 10.1007/s10495-007-0756-2. [DOI] [PubMed] [Google Scholar]
- 27.Vander Heiden MG, Cantley LC, Thompson CB. Understanding the Warburg effect: the metabolic requirements of cell proliferation. Science. 2009;324:1029–1033. doi: 10.1126/science.1160809. [DOI] [PMC free article] [PubMed] [Google Scholar]
- 28.Trachootham D, Alexandre J, Huang P. Targeting cancer cells by ROS-mediated mechanisms: a radical therapeutic approach? Nat Rev Drug Discov. 2009;8:579–591. doi: 10.1038/nrd2803. [DOI] [PubMed] [Google Scholar]
- 29.Vogel RO, Dieteren CE, van den Heuvel LP, Willems PH, Smeitink JA, Koopman WJ, Nijtmans LG. Identification of mitochondrial complex I assembly intermediates by tracing tagged NDUFS3 demonstrates the entry point of mitochondrial subunits. J Biol Chem. 2007;282:7582–7590. doi: 10.1074/jbc.M609410200. [DOI] [PubMed] [Google Scholar]
Associated Data
This section collects any data citations, data availability statements, or supplementary materials included in this article.