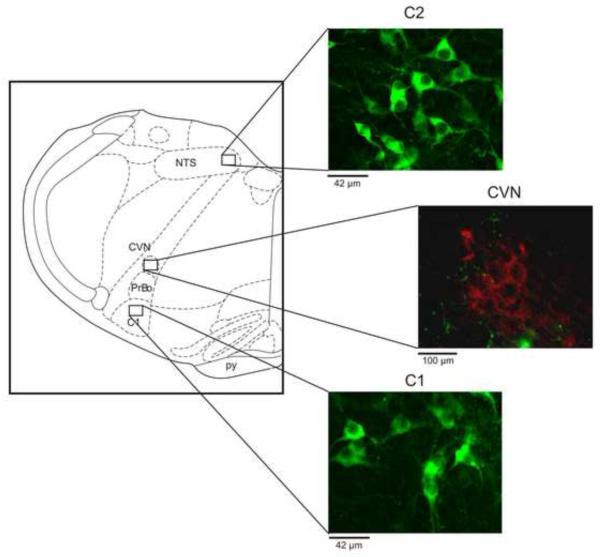
Figure 1. Representative images of tyrosine-hydoxylase (TH) positive neurons (green) in the C1 and C2 regions, with fluorescent localization of CVNs in the NA (red, by the presence of the fluorescent tracer rhodamine (X491)).
Schematic figure was adapted from Paxinos and Watson. (CVN: cardiac vagal neuron; NTS: nucleus of the solitary tract; pr: pyramidal complex; PrBo: pre-Bötzinger complex)

