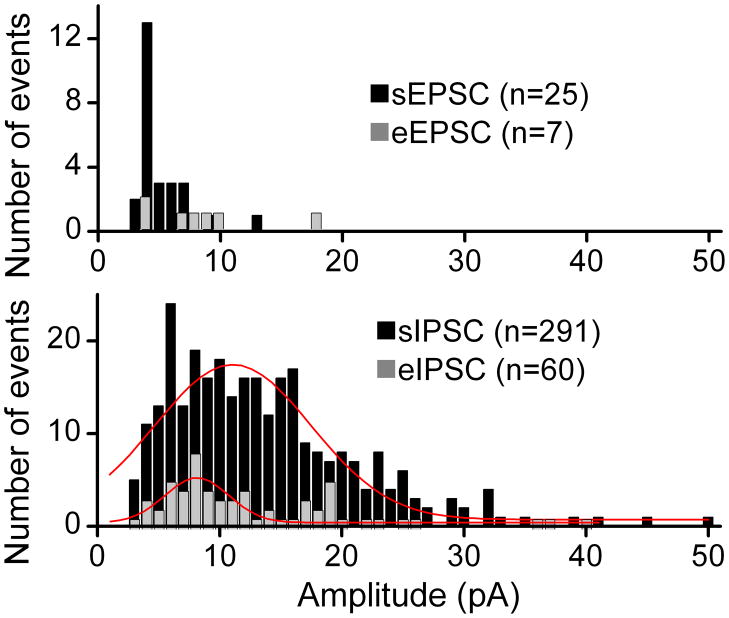
Figure 4.
Evoked single bouton amplitudes had similar distributions to spontaneous events within a single representative neuron. Histograms compare the amplitudes of recorded eEPSCs from stimulating a single site on this neuron with the amplitudes of sEPSCs recorded in the same neuron. Likewise, by moving the stimulating pipette across the surface of this neuron, an inhibitory site was activated and eIPSC and sIPSC amplitudes recorded. The eIPSC amplitude distribution overlapped that of the sIPSCs. Photomicrographs and original traces from this neuron are displayed in Figure 1. Latency for eIPSC was 2.96 ms and 3.6 ms for eEPSC. All data collected during 0.2 Hz stimulation. Red lines were Gaussian fits intended only to illustrate relative trends in these limited samples. Together the results suggest that evoked and spontaneous events were quite similar within subtypes and amplitudes were consistent with quantal events.

