Abstract
In nutrition studies, it is often of primary interest to determine the critical threshold value of some biological quantities. To determine the amino acid requirement, the tracer approach including the indicator amino acid oxidation method is useful for the investigation of human subjects. In this approach, measurements of amino acids other than the test amino acid are often repeatedly carried out with various intakes of the test amino acid. Change-point regression models have often been applied to determine the amino acid requirement. However, within-subject dependence due to repeated measurements has not been sufficiently taken into account. In this paper, we propose a mixed-effect change-point model to estimate the amino acid requirements when utilizing the tracer approach. Inference based on Akaike Information Criteria is introduced to include selection of the optimal model and construction of a confidence interval. Our method can easily be applied with a standard software package, and we found that appropriate accounting for within-subject dependence may lead to a much narrower confidence interval. We recommend application of a mixed-effect change-point regression model to determine the amino acid requirements in studies utilizing the tracer approach.
Keywords: amino acid requirement, mixed-effect model, change-point regression model
Introduction
Several different methods can be used to determine the amino acid requirements, including nitrogen balance, obligatory nitrogen loss (ONL), indicator amino acid oxidation (IAAO), direct amino acid oxidation (DAAO), and the direct amino acid balance (DAAB) method.(1–3) The earlier methodologies for determining amino acid requirements based on nitrogen balance were criticized because of their design and the associated high energy intake.(4) A further problem was related to the exclusion of miscellaneous nitrogen losses when calculating nitrogen balance. Young et al.(5) have proposed a new set of amino acid requirement values calculated from estimates of obligatory nitrogen loss (ONL) based on the pattern of indispensable amino acids in tissue protein mobilized to provide for the ONL. On the other hand, IAAO, DAAO, DAAB, called the tracer approach, are methods based on stable isotopes to measure amino acid oxidation. This approach has recently come to be commonly used. In this paper, we focus on the tracer approaches.
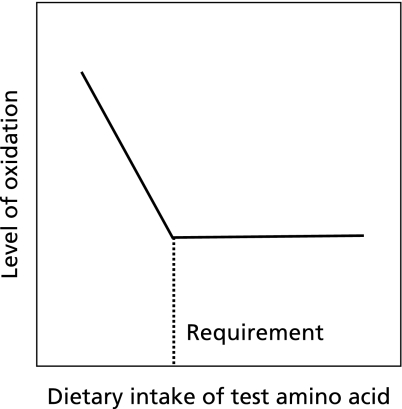
In the tracer approach, measurements of amino acids other than the test amino acid are used to determine the requirement for the test amino acid. For example, to determine the lysine requirement with the IAAO technique, oxidation of an (indicator) amino acid (e.g., 13C-phenylalanine) has been evaluated.(6–11) The theory behind the method is that if one indispensable amino acid in the diet is below the requirement (i.e. is limiting), then none of the other indispensable amino acids can be fully utilized for protein synthesis; as such, the excess amounts are oxidized. As the amount of the limiting amino acid increases, the others will be progressively better utilized and their oxidation rates will progressively fall to a lower limit at the point where the requirement of the test amino acid is reached. Intake above this amount should no longer influence the oxidation of the test amino acid, the levels of which should remain low and constant. One can thus determine the requirements of the test amino acid by estimating a threshold value of the indicator amino acid against the intake of the test amino acid (Fig. 1).
Fig. 1.
The oxidation pattern of amino acids in studies using the IAAO method. The lines represent kinetic responses to graded intakes of the test amino acid. The change-point in the oxidation response has been proposed as the physiological requirement of the test amino acid for the average individual in the population.
To estimate the threshold value of the indicator amino acid, change-point regression models are often employed.(7–12) Although change-point regression models have been widely applied to the problems of determining the amino acid requirements, we provide some refinement and remarks on this issue in this paper.
In the change-point regression models applied in previous studies,(1,7–12) any pair of slopes for the test amino acid (explanatory variable) has been considered in the two regions before and after the change-point of the test amino acid. However, a more appealing change-point regression model for this issue is that with a 0 slope after the change-point since once the requirement level is reached, a further increment of the test amino acid will have no effect on the uptake of other indispensable amino acids for protein synthesis or oxidation. In addition, in the tracer approach, measurements of the amino acid are repeatedly obtained from a subject at several doses of the test amino acid. The present results imply that measurements from the same subject are likely positively correlated. In previous studies, estimation of the change-point based on the ordinal least square method has been applied; however, it can be justified only under the assumption that all observations are statistically independent.
In this paper, we propose a statistical model based on the linear mixed model for determining amino acid requirements with the tracer approach. By maximizing the profile likelihood or equivalently minimizing Akaike information criteria (AIC), one can estimate the change-point. AIC also provides a confidence interval of the change-point accounting for within-subject dependence. From a biological perspective, we introduce a model with zero slope after the change-point that is different from those applied in previous studies in that the slope is set to zero. AIC enables us to select the best fit model for data. We compared our model with those applied in previous studies by using AIC and found that the model with the zero slope is more appropriate for determining the amino acid requirements.
Materials and Methods
Data and issue of statistical methods used in previous studies
Suppose we are interested in analyzing data obtained by the indicator amino acid method. Several subjects are enrolled and measurements of the indicator amino acid are repeatedly carried out for each subject with different doses of the test amino acid. Such a study design is widely used in studies to determine amino acid requirements.(1,7–12) Among these references, we will describe in detail the study design of a study reported by Zello et al.,(8) since we will apply our proposed method to the dataset. The study, which we will refer to as the Lys Study, was a human study investigating the lysine requirements of young adult males as determined by the IAAO method, in which the oxidation of L-[1-13C] phenylalanine was measured as the indicator amino acid. It was determined in seven subjects by examining the effects of varying dietary lysine intake on phenylalanine flux and oxidation under dietary conditions of adequate energy and phenylalanine and excess tyrosine. The subjects consumed 7 different levels of lysine (5, 10, 20, 30, 40, 50, and 60 mg/kg/d).
To such data, a change-point regression model
| yid = β0 + β1I (xid>xcp)(xid – xcp) + β2xid + εid (i = 1,2,…, n, d = 1,2,..., D) |
(Eq1) |
is often applied,(2,9,13) where n is the number of subjects enrolled in the study, D is the dose level of the test amino acid, yid is the observation at the dose of the test amino acid of i, xid is the dose level of the test amino acid of the i-th subject, εid are random errors that are independently normally distributed with mean 0 and variance σ2, and I (xid>xcp) = 1 if xid is equal to or more than xcp and 0 otherwise. xcp is called the change-point. This model has two regression slopes for xid; the slope is β2 for xid less than xcp and β1 + β2 for xid equal to or more than xcp. The model (Eq1) was applied in the Lys study with the estimation procedure given in section 6.5 of Seber and Lee.(13) The estimated change-point was 36.9 mg/kg/d with a 95% confidence interval (15.5–58.2 mg/kg/d) by Fieller’s method.(13) Phenylalanine oxidation, estimated from the rate at which 13CO2 was released in expired air during the infusion of L-[1-13C] phenylalanine, decreased linearly as lysine intake increased up to the mean dietary lysine requirement (36.9 mg/kg/d), which was interpreted as a change point.
Mixed-effect change-point regression model
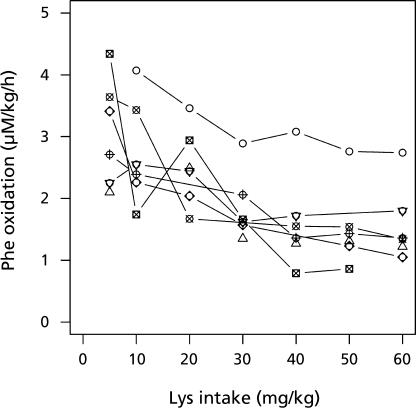
Measurement results for the oxidation of L-[1-13C] phenylalanine and lysine were presented in Table 7 in the article by Zello et al.(8) Fig. 2 of their paper provides a graphical presentation of individual profiles of phenylalanine over a graded lysine dose, in which lines link observations from the same subject. Fig. 2 indicates that 1) the profiles of phenylalanine are likely to saturate even if the intake of lysine increases, and 2) the observations from the same subject seem to be positively correlated (in other words, a subject with a larger observation at some dose is likely to have a larger observation at another dose, and vice versa). The method outlined in the previous sections relies on the assumption that all observations are statistically independent. Thus estimation of the standard errors of the regression coefficient estimate is not valid and the confidence intervals of the change-point by Fieller’s formula are unreliable.
Fig. 2.
Effect of lysine intake on production of 13CO2 from the oxidation of L-[1-13C] phenylalanine (F13CO2).(8) Illustrated is the oxidation response of phenylalanine at varying dietary intakes of lysine. The breakpoint in the oxidation responses has been proposed as the physiological requirement of the test indispensable amino acid for the average individual in the population. The estimated mean lysine requirement according to Zello et al.(8) is 36.9 mg/kg/d.
Accounting for correlations within observations from the same subject, we propose application of linear mixed-effect models(14) for the analysis of data using the tracer approach. The following statistical model is considered,
| yid = β0 + bi + β1I (xid<xcp)(xid – xcp) + εid | (Eq2) |
where bi is a random intercept of the ith subject following a normal distribution. The model Eq2 is different from Eq1 in two points. One is that Eq2 takes into account the within-subject correlation by incorporating random intercept bi. The other is that the slope for xid is 0 for xid more than the change-point. Kurpad et al.(15) applied the model Eq2. We believe that this formulation is more natural for analysis of the amino acid requirement from a biological perspective, but we also examine whether the formulation is more suitable from a statistical perspective. To this end, the following model with any slope for xid more than the change-point,
| yid = β0 + bi + β1I (xid>xcp)(xid – xcp) + β2xid + εid | (Eq3) |
is considered for comparison. To estimate the change-point in Eq2 and Eq3, one may apply the method given by Kurpad et al.(15) It is an extension of the method given in page 160 of Seber and Lee(13) to dependent observations based on a mixed-effect model. However, it requires that one knows whether each observation is less than or more than the change-point. Hayamizu et al.(16) have successfully applied the maximum profile likelihood method to a problem in the area of nutrition to determine a threshold value of a visceral fat area at baseline at which subjects had an anti-obesity benefit from a dietary supplement. We have employed this same method in the present study. With the change-point in Eq2 and Eq3 fixed, these models are special cases of widely used linear mixed models, and thus the maximum restricted likelihood method or the maximum likelihood method can provide estimates of unknown parameters other than the change-point.(14) One can determine the change-point as a value maximizing the likelihood or the restricted likelihood function over the change-point (profile likelihood).
At first we consider the maximum likelihood estimation. We compare the model Eq2 to Eq3 by using AIC. AIC is defined as
| AIC = −2 log (maximum likelihood) + 2p |
where p is the number of unknown parameters to be estimated. The model minimizing AIC is regarded as the model with the best predictive ability.(17) Thus by comparing AIC of the model Eq2 with that of Eq3, we can confirm our assumption that the slope should be set to 0 for xid more than the change-point is supported by data. Note that maximizing the profile likelihood is equivalent to minimizing AIC. Thus one can determine the change-point and compare Eq2 and Eq3 in a unified way by using AIC. When the restricted maximum likelihood estimator is employed, a slightly modified information criteria
| AICr = –2 log (maximum restricted likelihood) + 2p |
is used.
We employ the profile likelihood-based confidence intervals of the change-point. If AIC of the model with a change-point is different more than 4 from the minimum AIC of the optimal change-point, the model is statistically significantly different from the optimal one.(18) With this property, we construct the confidence interval (CI) of the change-point by setting the lower and upper limits with the change-point of the model with AIC equal to the minimum AIC + 4.(18)
All statistical analysis was conducted by R2.10.1 and using the nlme package.(19,20)
Results
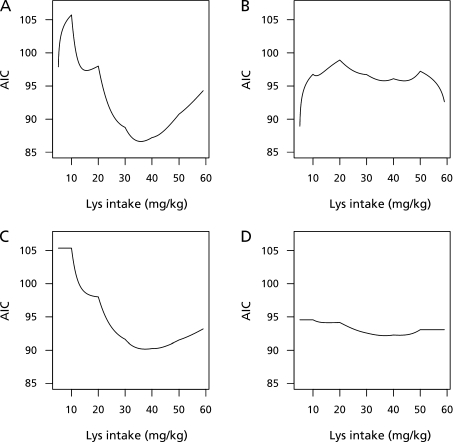
The profile for Eq2 is given in Fig. 3A, indicating that the minimum AIC was 86.6 attained at 35.9 (mg/kg/d) as change-point. The AIC profile for Eq3 is given in Fig. 3B. The minimum AIC in Eq3 was 88.9 attained at 5.1 (mg/kg/d) as change-point. These results indicate that Eq2 fit better than Eq3 because AIC for Eq2 was smaller then Eq3 significantly. Therefore, after the change-point 35.9 (mg/kg/d), the slope is flat. The change-point 5.1 (mg/kg/d) obtained from Eq3 is far from 36.9 (mg/kg/d), which was reported by Zello et al.,(8) and inconsistent with the graphical plot (Fig. 2). This inconsistency may be due to instability of the estimation of AIC with a small or large change-point since β1 or β2 may strongly rely on a small number of observations. In this sense, Eq3 is not recommended.
Fig. 3.
AIC profiles of Eq1, Eq2, Eq3, and Eq4. Panels A, B, C, and D represent Eq2, Eq3, Eq4, and Eq1, respectively. The change-points of Eq1–4 that are estimated from minimum AIC are 35.9, 5.1, 37.5, and 36.9 (mg/kg/d) respectively. The best-fitted model is Eq2 with a change-point of 35.9 (mg/kg/d).
Furthermore to evaluate the influence of ignore within-subject correlations, the following model
| yid = β0 + β1I (xid<xcp)(xid – xcp) + εid | (Eq4) |
is applied, which is a counterparts of Eq2 without a random intercept.
For comparison, a profile of AIC over the change-point and the change-point attaining the minimum for Eq4 and Eq1 are presented in Fig. 3 C and D respectively. The minimum AIC for the model Eq1 was 92.2 with a change-point of 36.9 (mg/kg/d) and for Eq4 was 90.2 with a change-point of 37.5 (mg/kg/d). AIC for Eq2 (86.6) was smaller than that for Eq1 (92.2) and Eq4 (90.2), indicating that accounting for within-subject correlation improves the model fit to data.
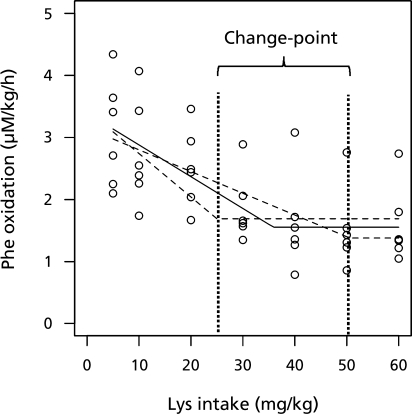
The procedure for having a CI of the change-point is illustrated in Fig. 4. The solid line is the mean profile over the lysine intake of the model Eq2 with an optimal (minimum) AIC. The two dashed lines represent the mean profile of the model with AIC, the optimal plus 4. The dotted vertical lines show the change-points of the two models and represent the confidence interval of the change-point. In such a way, 95% CI based on Eq2 was obtained as 25.0–50.6 (mg/kg/d). Similarly, the 95% CI based on Eq4 is obtained as 23.7–ND (mg/kg/d). By accounting for within-dependence among observations, a much narrower confidence interval is obtained.
Fig. 4.
Mean profiles of the oxidation of L-[1-13C] phenylalanine over the lysine intake on the production of 13CO2 by the model Eq2. Solid line means the optimal (minimum) AIC , as well as those with AIC, the optimal plus 4 (dashed line). Dotted vertical lines present the change-points of the model with AIC, the optimal plus 4, and are the lower and upper 95% confidence limits of the change-point.
Discussion
In this paper, we introduce two models (Eq2 and Eq3), which are the mixed-effect change-point regression models for determining amino acid requirements based on the tracer approach. We propose that the amino acid requirements can be determined by estimating the change point with AIC. We believe that the model Eq2 is more appealing than the model Eq3 since the amount of indicator amino acid is anticipated to be constant once the metabolite used as the test amino acid is saturated. AIC enable us to make a data-oriented comparison of the model Eq2 with the model Eq3. The AIC-based method also provides a simple means of constructing the confidence interval of the change point.
To our best knowledge, almost all the change-point models previously applied to determine the amino acid requirement have assumed independence of observations. We take into account the within-subject dependence by introducing mixed-effect modeling, which is widely used in various areas.(14) We found that accounting for the within-subject dependence may provide us with the benefit of a narrower confidence interval for the change-point than previous methods. Thus we recommend using the mixed-effect models for determining the amino acid requirements using the tracer approach.
Regarding this point, however, Kurpad et al.(15) are an exception. They have introduced the concept of mixed-effect model-based inference, applying an extended version of the method given in Seber and Lee.(13) However, their method requires that the change-point lie within a certain range in advance, which is, in practice, a difficult task. In contrast, the method that we have proposed herein does not have this requirement.
Instead of AIC, one can employ other information criteria such as the Schwarz’s Bayesian Information Criteria (BIC). BIC is also a commonly used indicator for model selection.(21) Pillai et al.(10) have used both AIC and BIC to compare different variance covariance structures, but not to determine the change-point. We also examined the profile of BIC to estimate the change-point with Eq2, and we detected the same change-point (35.9 (mg/kg/d)) as with the AIC-based method (data not shown). The proposed method can easily be carried out with the standard software including SAS, S-plus, and R. In SAS, PROC MIXED is available to fit the linear mixed-effect model. In S-plus and R, the nlme package is the counterpart. R developed by the R Project Team is in particular quite attractive for nutrition researchers since it is free software that can be easily downloaded from the website. In the appendix, a program code for the proposed method is presented.
Conclusion
We demonstrated usefulness of mixed-effect change-point regression model for estimation of amino acid requirement study. The proposed method can easily be applied with a standard software package, and we found that appropriate accounting for within-subject dependence may lead to a much narrower confidence interval.
Abbreviations
- AIC
Akaike information criteria
- BIC
Schwarz’s Bayesian Information Criteria
- CI
confidence interval
- DAAB
direct amino acid balance
- DAAO
direct amino acid oxidation
- IAAO
indicator amino acid oxidation
- ONL
obligatory nitrogen loss
Appendix I
attach(Dataset)
Dataset
ID  Subject  Lys  PheOx
2      AD     5   2.10
3      PS     5   2.71
4      BR     5   3.64
5      SM     5   3.41
6      PM     5   2.25
7      SG     5   4.34
1      CC    10   4.07
3      PS    10   2.39
4      BR    10   3.43
5      SM    10   2.26
6      PM    10   2.55
7      SG    10   1.74
1      CC    20   3.46
2      AD    20   2.49
4      BR    20   1.67
5      SM    20   2.04
6      PM    20   2.44
7      SG    20   2.94
1      CC    30   2.89
2      AD    30   1.35
3      PS    30   2.06
5      SM    30   1.57
6      PM    30   1.62
7      SG    30   1.66
1      CC    40   3.08
2      AD    40   1.27
3      PS    40   1.36
4      BR    40   1.55
6      PM    40   1.72
7      SG    40   0.79
1      CC    50   2.76
2      AD    50   1.31
3      PS    50   1.43
4      BR    50   1.54
5      SM    50   1.23
7      SG    50   0.86
1      CC    60   2.74
2      AD    60   1.22
3      PS    60   1.36
4      BR    60   1.34
5      SM    60   1.05
6      PM    60   1.80
library(nlme)
AIC<-rep(1,length=540)
BOX<-matrix(1:1080,nrow=2) for (i in 1:540)
{
x1<-5+i*0.1
X<-I((Lys<x1)*(Lys-x1))
data13<-groupedData
(PheOx~X|Subject,data=Dataset)
Eq2<-lme(PheOx~X, data=data13, random = ~ 1|Subject)
AIC[i]<-AIC(Eq2)
BOX[1,i]<-AIC[i]
BOX[2,i]<-x1
}
aic<-BOX[1,]
lysine_intake<-BOX[2,]
plot(lysine_intake,aic,type="l",ylim=c(85,107),xlab="Lys intake(mg/kg)",ylab="AIC")
mm<-BOX[,order(BOX[1,])]
mm[,1]
bp<-mm[2]
X2<-I((Lys<bp)*(Lys-bp))
Eq22<-lme(PheOx~X2,data=data13,
random = ~ 1|Subject)
summary(Eq22)
References
- 1.Zello GA, Wykes LJ, Ball RO, Pencharz PB. Recent advances in methods of assessing dietary amino acid requirements for adult humans. J Nutr. 1995;125:2907–2915. doi: 10.1093/jn/125.12.2907. [DOI] [PubMed] [Google Scholar]
- 2.Kurpad AV, Regan MM, Raj T, Gnanou JV. Branched-chain amino acid requirements in healthy adult human subjects. J Nutr. 2006;136:256S–263S. doi: 10.1093/jn/136.1.256S. [DOI] [PubMed] [Google Scholar]
- 3.Joint WHO/FAO/UNU Expert Consultation, author. Protein and amino acid requirements in human nutrition. World Health Organ Tech Rep Ser. 2007;935:1–265. [PubMed] [Google Scholar]
- 4.Young VR, Marchini JS. Mechanisms and nutritional significance of metabolic responses to altered intakes of protein and amino acids, with reference to nutritional adaptation in humans. Am J Clin Nutr. 1990;51:270–289. doi: 10.1093/ajcn/51.2.270. [DOI] [PubMed] [Google Scholar]
- 5.Young VR, Bier DM, Pellett PL. A theoretical basis for increasing current estimates of the amino acid requirements in adult men with experimental support. Am J Clin Nutr. 1989;50:80–92. doi: 10.1093/ajcn/50.1.80. [DOI] [PubMed] [Google Scholar]
- 6.Kim KI, McMillan I, Bayley HS. Determination of amino acid requirements of young pigs using an indicator amino acid. Br J Nutr. 1983;50:369–382. doi: 10.1079/bjn19830104. [DOI] [PubMed] [Google Scholar]
- 7.Ball RO, Bayley HS. Tryptophan requirement of the 2.5-kg piglet determined by the oxidation of an indicator amino acid. J Nutr. 1984;114:1741–1746. doi: 10.1093/jn/114.10.1741. [DOI] [PubMed] [Google Scholar]
- 8.Zello GA, Pencharz PB, Ball RO. Dietary lysine requirement of young adult males determined by oxidation of L-[1-13C]phenylalanine. Am J Physiol. 1993;264:E677–E685. doi: 10.1152/ajpendo.1993.264.4.E677. [DOI] [PubMed] [Google Scholar]
- 9.Kriengsinyos W, Wykes LJ, Ball RO, Pencharz PB. Oral and intravenous tracer protocols of the indicator amino acid oxidation method provide the same estimate of the lysine requirement in healthy men. J Nutr. 2002;132:2251–2257. doi: 10.1093/jn/132.8.2251. [DOI] [PubMed] [Google Scholar]
- 10.Pillai RR, Elango R, Muthayya S, Ball RO, Kurpad AV, Pencharz PB. Lysine requirement of healthy, school-aged Indian children determined by the indicator amino acid oxidation technique. J Nutr. 2010;140:54–59. doi: 10.3945/jn.109.113357. [DOI] [PubMed] [Google Scholar]
- 11.Chapman KP, Courtney-Martin G, Moore AM, et al. Lysine requirement in parenterally fed postsurgical human neonates. Am J Clin Nutr. 2010;91:958–965. doi: 10.3945/ajcn.2009.28729. [DOI] [PubMed] [Google Scholar]
- 12.Zello GA, Pencharz PB, Ball RO. Phenylalanine flux, oxidation, and conversion to tyrosine in humans studied with L-[1-13C]phenylalanine. Am J Physiol. 1990;259:E835–E843. doi: 10.1152/ajpendo.1990.259.6.E835. [DOI] [PubMed] [Google Scholar]
- 13.Seber GAF, Lee AJ. Linear regression analysis second edition. New Jersey: John Wiley and Sons Inc.; 2003. pp. 159–161. [Google Scholar]
- 14.Fitzmaurice GM, Laird NM, Ware JH. Applied longitudinal analysis. New Jersey: John Wiley and Son Inc.; 2004. pp. 187–236. [Google Scholar]
- 15.Kurpad AV, Raj T, Ragan MM, et al. Threonine requirements of healthy Indian men, measured by a 24-h indicator amino acid oxidation and balance technique. Am J Clin Nutr. 2002;76:789–797. doi: 10.1093/ajcn/76.4.789. [DOI] [PubMed] [Google Scholar]
- 16.Hayamizu K, Yamashita N, Hattori S, Kakuma T. A change-point regression approach for efficacy evaluation of dietary supplement. J Clin Biochem Nutr. 2009;44:285–290. doi: 10.3164/jcbn.08-245. [DOI] [PMC free article] [PubMed] [Google Scholar]
- 17.Akaike H. Information theory and an extension of the maximum likelihood principle. In: Kotz S, Johnson NL, editors. Breakthroughs in Statistics Vol.1. New York: Springer-Verlag New York Inc.; 1992. pp. 610–624. [Google Scholar]
- 18.Burnham KH, Anderson DR. Model selection and multimodel inference. 2nd ed. New York: Springer-Verlag New York Inc.; 2002. pp. 169–172. [Google Scholar]
- 19.The R foundation for Statistical Computing, author. http://www.r-project.org/
- 20.The R Core team. nlme package. http://cran.opensourceresources.org/
- 21.Schwarz GE. Estimating the dimension of a model. Annals of Statistics. 1978;6:461–464. [Google Scholar]


