

Abstract
A three-channel spectrometer (3CS) based on a commercial digital camera was developed to distinguish among tens of large (>100 nm), anisotropic plasmonic particles with various shapes, orientations, and compositions on a surface simultaneously. Using band pass filters and polarizers, the contrast of 3CS images could be enhanced to identify specific orientation and composition characteristics of gold and gold-silver nanopyramids and as well as the direction of the longest arm of gold nanostars.
Keywords: Anisotropic metal particles, wide-field optical imaging, digital camera
INTRODUCTION
Wide-field optical imaging is a technique that enables the field visible to the objective and CCD detector to be recorded simultaneously.1 One challenge of using this method for biological imaging is that common optical probes such as fluorophores are susceptible to photobleaching and molecular degradation, and quantum dots need surface passivation to avoid cytotoxicity.1,2 Recently, large (> 80 nm) noble metal nanoparticles (NPs) have been introduced as an alternative contrast agent because their tunable localized surface plasmon (LSP) response can result in strongly scattered light in the far-field.2-5 The scattering from a single large NP can generate a brighter signal than fluorophores or quantum dots and can be observed and characterized by dark-field (DF) imaging and spectroscopy.5-7 Therefore, single metal NPs are useful probes to characterize NP diffusion,8 observe aggregation events,9 and monitor molecular-directed assembly.10
Although the use of metal NPs for contrast in optical applications have shown promise, single-particle analysis by DF spectroscopy limits simultaneous characterization of unknown NPs.8-10 Particles can be deliberately designed, however, to exhibit optical properties that are easy to interpret in a wide-field optical image. For example, nanobarcodes fabricated by alternately depositing different metals layer-by-layer into anodized alumina templates can be generated with unique optical reflectance signatures.11-13 Mixtures of small (< 30 nm) NPs, such as Au nanospheres, Au nanorods, and Ag nanospheres, can be used as contrast agents at the same time because they scatter light at very different LSP wavelengths.14 Shape can also be used to discriminate among particles; Au nanostars with iron oxide cores display a periodic oscillating scattering signal under a rotating, external magnetic field.4,15-17 In addition, large (> 250 nm) anisotropic NPs have complex, multipolar spectral features that can be resolved in a single particle spectra, which can provide bright contrast in DF,18,19 but in a wide-field image, all the particles appear to scatter the same “color”. Thus a simple, spectroscopic technique that can characterize many different types of anisotropic NPs simultaneously would enable the more wide-spread use of metal NPs as scattering probes.
This paper describes how a commercial digital camera can function as a three-channel spectrometer (3CS) to characterize tens of large plasmonic NPs simultaneously. The inclusion of band pass filters and linear polarizers enabled refinement of 3CS images to determine specific geometrical NP features. To demonstrate the capabilities of the 3CS, we analyzed three types of large (>100 nm) anisotropic particles in which single-particle spectroscopy was previously required to correlate their structure and optical properties. First, we determined the relative orientation of 3D anisotropic nanopyramids on a substrate. Second, we differentiated among particles based on relative composition by identifying Au-only and Au/Ag/Au multilayered nanopyramids. Last, we determined the direction of the longest arms of Au nanostars.
EXPERIMENTAL SECTION
Materials and Optical Measurement Setup
The chemicals and reagents for NP synthesis were used without further purification: absolute ethanol (EtOH, Sigma-Aldrich), hexane (Sigma-Aldrich), cetyltrimethylammonium bromide (CTAB, Fluka, > 96%), tetrachloroauric (III) acid trihydrate (HAuCl4·3H2O, Sigma-Aldrich, 99.9%), silver (I) nitrate (AgNO3, Sigma-Aldrich, 99%), L-ascorbic acid (Sigma-Aldrich, 99%), iron (III) acetylacetonate (Fe(acac)3, Sigma-Aldrich, 99%), 1,2-hexadecanediol (Sigma-Aldrich, 97%), oleic acid (Sigma-Aldrich, 99%), oleylamine (Sigma-Aldrich, >70%), benzyl ether (Sigma-Aldrich 99%), diphenyl ether (99%), and gold (III) acetate (Au(O2CCH3)3, Alfa Aesar, 99%).
The NP scattering response (in n = 1.525 immersion oil) was characterized using an inverted optical microscope (Nikon TE2000-U), a variable NA objective (100X, NA = 0.5), a dark-field condenser (NA = 0.80–0.95), and a halogen-lamp light source. Scattering spectra were collected with a liquid N2-cooled imaging CCD (Princeton Instruments Acton SP2300 spectrometer). Color digital images for 3CS analysis were obtained using Nikon D50 or 60 SLR digital cameras attached to the front port of the microscope. The unmodified camera (VIScam) had spectral ranges of: blue (B) 380-530 nm, green (G) 430-620 nm, and red (R) 550-720 nm.20 The modified camera (NIRcam), where the NIR/UV blocking filter was removed, had channels of B (380-530 nm), G (430-620 nm), and R (550-1000 nm). Note: an increased spectral response around 850 nm was observed for both the B and G channels when the NIR/ UV filter was removed. NP imaging substrates were prepared by drop-casting an aqueous suspension of NPs onto ITO substrates (Delta Technologies, n = 1.80) marked with Au reference grids. The reference grids were indexed alphanumerically, which enabled specific NP shapes and orientations to be correlated directly to SEM images, single-particle DF spectra, and RGB channel data. Refinements and enhancements of the 3CS data were obtained by inserting a linear polarizer or band pass filter in the light path below the objective.
Preparation of Nanoparticles
Nanopyramid Fabrication
Au (t = 20 nm) and Au/Ag/Au (t = 10/20/10 nm) nanopyramids (d = 350 nm) were fabricated using PEEL as described previously.19 In brief, an array of photoresist posts was patterned by phase-shifting photolithography on a Si (100) wafer. A Cr adhesion layer (t = 20 nm) was deposited by e-beam, and the photoresist posts were lifted-off by sonication in acetone and 1165 photoresist remover (Microchem). The exposed Si regions were then etched in an anisotropic KOH etch to form pyramidal pits. Au or Au/Ag/Au was then deposited by e-beam onto the template. The overlying metal film was then dissolved in Cr etchant (Transene), and the pyramids were removed from the Si template by etching the substrate in aqueous 6 M KOH. The pyramids were then washed several times by centrifugation at 10000 RPM followed by resuspension of the pellet in distilled water.
Nanostar Synthesis
Gold nanostars (AuNSs) were synthesized by a surfactant-directed Au reduction in Fe3O4-Au core-shell seeds.15,21,22 In brief, the Fe3O4 seeds were formed using a preparation by Sun et. al.,21 and the seeds were then coated in an Au-shell following a procedure by Wang et. al.22 The stars were then grown by combining 8-12 μL of seeds with a growth solution composed of sequentially mixed aqueous solutions of 4.75 mL of 100 mM CTAB, 0.2 mL of 10 mM HAuCl4, 0.03 mL of 10 mM AgNO3, and 0.032 mL of 100 mM L-ascorbic acid. After 24 h, the purple solution was washed twice by centrifuging the stars into a pellet followed by resuspension in distilled water.15
Analysis of 3CS Data
The average color intensity of scattering spots from NPs in a dark-field 3CS image was determined using an algorithm programmed in MATLAB (Figure S1). In brief, the image was decomposed into three separate layers: R, G, and B. The bright spots in the image were then differentiated from the background by converting the image into black and white, and a threshold value related to intensity was used to distinguish scatters from the substrate. An area of approximately 8 pixels, centered on the brightest pixel of each scattering spot, was used to define the region over which the R, G, and B intensity values were averaged. These values comprised a rudimentary 3-channel spectrum. Based on the 3CS and known single-particle spectra for each particle, a differentiation scheme to distinguish among particles was then determined, and the calibration information was subsequently inserted into the algorithm.
RESULTS AND DISCUSSION
Figure 1A shows the scheme for the 3CS to image NPs. NP samples were illuminated with white light from a halogen source through a high numerical aperture (NA) DF condenser, and the scattered light was collected by a low NA objective. The scattered light was either dispersed onto (1) a Si CCD attached to a spectrometer to generate a single-particle spectrum that served as a calibration standard (Figure 1B), or (2) a digital camera, which was used to collect 3CS images (Fig. 1C). The digital camera image was then processed with a MATLAB program to generate a rudimentary “spectrum” of RGB intensity values for each NP scattering spot (Figure 1D). The imaging and processing capabilities of the 3CS could be improved by incorporating band pass (BP) filters to improve contrast at the LSP wavelength or linear polarizers to identify NP asymmetry.
Figure 1. Scheme using a digital camera as a three-channel spectrometer (3CS).

(A) DF scattering setup. (B) Simulation of single-particle scattering spectra of two different anisotropic particles (indicated by ◆ and ○) with scattering intensities that are similar at longer wavelengths but different at shorter wavelengths. (C) Simulation of a wide-field image of two different anisotropic particles (◆ and ○). (D) RGB channel intensities from the VIScam and NIRcam images using MATLAB. The histograms demonstrate the relative RGB intensities for the two types of particles.
Figure 1D summarizes the key steps necessary to distinguish between two different types of model particles (enclosed by diamonds and circles) using the 3CS. First, the area defined by a single scatterer was identified, and the RGB intensity values (0-255) from each pixel were averaged. To calibrate the system, the RGB intensity values were plotted as a histogram and compared to the single-particle spectra (Fig. 1B). A ratio of the R to G-channel values (R/G) was used to eliminate variations in measured RGB values; different particle types could be readily determined by higher or lower R/G ratios. For this example, the R/G values clustered into two regions, R/G ≈ 35 (◆) and R/G ≈ 3 (○). Automatic differentiation in MATLAB was achieved by applying an R/G ratio threshold that falls between these values. The NIRcam differentiated the R-channel contributions even more (R/G ≈ 95 (◆) and at R/G ≈ 9 (○)) compared to the VIScam.
The first system tested was fabricated Au nanopyramids that were fairly monodisperse (>90%)18 and that exhibited orientation-dependent optical properties.19 Single-particle DF spectra of Au nanopyramids (shell thickness t = 20 nm and based diameter d = 350 nm) had multiple, broad plasmonic resonances between 550 nm and 750 nm (Figure 2A). The tip-up (U) nanopyramids scattered light at wavelengths < 750 nm more strongly than the tip-down (D) ones. To determine the best way to distinguish between U and D using the 3CS, we first imaged the substrate with VIScam (Figure 2B, left image). All of the particles scattered yellow light with similar intensity. Single-channel analysis of the VIScam RGB values showed no significant difference among the particles, and the R/G ratio did not improve the differentiation in signal. The R/G ratio showed more pronounced differences when the NIRcam was used (Figure 2C); however, because R/G of U and D nanopyramids was still very close, we inserted an 850 nm (± 20 nm) BP filter to separate the R/G values further (Figure 2D) because of their large spectral intensity difference at this wavelength (Figure 2A). The R/G ratio demonstrated a clear divide between the two orientations. After this calibration for five particles, we applied this R/G ratio value (= 3.2) to a larger field of view of randomly oriented particles (Figure 3A-C and Figure S2). As Figure 3D indicates, the threshold R/G value of 3.2 falls between the U and D nanopyramids with no overlap. The automated assignments were found to match the orientations identified by SEM with 100% accuracy.
Figure 2. Calibration measurement to distinguish between tip-up and tip-down orientations in Au nanopyramids.

(A) Single-particle spectra of Au nanopyramids (d = 350 nm, t = 20 nm) with a tip-up (U) ( ) and tip-down (D) (▲) orientation. (B) VIScam image and R/G values for five Au pyramids. The particles scatter very similar colors and have very similar R/G values. (C) NIRcam image and R/G values for the same image in (B). The particles still scatter very similar colors, although the R/G values for pyramids 1 and 2 begin to separate from pyramids 3, 4, 5. (D) NIRcam image with 850 nm (± 20 nm) BP filter and R/G values for the same image in (B). The R/G values separate into two distinct regions that correspond to U and D. The threshold value was set at 3.2. All optical images are 12 μm × 9.3 μm.
Figure 3. Determination of nanopyramid orientation in a larger field of view.

(A) VIScam image of thirty-five (d = 350 nm, t = 20 nm) nanopyramids. (B) NIRcam image of the same area. (C) NIRcam image of (B) with 850 nm (± 20 nm) BP with orientations identified based on a threshold of 3.2 from Figure 2. (D) Histogram of R/G from (C).
Next, we tested the capability of the 3CS to differentiate NPs of the same size and shape but with different composition. Because we can control the composition of pyramidal nanoparticles using PEEL,19 we fabricated nanopyramids with Au (t = 40 nm) or Au/Ag/Au (t = 10/20/10 nm). The differences in spectral character can be attributed to differences in composition. First, to separate the Au and Au/Ag/Au particles, the sample was imaged with the VIScam and refined with a BP = 580 nm (± 20 nm) since single-particle spectra showed large differences at green wavelengths (Figure 4A). Consistent with the single-particle data, the intensity difference in the G-channel enabled the MATLAB program to differentiate between Au and Au/Ag/Au without needing the R/G ratio (Figure 4B and Figure S3). The histogram of G-values demonstrated that the particles clustered into two groups based on composition (Figure 4C). A single Au/Ag/Au pyramid was incorrectly identified as Au because of particle deformation, which shifted the LSP to longer wavelengths. Importantly, the relative orientations of the Au pyramids could also be assigned by adding an 850-nm BP filter (Figure 4D). Orientation assignment for Au/Ag/Au pyramids could not be determined, however, because the scattering profile of the U vs. D Au/Ag/Au pyramids was nearly identical across the visible and NIR wavelengths (Figure 4A).
Figure 4. Determination of Au and Au/Ag/Au pyramids on the same substrate.

(A) Single-particle DF scattering spectra of Au (d = 350 nm, t = 40 nm) and Au/Ag/Au (d = 350 nm, t = 10/20/10 nm) pyramids. Spectra are offset for clarity. The dashed lines indicate the location of the BP filters (580 nm and 850 nm) used to refine the 3CS images. Insets: SEM images of Au and Au/Ag/Au pyramids in U and D orientations. Images are 400 nm × 400 nm. (B) VIScam image with a 580-nm BP filter, where the G-channel intensity for thirteen Au and Au/Ag/Au pyramids is shown. (C) Histogram of G intensities separate into two regions corresponding to either Au or Au/Ag/Au. (D) NIRcam image with 850-nm BF filter enables assignment of U and D for the Au pyramids.
In addition to large fabricated anisotropic NPs, we identified prominent geometrical features of smaller NPs using the 3CS. We investigated AuNSs, which are nanoparticles with randomly-oriented star points or asperities.15 We selected three adjacent particles whose VIScam RGB values were similar (Figure 5A) to investigate whether the 3CS could distinguish the orientation of the longest arm. This level of structural identification is not possible from the diffraction-limited spot sizes. The three particles each had a unique shape: particle 1 has many points (Figure 5B), particle 2 has with a single point (Figure 5C), and particle 3 is an Au-bipyramid (Figure 5D). We then used the NIRcam combined with an 850 nm (±20 nm) BP and a polarizer to identify the orientation of the longest wavelength asperity on each structure, which is indicated by the dashed lines on the SEM images. Initially, the sample was imaged with the NIRcam and a polarizer (Figure S4), but the insertion of an 850-nm BP filter was required to improve the sensitivity because the particle had multiple resonances in their single-particle spectra (Figure S5). Because the star points exhibit increased scattering when aligned with the direction of the polarizer,15 we observed RGB values that increased or decreased at various polarization angles. The R intensities for each scatterer were plotted for the range of polarizer angles (0-360° in 10° increments) in a circular polar plot. Each plot showed lobed features that corresponded to the orientation of the arms, indicating a dipolar LSP resonance corresponding to the structural feature. Note that additional resonances were present in the single-particle spectra but were not captured in the 3CS (Figure S6), which lacks fine spectral resolution because of the overlap between the digital RGB channels (e.g. the resonances at 690 nm falls within both the R and G channel). This feature is one drawback of the 3CS for resolving multiple resonances that are closely spaced in wavelength.
Figure 5. Determination of geometrical features of small NPs.
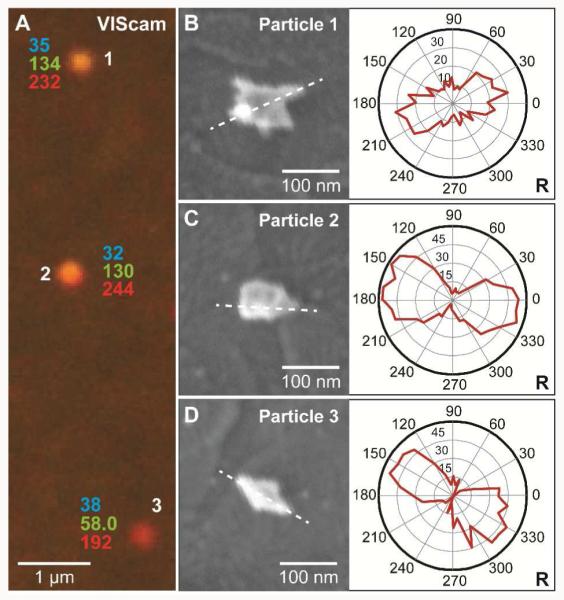
(A) VIScam image of three AuNSs and their RGB-channel intensities. (B-D) SEM images and polar plots for each AuNS. Dashed lines highlights the longest arm of each structure. Polar plots of R intensities from NIRcam and 850-nm BP filter were obtained every 10° from 0° to 360° (integration time of 30 s). The lobbed-feature correlates to a dipolar LSP resonance.
CONCLUSION
In summary, 3CS is a wide-field spectroscopic imaging method that can distinguish among tens of large (>100 nm) plasmonic particles with various shapes, orientations, and compositions. This method enables parallel, simultaneous NP characterization and can simplify single-particle spectroscopy when the optical properties of the NPs are known. To further increase the successful identification of particles, 3CS images can be refined by adding polarizers and band pass filters, which allow tailoring of the technique to identify specific characteristics of different particle types. Hundreds of particles with multiple shapes can now be characterized with just a few wide-field images and a calibration file. In addition, when a digital camera is used as a 3CS, NPs can be treated as machine-countable nanoprobes useful for multiplexed imaging. Thus, 3CS has the potential to facilitate low-cost, high through-put applications such as WF imaging of nanoparticle uptake by cells.
Supplementary Material
ACKNOWLEDGMENTS
This work was supported by the NSF National Center for Learning and Teaching (NCLT) (ESI-0426328) (C.M.S), the NIH-NRSA award (1 F32 EB008338-01 A2) (C.L.N), the CCNE at Northwestern University (NU) (NCI U54CA119341) (T.W.O, T.J.M), the John N. Nicholson fellowship from the Northwestern University (T.L. and A.E.), the National Institute of Biomedical Imaging and Bioengineering Award (2R01EB005866) and the NIH Director’s Pioneer Award (DP1OD003899) (T.W.O) . This work used the NUANCE, QBIC, and IMSERC Center facilities, which are supported by NSF-MRSEC, NSF-NSEC and the Keck Foundation.
Footnotes
SUPPORTING INFORMATION AVAILABLE
Detailed description of MATLAB algorithm. Table of RGB values for imaging conditions for Au nanopyramid and Au/Ag/Au nanopyramids. Polar plots of NIRcam analysis for AuNSs. RGB histogram of AuNS with VIScam and NIRcam (BP = 850 nm). Polarization-dependent single-particle spectra for AuNS. This material is available free of charge via the Internet at http://pubs.acs.org.
REFERENCES
- (1).Stephens DJ, Allan VJ. Science. 2003;300:82. doi: 10.1126/science.1082160. [DOI] [PubMed] [Google Scholar]
- (2).Penn SG, He L, Natan MJ. Curr. Opin. Chem. Biol. 2003;7:609. doi: 10.1016/j.cbpa.2003.08.013. [DOI] [PubMed] [Google Scholar]
- (3).Bohren C, Huffman DR, editors. Absorption and Scattering of Light by Small Particles. Wiley-VCH; New York: 1999. [Google Scholar]
- (4).Jain P, Huang X, El-Sayed I, El-Sayed M. Plasmonics. 2007;2:107. [Google Scholar]
- (5).Jain PK, Lee KS, El-Sayed IH, El-Sayed MA. J. Phys. Chem. B. 2006;110:7238. doi: 10.1021/jp057170o. [DOI] [PubMed] [Google Scholar]
- (6).Xia Y, Halas NJ. MRS Bull. 2005;30:338. [Google Scholar]
- (7).Rodriguez-Gonzalez B, Burrows A, Watanabe M, Kiely CJ, Liz Marzan LM. J. Mater. Chem. 2005;15:1755. [Google Scholar]
- (8).Bingham JM, Willets KA, Shah NC, Andrews DQ, Van Duyne RP. J. Phys. Chem. C. 2009;113:16839. doi: 10.1021/jp907377h. [DOI] [PMC free article] [PubMed] [Google Scholar]
- (9).Louit G, Asahi T, Tanaka G, Uwada T, Masuhara H. J. Phys. Chem. C. 2009;113:11766. [Google Scholar]
- (10).Aaron J, Travis K, Harrison N, Sokolov K. Nano Lett. 2009;9:3612. doi: 10.1021/nl9018275. [DOI] [PMC free article] [PubMed] [Google Scholar]
- (11).Nicewarner-Peña SR, Freeman RG, Reiss BD, He L, Peña DJ, Walton ID, Cromer R, Keating CD, Natan MJ. Science. 2001;294:137. doi: 10.1126/science.294.5540.137. [DOI] [PubMed] [Google Scholar]
- (12).Keating CD, Natan MJ. Adv. Mater. (Weinheim, Ger.) 2003;15:451. [Google Scholar]
- (13).Walton ID, Norton SM, Balasingham A, He L, Oviso DF, Gupta D, Raju PA, Natan MJ, Freeman RG. Anal. Chem. (Washington, DC, U. S.) 2002;74:2240. doi: 10.1021/ac020073w. [DOI] [PubMed] [Google Scholar]
- (14).Hu R, Yong K-T, Roy I, Ding H, He S, Prasad PN. J. Phys. Chem. C. 2009;113:2676. doi: 10.1021/jp8076672. [DOI] [PMC free article] [PubMed] [Google Scholar]
- (15).Nehl CL, Liao H, Hafner JH. Nano Lett. 2006;6:683. doi: 10.1021/nl052409y. [DOI] [PubMed] [Google Scholar]
- (16).Hao F, Nehl CL, Hafner JH, Nordlander P. Nano Lett. 2007;7:729. doi: 10.1021/nl062969c. [DOI] [PubMed] [Google Scholar]
- (17).Wei Q, Song H-M, Leonov AP, Hale JA, Oh D, Ong QK, Ritchie K, Wei A. J. Am. Chem. Soc. 2009;131:9728. doi: 10.1021/ja901562j. [DOI] [PMC free article] [PubMed] [Google Scholar]
- (18).Henzie J, Kwak E-S, Odom TW. Nano Lett. 2005;5:1199. doi: 10.1021/nl0506148. [DOI] [PubMed] [Google Scholar]
- (19).Lee J, Hasan W, Lee MH, Odom TW. Adv. Mater. (Weinheim, Ger.) 2007;19:4387. [Google Scholar]
- (20).Mauer C, Wueller D. Proc. SPIE. 2009;7250:72500S. [Google Scholar]
- (21).Sun S, Zeng H, Robinson DB, Raoux S, Rice PM, Wang SX, Li G. J. Am. Chem. Soc. 2003;126:273. doi: 10.1021/ja0380852. [DOI] [PubMed] [Google Scholar]
- (22).Wang L, Luo J, Fan Q, Suzuki M, Suzuki IS, Engelhard MH, Lin Y, Kim N, Wang JQ, Zhong C-J. J. Phys. Chem. B. 2005;109:21593. doi: 10.1021/jp0543429. [DOI] [PubMed] [Google Scholar]
Associated Data
This section collects any data citations, data availability statements, or supplementary materials included in this article.