Abstract
Previously, we introduced a computational procedure based on three-dimensional meshless generalized finite difference (MGFD) method and serial magnetic resonance imaging (MRI) data to quantify patient-specific carotid atherosclerotic plaque growth functions and simulate plaque progression. Structure-only models were used in our previous report. In this paper, fluid-stricture interaction (FSI) was added to improve on prediction accuracy. One participating patient was scanned three times (T1, T2, and T3, at intervals of about 18 months) to obtain plaque progression data. Blood flow was assumed to laminar, Newtonian, viscous and incompressible. The Navier-Stokes equations with arbitrary Lagrangian-Eulerian (ALE) formulation were used as the governing equations. Plaque material was assumed to be uniform, homogeneous, isotropic, linear, and nearly incompressible. The linear elastic model was used. The 3D FSI plaque model was discretized and solved using a meshless generalized finite difference (GFD) method. Growth functions with a) morphology alone; b) morphology and plaque wall stress (PWS); morphology and flow shear stress (FSS), and d) morphology, PWS and FSS were introduced to predict future plaque growth based on previous time point data. Starting from the T2 plaque geometry, plaque progression was simulated by solving the FSI model and adjusting plaque geometry using plaque growth functions iteratively until T3 is reached. Numerically simulated plaque progression agreed very well with the target T3 plaque geometry with errors ranging from 8.62%, 7.22%, 5.77% and 4.39%, with the growth function including morphology, plaque wall stress and flow shear stress terms giving the best predictions. Adding flow shear stress term to the growth function improved the prediction error from 7.22% to 4.39%, a 40% improvement. We believe this is the first time 3D plaque progression FSI simulation based on multi-year patient-tracking data was reported. Serial MRI-based progression simulation adds time dimension to plaque vulnerability assessment and will improve prediction accuracy for potential plaque rupture risk.
Keywords: meshless, generalized finite difference, artery, plaque progression, fluid-structure interaction, atherosclerosis
1 Introduction
A large number of fatal clinical events such as heart attack and stroke are caused by rupture of a vulnerable atherosclerotic plaque [Fuster (1998); Fuster et al. (1990); Naghavi et al. (2003a, 2003b)]. One main challenge for the researchers and clinicians is that many victims of the disease who are apparently healthy die suddenly without prior symptoms. Considerable effort has been devoted investigating mechanisms governing atherosclerotic plaque progression and rupture [Boussel et al. (2009); Friedman, Bargeron, Deters, Hutchins and Mark (1987); Dhawan et al. (2010); Friedman and Giddens (2005); Giddens, Zarins, Glagov, S. (1993); Kaneda, Ako, Terashima (2010): Ku, Giddens, Zarins and Glagov (1985); Gibson et al. (1993); Koskinas et al. (2009, 2010); Liu and Tang (2010); Scotti et al. (2005); Stone et al. (2003); Yang, Tang, Atluri et al. (2008,2010); Yang et al., (2010); Yuan, Mitsumori, Beach, and Maravilla (2001)]. While major advancements have been made in medical imaging for early detection and diagnosis of advanced atherosclerosis patients, research efforts have been focused on assessment of plaque vulnerability using one-time patient data. Computational models and methods based on multi-year patient follow-up data to simulate plaque progression and predict possible future rupture are lacking in the literature.
Most efforts for plaque progression research were focused on fluid dynamics side since it has been well accepted that atherosclerosis initiation and progression correlate positively with low and oscillating flow wall shear stresses [Friedman, Bargeron, Deters, Hutchins and Mark (1987); Dhawan et al. (2010); Friedman and Giddens (2005); Giddens, Zarins, Glagov, S. (1993); Ku, Giddens, Zarins and Glagov (1985); Gibson et al. (1993); Koskinas et al. (2009, 2010); Liu and Tang (2010); Papafaklis et al. (2010); Stone et al. (2003)]. It has been well accepted that low and oscillating flow shear stress provides favorable environment for atherosclerosis initiation and early progression. However, this “low and oscillating shear stress hypothesis” cannot explain why moderate and advanced plaques continue to grow under elevated flow shear stress conditions [Tang et al. (2005); Yang et al. (2010)]. In our recent multi-patient study, it was found that advanced human carotid plaque progression correlated positively with flow shear stress (FSS) computed from follow-up scan, based on in vivo magnetic resonance imaging (MRI) data from 14 patients and 32 MRI scan pairs (baseline and follow-up) [Yang et al., 2010]. Another study using serial MRI patient-tracking data and computational models indicated that 18 out of 21 patients studied showed significant negative correlation between plaque progression measured by wall thickness increase and plaque wall (structure) stress [Tang et al. (2008)]. 2D and 3D meshless generalized finite difference (GFD) computational models were developed using patient-specific plaque progression data to simulate plaque growth and predict future plaque rupture risk [Yang, Tang, Atluri et al. (2008, 2010)].
In this paper, we extend our previous 3D meshless GFD structure-only models to three-dimensional carotid plaque models with fluid-structure interactions. Since plaque progression correlates with both plaque wall (structure) stress (PWS) and flow shear stress (FSS), we hypothesize that growth functions including plaque morphology, PWS and FSS would provide better prediction than growth functions with fewer factors. A computational procedure based on 3D meshless generalized finite difference method for both fluid and structure models and serial MRI data was introduced to quantify patient-specific carotid atherosclerotic plaque growth functions and simulate plaque progression. By using plaque progression simulation, plaque vulnerability assessment and clinical decisions can be based on multi-time MRI scans and simulated “virtual” plaque progression. With validation, our procedure could be implemented in clinical applications. Simulated future plaque morphologies with stress/strain distributions can be displayed to physicians and patients and will lead to considerable improvement in prediction accuracy for potential plaque rupture risk and possible prevention of fatal cardiovascular events.
Because of the complexity of plaque geometry and structure, meshless GFD method has the advantage that it is meshless, thus avoids frequent re-mesh process that finite element methods require. Yang, Tang, Atluri et al. introduced 2D and 3D meshless GFD computational models using patient-specific plaque progression data to simulate plaque growth and predict future plaque rupture risk [Yang, Tang, Atluri et al. (2008, 2010)]. More broadly, computational modeling for engineering applications with meshless methods have made considerable advances in recent years [Atluri (2004, 2005); Atluri, Yagawa, and Cruse (1995); Bathe (1996, 2002)]. A “mixed” approach was introduced to improve the MLPG method using finite volume method [Atluri, Han and Rajendran (2004)]. GFD methods have been used in many engineering applications and in our previous papers where irregular geometries and free-moving boundaries are involved [Kleiber (1998); Liszka and Orkisz (1980); Tang, Chen, Yang, Kobayashi and Ku (2002); Tang, Yang, Kobayashi and Ku (2001)]. One advantage of using GFD is that generalized finite difference schemes can be derived for user-selected irregular grid points which can be freely adjusted to accommodate plaque deformation and growth. The MGFD method introduced in this paper uses grid points from the local support of each nodal point so that theoretical MLPG framework can be applied [Atluri (2004)].
2 Data acquisition, models and methods
2.1 In vivo serial MRI data acquisition
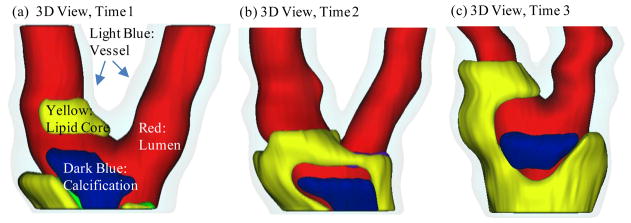
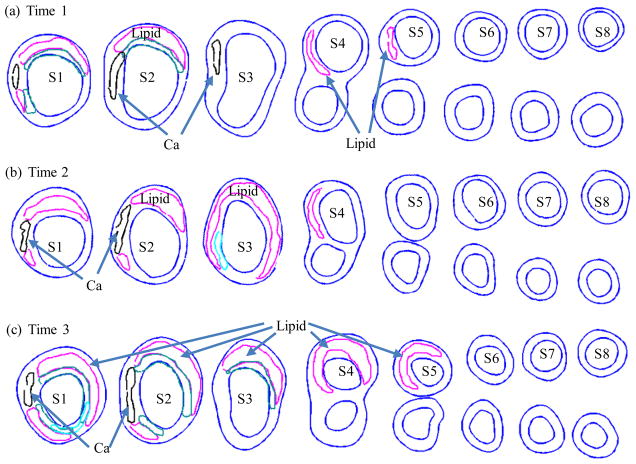
Serial MRI data from one patient was provided by the University of Washington (UW) group using protocols approved by the University of Washington Institutional Review Board with informed consent obtained. Scan time intervals were about 18 months, subject to scheduling variations. MRI scans were conducted on a GE SIGNA 1.5-T whole body scanner using an established protocol outlined in the papers by Yuan and Kerwin et al. [Kerwin et al. (2003); Yuan and Kerwin (2004)]. Details of the model construction process can be found from [Yang et al. (2010); Yang, Tang, Atluri et al. (2008, 2010)]. Figure 1 gives the re-constructed 3D geometries of the plaque at three time points showing plaque progression. Figure 2 gives segmented contour plots of 8 matched slices of the plaque at three time points. These slices were used for model construction. The matched 8 slices were used to determine plaque growth functions. Plaque geometry at Time 3 was also used to validate simulated plaque progression.
Figure 1.
Re-constructed 3D geometry of a carotid plaque based on in vivo serial MRI data. Three time point data are shown. T1, T2 and T3 refer to time points from here on, unless otherwise indicated. Scan interval: T1–T2, 562 days; T2–T3, 515 days. Red – lumen; Light Blue - outer wall; Yellow - necrotic core; Dark blue – calcification.
Figure 2.
Segmented contour plots of a carotid plaque at three time points from a participating patient obtained from multi-weighting MRI slices. Carotid bifurcation was used as the registration point to match slices and 8 matched slices (S1–S8) were selected for this progression simulation study. Magenta: necrotic lipid core; Black: calcification.
2.2 The 3D FSI model and boundary conditions
2.2.1. The structure model
Since there was insufficient data to quantify individual plaque component growth, the artery (or, the plaque; the two terms are used interchangeably in this paper) was treated as a homogeneous material, which was assumed to be linear, isotropic and nearly incompressible. The governing equations and corresponding initial and boundary conditions are given below [Fung (1993; 1994)]:
| (1) |
| (2) |
| (3) |
| (4) |
| (5) |
| (6) |
| (7) |
| (8) |
where ρ is vessel material density, u⃗ = (u1, u2, u3) is the displacement vector corresponding to x,y, and z directions, with z being the axial (longitudinal) direction. σ is stress tensor, ε is strain tensor, Pin is the specified lumen pressure, Γ is vessel inner boundary, u30 (t), u3L(t) are the pre-stretch functions for the z-displacement at the two ends of the tube, f •, j stands for derivative of f with respect to the jth variable. For the 3D linear model, the strain-stress relationship is:
| (9) |
| (10) |
where
| (11) |
E is the Young’s Modulus, μ is the Poisson ratio which was set to 0.495 in this paper. Substitute (9)–(10) into (1), we have the displacement equations:
| (12) |
| (13) |
| (14) |
The boundary conditions are:
| (15) |
| (16) |
| (17) |
where (n1, n2, n3 ) is the normal direction of the vessel surface. In our model, the inner boundary (lumen surface) is with (t̄1,t̄2,t̄3)= (Pinn1, Pinn2, Pinn3), Pin is the specified inner pressure. The outer boundary was set as a free boundary, with (t̄1,t̄2,t̄3)= 0. The Young’s modulus was set to E=176 kPa based on our experimental data [Kobayashi, Tsunoda, Fukuzawa, Morikawa, Tang, Ku (2003); Tang et al. (2008); Tang, Yang, Zheng, Woodard, Saffitz, Petruccelli, Sicard and Yuan (2005)] and current literature [Fung (1993); Humphrey (2002)]. The Poisson ratio was set at ν =0.495.
2.2.2. The fluid model
Blood flow in the right ventricle was assumed to be laminar, Newtonian, viscous and incompressible. The Navier-Stokes equations with arbitrary Lagrangian-Eulerian (ALE) formulation were used as the governing equations. The fluid model is given below:
| (18) |
| (19) |
| (20) |
| (21) |
| (22) |
| (23) |
where ρf is fluid material density, ν is the fluid viscosity. V⃗ = (u,v, w) is the fluid velocity vector corresponding to x, y and z directions, P is the fluid pressure, V⃗g is the mesh velocity of fluid node. Pin(t), Pout(t) are the specified fluid pressure on inlet and outlet, σr and σs are fluid and structure stress tensors, and nr and ns are their outward normal directions, respectively. Steady pressure condition Pin=100 mmHg was used in this paper. Pout was set at 98.7, 98.1 and 97 for T1, T2 and T3, respectively. The corresponding flow rates were 8.45, 7.88, and 7.47 ml/s, reflecting some modest flow reduction for increased lumen narrowing.
2.3 The meshless Generalized Finite Difference FSI model
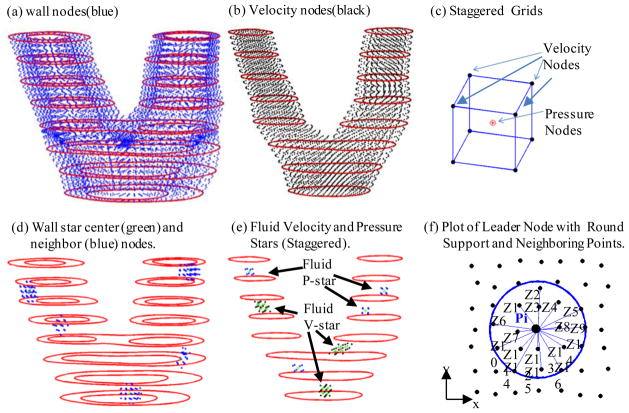
The meshless generalized finite difference structure model was introduced in our previous paper for plaque progression simulation [Yang, Tang, Atluri (2010)]. In this paper, fluid-structure interaction was added for better predictions. The GFD concept and derivation of the generalized finite difference schemes are explained by the following example. Fig. 3(a)–(e) gives the carotid plaque with distributed nodal points with staggered grids. Fig. 3(d)–(e) gives leader-nodes (Pi) with their neighbor nodes (Zj). The neighbor nodes were selected using a sphere support with radius: R=s*max(dx,dy,dz). The support size control data s=3.0 was determined numerically to reach best agreement with solutions obtained by ADINA. Fig. 3(f) shows a simplified 2D plot of a leader node with its neighboring points, illustrating the derivation process of GFD scheme.
Figure 3.
Schematic drawing of meshless GFD scheme derivation and nodal point distributions. (a) The plaque with distributed wall nodal points; (b) the fluid domain with distributed velocity nodal points; (c) the staggered fluid velocity and pressure nodal points); (d) 5 selected leader wall nodes (stars) with neighboring points; (e) selected velocity and pressure leader nodes (stars) with their corresponding neighboring points; (f) plot of a leader node with round support and neighboring points (Zj) for easy demonstration of GFD scheme derivation.
2.3.1 The meshless GFD structure model
For inner nodes, we use 2nd order GFD scheme. For boundary nodes, we use 1st order GFD scheme. For each leader node Pi with Ni neighbor nodes Zj, j=1, …, Ni (see Fig. 3(f)), the 2nd order Taylor expansion of f(x,y,z) at Pi is given by:
| (24) |
where the subscript j=1…Ni is the subscript for the neighbor nodes Zj of Pi. f is u1,u2,u3 in displacement formula, fj = f(Zj). Dropping the last term, we have:
| (25) |
where fj = f (Zj), . GFD schemes for all the first and second order derivatives are determined from (25) using function values at the Ni neighbor nodes and least-square approximation techniques.
The first-order Taylor expansion is given by:
| (26) |
The first order GFD schemes can be obtained similarly from the following system:
| (27) |
2nd order center difference scheme was used for the time derivative term:
| (28) |
Substituting all the GFD schemes and (28) into (12)–(14), we obtained the final linear system for the displacement function:
| (29) |
The vector ū = (u1, u2, u3)T is the displacement solution at time step (n+1).
2.3.2 The meshless GFD fluid model
A half staggered mesh was used in discretizing the fluid model. Different stars were used for inner velocity and pressure nodes in equations (18)–(19). For momentum equation (18), we used 2nd order GFD scheme for ∇2V⃗ term, 1st order upwind GFD scheme for ((V⃗ − V⃗g)· ∇) V⃗ term, 1st order GFD scheme for ∇P term. For a given velocity leader node Pi, the 2nd order GFD schemes for ∇2V⃗ derivatives were derived from the same formula as (25), with the leader node Pi and its neighbor nodes Zj (j=1,2,…Nvi) all being velocity nodes. Without causing confusion, we use u,v,w for velocity components, uPi indicates u at the leader node, uj is u at neighboring nodes Zj. Calling Pi the V-V star, for velocity component f= u, we have:
| (30) |
The 1st order upwind GFD schemes for ((V⃗ − V⃗g)· ∇)V⃗ derivatives were derived from the same formula as (27). The leader node Pi and its neighbor nodes Zj (j=1,2,…Nvi) were all velocity nodes. However, only the nodes at the upwind direction were included in the star. Still calling Pi the V-V star, for f= u (for v, w, the derivation is the same), we have:
| (31) |
The 1st order GFD schemes for ∇P term were the same using (27). Now, the leader node Pi is velocity node, but its neighbor nodes Zj (j=1,2,…Npi) are pressure nodes. Let f be the pressure P and call it V-P star, we have:
| (32) |
Using u-equation as an example, Equation (18) can be re-written as:
| (33) |
With leader point Pi, its neighbor nodes of V-V star are Zj (j=1,2,…Nvi), its neighbor nodes of V-P star are Tj (i=1,2,…Npi), the term discretized using 1st order forward time difference scheme, u− ug, v− vg, w− wg use data of last equation iteration step. The discretized formula of u-equation (33) is:
| (34) |
Here n is the time step index and k is the index for equation iteration. The discretized equations for v and w-equation of (18) can be obtained similarly.
For continuity equation (19), we use inner pressure node Pi as leader point and 1st order GFD scheme for discretization. The neighbor nodes Zj(j=1,2,…Npvi) are all velocity nodes. Calling it the P-V star, we have:
| (35) |
The discretized formula of (19) is:
| (36) |
Assembling all the discretized equations together, the final linear system is:
| (37) |
W⃗ = (u,v, w, P)T is the fluid solution at time step (n+1), equation iteration step (k+1).
2.3.4 Fluid-structure interaction and FSI model solution process
An iterative procedure was employed to handle fluid-structure interaction. The unsteady structure and fluid models were solved using steady boundary conditions. The FSI model solution process involves three loops:
-
1st loop
time step iteration step, n=0,1,2,… to get to time steps when steady solutions are obtained;
-
2nd loop
FSI iteration step indicated by L. For structure displacement, we set u⃗n+1,0= u⃗n, using the fluid pressure on lumen, solve the solid equations, get u⃗n+1, L+1, L=0,1,2,…, till
(38) It should be noted that there is no iteration within the structure model solution procedure since the structure model is linear.
-
3rd loop
Navier-Stokes equation iteration step for fluid model indicated by k:
for fluid model, we take the structure inner boundary as the boundary for fluid domain, set W⃗n+1,0= W⃗n, k=0,1,2,…, solve fluid model till,
(39) We set W⃗n+1= W⃗n+1,k+1 and go back to the structure model.
We continue the time loop until the plaque geometry, the structure displacement and fluid solutions are no longer changing with time, i.e., changes are within the pre-set tolerance.
2.4 3D re-construction and a shrink-stretch process
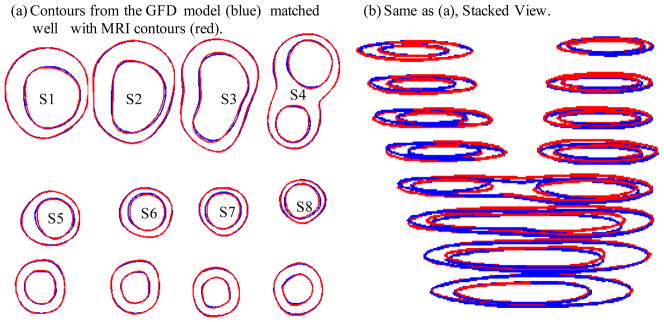
Our numerical procedures need to start from geometries with zero flow velocity, zero pressure and zero stress/strain distributions. Under the in vivo condition, the artery is axially stretched and pressurized, thus axial and circumferential shrinking was needed a priori to generate the starting plaque geometry for the computational model. A pre-shrink and pre-stretch process was applied so that the vessel would match the in vivo geometry. The shrinkage in axial direction was 9% so that the vessel would regain its in vivo length with a 10% axial stretch. Circumferential shrinkage for lumen and outer wall was determined so that: 1) total mass volume was conserved; 2) plaque geometry after 10% axial stretch and pressurization had the best match with the original in vivo geometry. Fig. 4 compares the contours obtained from the GFD model with MRI contours. While some variation can be observed due to the stretch and pressurization, the net wall thickness errors (averaged over all 1200 data points) were less than 2%.
Figure 4.
Comparison of MRI contours and GFD results after the shrink-stretch process. Time 1 data was used. Blue: contours from GFD FSI model; Red: in vivo MRI contours.
2.5 GFD method and model validation
A commercial finite element software package ADINA (ADINA R & D, Inc., Watertown, MA) was used to validate our GFD FSI model. ADINA has been validated by hundreds of realistic engineering and real life applications and is well accepted in the industry and research communities [Bathe (1996); Bathe (2002)]. We have been using ADINA in the past 15 years to construct and solve 2D/3D artery models which were validated by experimental measurements [Tang et al. (2005,2008)]. Finite element ADINA FSI models were constructed for all three time points T1, T2 and T3 following the same procedures used in [Tang et al. (2005)]. Comparisons of results from the two models are given in Section 3.
2.6 Vessel wall thickness definition and quantification of plaque growth functions
GFD FSI models were constructed based on in vivo MRI data at Time 1 (T1), Time 2 (T2) and Time 3 (T3) and solved to get 3D plaque geometry (which matched in vivo MRI geometry with errors less than 2%), plaque wall stress (maximum principal stress denoted by σ) and flow wall shear stress denoted by τ. Slices from the three scans (T1, T2 and T3) were matched using the carotid bifurcation as the registration point (see Fig. 2). In this paper, vessel wall thickness (WT) was selected as the measure for plaque progression. For each matched slice, 100 evenly-spaced points from the lumen were selected and a piecewise equal-step method was introduced in our previous paper to calculate wall thickness [Ref]. Using the 8 matched slices, for each of the 800 data points, inner and out-boundary points (xin(i,j), yin(i,j), xout(i,j), and yout(i,j) ), plaque wall stress σ, and flow wall shear stress τ at T1–T3 were recorded for simulation use.
Four plaque growth functions (GF1, …, GF4) were introduced to predict “next time step” plaque geometry. GF1 uses plaque morphology data only. GF2 uses plaque morphology and plaque wall stress. GF3 uses morphology and flow shear stress. GF4 included all the three factors, i.e., morphology, plaque wall stress and flow shear stress. The formulas for GF1–GF4 are given below:
| (40) |
| (41) |
| (42) |
| (43) |
where ak(j) are coefficients of the growth functions to be determined fitting T3 data, f is one of the displacement variables (inner- and outer-boundary point coordinates xin(i,j), yin(i,j), xout(i,j), and yout(i,j)), which could also be calculated using numerical steps in the simulation, Δt = time step in simulation, j= 1,2, … 8 is the slice number, i is the index for the points on each slice. The coefficients ak(j) in GF1–GF4 were determined using least-squares method to best fit nodal positions (x,y) of nodal points on plaque inner and outer boundaries at T3. All data in growth function determination and plaque progression simulation were from GFD FSI models. R2 values of the fitting results are given in Table 1.
Table 1.
R2 values of the least-squares fitting results using the four growth functions. (x-in, y-in) are coordinates of inner (lumen) boundary points. (x-out, y-out) are coordinates of out boundary points.
| GF | Feature | x-in | y-in | x-out | y-out |
|---|---|---|---|---|---|
| GF1 | x, y | 0.994228 | 0.996873 | 0.998681 | 0.999154 |
| GF2 | (x,y) + σ | 0.995197 | 0.998232 | 0.999215 | 0.999476 |
| GF3 | (x,y) + τ | 0.997174 | 0.998164 | 0.999146 | 0.999423 |
| GF4 | (x,y) + σ + τ | 0.997737 | 0.999088 | 0.999540 | 0.999696 |
2.7 Plaque progression simulation
Starting from the plaque geometry at T2 and using the plaque growth functions determined in 2.6, the following procedure was used to simulate plaque progression and try to reach best agreement with plaque geometry at T3 obtained from GFD model (called the target T3 geometry from here on):
-
Step 1
Start from the original in vivo MRI geometry at T2, use proper shrinkage to get the zero-pressure numerical starting geometry;
-
Step 2
Discretize the geometry using the meshless GFD method, solve the model to get plaque geometry and stress/strain distributions under specified pressure conditions;
-
Step 3
Set
(44) (45) -
Step 4
We use m time steps to go from T2 to T3. For K=1, …,m−1, do the following (use GF1 as an example, GF2–GF4 are similar)
-
Step 4-1
(46) where , f is the x and y coordinates of nodal points of inner and outer boundaries for each slice.
-
Step 4-2
Adjust internal nodal points as needed;
-
Step 4-3
Solve the plaque model using the updated plaque geometry;
-
Step 4-4
Repeat Steps 4-1 to 4-3 till numerical time reaches T3.
The w-value in the simulation formula was determined numerically to have the best matching with plaque T3 geometry. It should be noted that time unit for plaque progression was “day”, while the time unit in the fluid and structure models was “second.” Results obtained from the simulation code are presented in next section.
3 Results
One patient data with three time point MRI scans (see Fig. 1) was used to construct the GFD models and demonstrate the simulation process. Results from GFD FSI models were compared with that from ADINA models for validation. Simulation errors from the four selected growth functions were compared. Details are given below.
3.1 3D meshless GFD FSI model provided good agreement with ADINA solutions
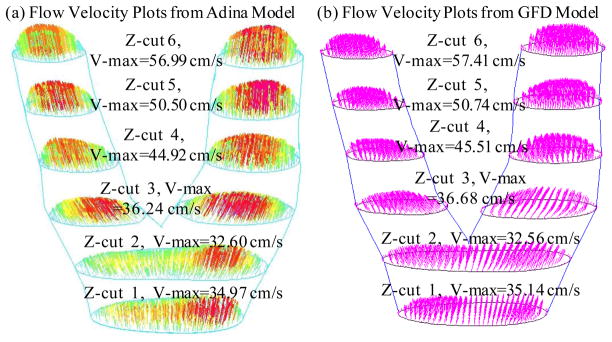
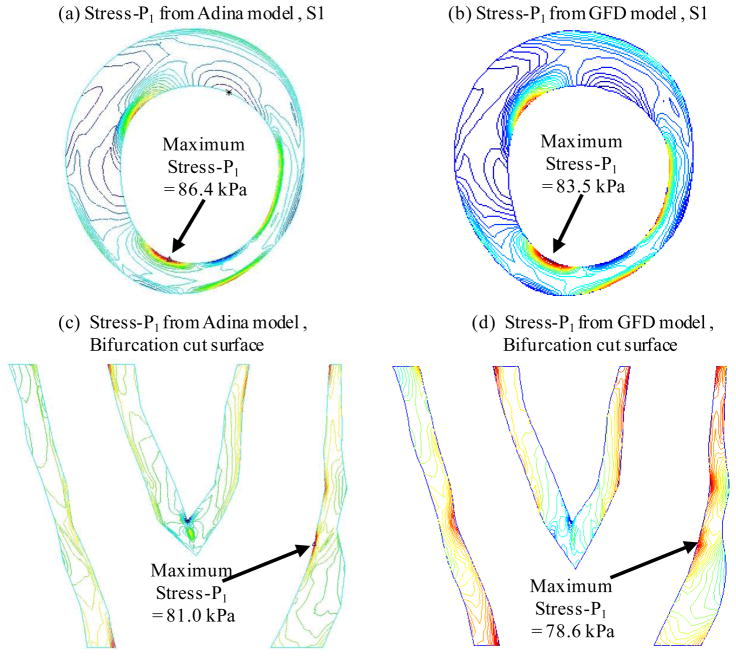
Figures 5 & 6 compares flow velocity and plaque maximum principal stress (Stress-P1) obtained from both GFD and ADINA models. GFD results agreed well with ADINA results (flow velocity error < 2%; plaque stress error < 3%).
Figure 5.
GFD FSI model validation: Comparison of flow velocity plots on 6 cut surfaces from GFD and ADINA models indicates that GFD solution has a good agreement with that from ADINA model (error < 2%).
Figure 6.
Comparison of plaque maximum principal stress (Stress-P1) from GFD and ADINA models on Slice 1 and a bifurcation cut surface indicates that GFD Stress-P1 solution has a good agreement with that from ADINA model (error < 3%).
3.2 Plaque progression simulations using growth functions GF1–GF4
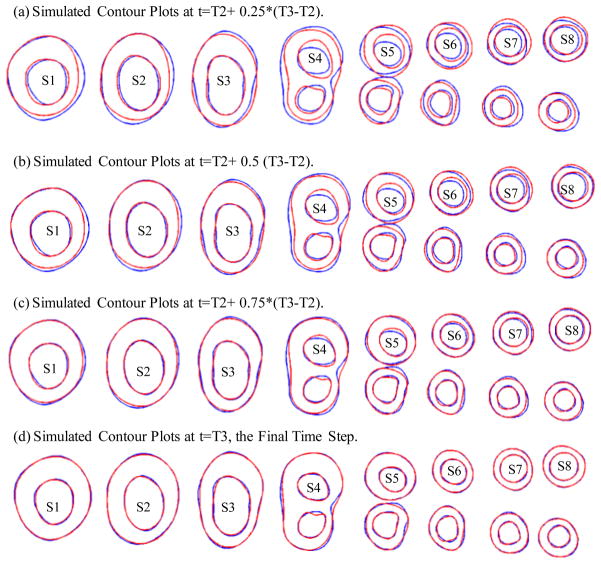
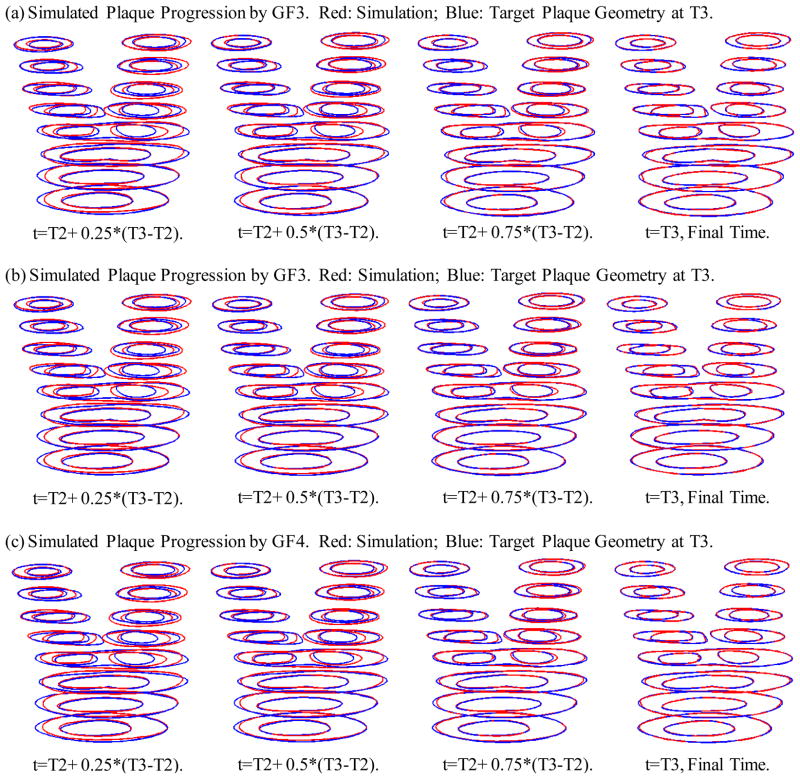
Four growth functions were used to simulate plaque progression from T2 to T3 following the procedure described in 3.3. Fig. 7 gives the overlapping contour plots of the simulated results at t= T2+(T3−T2)/4, T2+ (T3−T2)/2, T2+ 3*(T3−T2)/4, and T3, showing good agreement between simulated and actual plaque progression. Fig. 8 gives the 3D stacked view of the simulated plaque geometries at 4 time steps. Fig. 9 shows 3D stack views of simulated plaque progression using GF2, GF3, and GF4.
Figure 7.
Simulated contour plots using Growth Function 1 at 4 intermediate time steps compared with the target plaque contours as T3 obtained from GFD FSI model. Blue: target contours; Red: simulated plaque contours converging to the target contours.
Figure 8.
3D view of simulated plaque geometries converging to the target geometry.
Figure 9.
3D stack view of simulated plaque progression geometries using three growth functions GF2, GF3, and GF4 showing including neighboring points and stress terms led to better match with target T3 geometry.
To quantitatively compare the errors associated with the four growth functions, we define the absolute and relative errors as:
| (47) |
| (48) |
| (49) |
where 1300=total number of nodal points (5 slices had two lumens) selected from inner boundary, target WT_T3 is the plaque wall thickness at T3 obtained from GFD model with axial stretch and pressure applied to reach best match with MRI geometry. The errors for the simulated plaque geometries using GF1–GF4 are given by Table 2. GF4 gave the best match with the target T3 geometry, which is 4.39%, only about 1/2 of the error given by GF1.
Table 2.
Comparison of absolute and relative errors of the 4 growth functions indicating that the growth function including morphology, plaque stress and flow shear stress provided better agreement with the target T3 geometry.
| Growth Function | GF1 | GF2 | GF3 | GF4 |
|---|---|---|---|---|
| Average T3 WT (cm) | 0.14822 | 0.14814 | 0.14811 | 0.14805 |
| Absolute Error (cm) | 0.01278 | 0.01070 | 0.00855 | 0.00650 |
| Relative Error | 8.62% | 7.22% | 5.77% | 4.39% |
4 Discussions
4.1. Plaque growth function including morphology, plaque wall stress and flow shear stress provided better prediction
Our results indicated that the growth function with plaque morphology, structural stress and flow shear stress provided better matching with the target geometry, with an error of 4.39%, compared to an error of 8.62% given by a growth function without structural stress and flow shear stress terms.
It should be emphasized that our simulation is aiming at a target plaque geometry which was used in choosing the parameters for the growth functions. Prediction accuracy would not be as good if we have the current growth function, run the simulation process to predict future plaque progression without a target. The reason for that is the trend of plaque growth may not be kept, and may even be reversed, as reported in our recent multi-patient study [Ref]. Non-mechanical factors such as medicine, cholesterol level, exercise, and even emotional stress play important roles and should be considered in future research.
4.2 Significance of the Meshless GFD FSI method
We have added fluid-structure interaction into our model which allowed us to include flow shear stress in our growth functions. By using the meshless GFD method, we can adjust computational nodes in the plaque anyway we want to grow the plaque as the growth function dictates. And this can be written into the computational code so that it is done automatically. The method and model developed in this paper can be applied to many other biological and engineering processes where the computational domain changes in the process being investigated.
4.3 Model limitations
The material model needs to be extended to 3D nonlinear models to reflect artery stiffening behaviors. Plaque components should be included in the model. And the growth functions need to be adjusted to include the proper terms that can represent the plaque growth trend. Better understanding of the biological and mechanical factors will help us to better formulate the growth function.
5 Conclusions
We believe that this is the first time that 3D meshless GFD models with fluid-structure interaction were used to simulate human carotid atherosclerotic plaque progression based on patient-specific plaque morphology and point-wise plaque growth functions derived from multi-year MRI data. Our results indicated that our proposed progression simulation process was able to accurately predict future plaque morphology if the current progression trend was continued. The 3D meshless GFD method worked well for the progression model. The predicted progression by the growth function including plaque morphology, structural stress and flow shear stress was considerably more accurate than that given by other growth functions (4.39% error compared to 8.62% for growth function using morphology alone). More case studies are needed to validate our findings. Accurate plaque progression simulation adds the time dimension to plaque vulnerability assessment strategies and should improve our predicting accuracies.
Acknowledgments
This research was supported in part by NIH grant NIH/NIBIB R01 EB004759 and NSF grant DMS-0540684. Professor Chun Yang’s research was partially supported by National Sciences Foundation of China grant 10871028 and the Fundamental Research Funds for the Central Universities. Drs Chun Yuan, Gador Canton, and Thomas S. Hatsukami from University of Washington provided the in vivo MRI data and their efforts are happily acknowledged.
References
- 1.Atluri SN. Methods of Computer Modeling in Engineering & the Sciences-Part I. Tech Science Press; Forsyth, GA: 2005. [Google Scholar]
- 2.Atluri SN. The Meshless Local-Petrov-Galerkin Method for Domain & BIE Discretizations. Tech Science Press; Forsyth, GA: 2004. [Google Scholar]
- 3.Atluri SN, Han ZD, Rajendran AM. A new implementation of the meshless finite volume method, through the MLPG “Mixed” approach. CMES: Computer Modeling in Engineering & Sciences. 2004;6(6):491–513. [Google Scholar]
- 4.Atluri SN, Yagawa G, Cruse TA. Computational Mechanics ‘95. I & II. Springer-Verlag; New York: 1995. [Google Scholar]
- 5.Bathe KJ. Finite Element Procedures. Prentice Hall, Inc; New Jersey: 1996. [Google Scholar]
- 6.Bathe KJ, editor. Theory and Modeling Guide, Vol I & II: ADINA and ADINA-F. ADINA R & D, Inc; Watertown, MA: 2002. [Google Scholar]
- 7.Boussel L, Arora S, Rapp J, Rutt B, Huston J, Parker D, Yuan C, Bassiouny H, Saloner D. Atherosclerotic plaque progression in carotid arteries: monitoring with high-spatial-resolution MR imaging--multicenter trial. Radiology. 2009 Sep;252(3):789–96. doi: 10.1148/radiol.2523081798. [DOI] [PMC free article] [PubMed] [Google Scholar]
- 8.Dhawan SS, Avati Nanjundappa RP, Branch JR, Taylor WR, Quyyumi AA, Jo H, McDaniel MC, Suo J, Giddens D, Samady H. Shear stress and plaque development. Expert Rev Cardiovasc Ther. 2010;8(4):545–56. doi: 10.1586/erc.10.28. [DOI] [PMC free article] [PubMed] [Google Scholar]
- 9.Friedman MH, Bargeron CB, Deters OJ, Hutchins GM, Mark FF. Correlation between wall shear and intimal thickness at a coronary artery branch. Atherosclerosis. 1987;68:27–33. doi: 10.1016/0021-9150(87)90090-6. [DOI] [PubMed] [Google Scholar]
- 10.Friedman MH, Giddens DP. Blood flow in major blood vessels - modeling and experiments. Annals of Biomedical Engineering. 2005;33(12):1710–1713. doi: 10.1007/s10439-005-8773-1. [DOI] [PubMed] [Google Scholar]
- 11.Fung YC. A First Course in Continuum Mechanics. 3. Englewood Cliffs; New Jersey: 1994. [Google Scholar]
- 12.Fung YC. Biomechanics: Mechanical properties of Living Tissues. Springer-Verlag; New York: 1993. p. 68. [Google Scholar]
- 13.Fuster V. The Vulnerable Atherosclerotic Plaque: Understanding, Identification, and Modification. In: Fuster V, Cornhill JF, Dinsmore RE, Fallon JT, Insull W, Libby P, Nissen S, Rosenfeld ME, Wagner WD, editors. AHA Monograph series. Futura Publishing; Armonk NY: 1998. [Google Scholar]
- 14.Fuster V, Stein B, Ambrose JA, Badimon L, Badimon JJ, Chesebro JH. Atherosclerotic plaque rupture and thrombosis, evolving concept. Circulation. 1990;82(Supplement II):II-47–II-59. [PubMed] [Google Scholar]
- 15.Gibson CM, Diaz L, Kandarpa K, Sacks FM, Pasternak RC, Sandor T, Feldman C, Stone PH. Relation of vessel wall shear stress to atherosclerosis progression in human coronary arteries. Arterioscler Thromb. 1993;13(2):310–5. doi: 10.1161/01.atv.13.2.310. [DOI] [PubMed] [Google Scholar]
- 16.Giddens DP, Zarins CK, Glagov S. The role of fluid mechanics in the localization and detection of atherosclerosis. Journal of Biomechanical Engineering. 1993;115:588–594. doi: 10.1115/1.2895545. [DOI] [PubMed] [Google Scholar]
- 17.Humphrey JD. Cardiovascular Solid Mechanics. Springer-Verlag; New York: 2002. [Google Scholar]
- 18.Kaneda H, Ako J, Terashima M. Intravascular ultrasound imaging for assessing regression and progression in coronary artery disease. Am J Cardiol. 2010;106(12):1735–46. doi: 10.1016/j.amjcard.2010.08.012. [DOI] [PubMed] [Google Scholar]
- 19.Kerwin W, Hooker A, Spilker M, Vicini P, Ferguson M, Hatsukami T, Yuan C. Quantitative magnetic resonance imaging analysis of neovasculature volume in carotid atherosclerotic plaque. Circulation. 2003;107(6):851–856. doi: 10.1161/01.cir.0000048145.52309.31. [DOI] [PubMed] [Google Scholar]
- 20.Kleiber M. Handbook of Computational Solid Mechanics. Springer-Verlag; New York: 1998. [Google Scholar]
- 21.Kobayashi S, Tsunoda D, Fukuzawa Y, Morikawa H, Tang D, Ku DN. Flow and compression in arterial models of stenosis with lipid core. Proceedings of 2003 ASME Summer Bioengineering Conference; Miami, FL. 2003. pp. 497–498. [Google Scholar]
- 22.Koskinas KC, Chatzizisis YS, Baker AB, Edelman ER, Stone PH, Feldman CL. The role of low endothelial shear stress in the conversion of atherosclerotic lesions from stable to unstable plaque. Curr Opin Cardiol. 2009;24(6):580–90. doi: 10.1097/HCO.0b013e328331630b. [DOI] [PMC free article] [PubMed] [Google Scholar]
- 23.Koskinas KC, Feldman CL, Chatzizisis YS, Coskun AU, Jonas M, Maynard C, Baker AB, Papafaklis MI, Edelman ER, Stone PH. Natural history of experimental coronary atherosclerosis and vascular remodeling in relation to endothelial shear stress: a serial, in vivo intravascular ultrasound study. Circulation. 2010;121(19):2092–101. doi: 10.1161/CIRCULATIONAHA.109.901678. [DOI] [PMC free article] [PubMed] [Google Scholar]
- 24.Ku DN, Giddens DP, Zarins CK, Glagov S. Pulsatile flow and atherosclerosis in the human carotid bifurcation: positive correlation between plaque location and low and oscillating shear stress. Arteriosclerosis. 1985;5:293–302. doi: 10.1161/01.atv.5.3.293. [DOI] [PubMed] [Google Scholar]
- 25.Liszka T, Orkisz J. The finite difference method at arbitrary irregular grids and its application in applied mechanics. Computers and Structures. 1980;11:83–95. [Google Scholar]
- 26.Liu B, Tang D. Computer simulations of atherosclerotic plaque growth in coronary arteries. Mol Cell Biomech. 2010;7(4):193–202. [PMC free article] [PubMed] [Google Scholar]
- 27.Naghavi M, Libby P, Falk E, Casscells SW, Litovsky S, Rumberger J, Badimon JJ, Stefanadis C, Moreno P, Pasterkamp G, Fayad Z, Stone PH, Waxman S, Raggi P, Madjid M, Zarrabi A, Burke A, Yuan C, Fitzgerald PJ, Siscovick DS, de Korte CL, Aikawa M, Juhani KE, Airaksinen KE, Assmann G, Becker CR, Chesebro JH, Farb A, Galis ZS, Jackson C, Jang IK, Koenig W, Lodder RA, March K, Demirovic J, Navab M, Priori SG, Rekhter MD, Bahr R, Grundy SM, Mehran R, Colombo A, Boerwinkle E, Ballantyne C, Insull W, Jr, Schwartz RS, Vogel R, Serruys PW, Hansson GK, Faxon DP, Kaul S, Drexler H, Greenland P, Muller JE, Virmani R, Ridker PM, Zipes DP, Shah PK, Willerson JT. From vulnerable plaque to vulnerable patient: a call for new definitions and risk assessment strategies: Part I. Circulation. 2003a;108(14):1664–72. doi: 10.1161/01.CIR.0000087480.94275.97. [DOI] [PubMed] [Google Scholar]
- 28.Naghavi M, Libby P, Falk E, Casscells SW, Litovsky S, Rumberger J, Badimon JJ, Stefanadis C, Moreno P, Pasterkamp G, Fayad Z, Stone PH, Waxman S, Raggi P, Madjid M, Zarrabi A, Burke A, Yuan C, Fitzgerald PJ, Siscovick DS, de Korte CL, Aikawa M, Juhani KE, Airaksinen KE, Assmann G, Becker CR, Chesebro JH, Farb A, Galis ZS, Jackson C, Jang IK, Koenig W, Lodder RA, March K, Demirovic J, Navab M, Priori SG, Rekhter MD, Bahr R, Grundy SM, Mehran R, Colombo A, Boerwinkle E, Ballantyne C, Insull W, Jr, Schwartz RS, Vogel R, Serruys PW, Hansson GK, Faxon DP, Kaul S, Drexler H, Greenland P, Muller JE, Virmani R, Ridker PM, Zipes DP, Shah PK, Willerson JT. From vulnerable plaque to vulnerable patient: a call for new definitions and risk assessment strategies: Part II. Circulation. 2003b;108(15):1772–8. doi: 10.1161/01.CIR.0000087481.55887.C9. [DOI] [PubMed] [Google Scholar]
- 29.Papafaklis MI, Koskinas KC, Chatzizisis YS, Stone PH, Feldman CL. In-vivo assessment of the natural history of coronary atherosclerosis: vascular remodeling and endothelial shear stress determine the complexity of atherosclerotic disease progression. Curr Opin Cardiol. 2010;25(6):627–38. doi: 10.1097/HCO.0b013e32833f0236. [DOI] [PubMed] [Google Scholar]
- 30.Scotti CM, Shkolnik AD, Muluk SC, Finol EA. Fluid-structure interaction in abdominal aortic aneurysms: effects of asymmetry and wall thickness. Biomed Eng Online. 2005;4:64–70. doi: 10.1186/1475-925X-4-64. [DOI] [PMC free article] [PubMed] [Google Scholar]
- 31.Stone PH, Coskun AU, Yeghiazarians Y, Kinlay S, Popma JJ, Kuntz RE, Feldman CL. Prediction of sites of coronary atherosclerosis progression: In vivo profiling of endothelial shear stress, lumen, and outer vessel wall characteristics to predict vascular behavior. Curr Opin Cardiol. 2003;18(6):458–70. doi: 10.1097/00001573-200311000-00007. [DOI] [PubMed] [Google Scholar]
- 32.Tang D, Chen XK, Yang C, Kobayashi K, Ku DN. A viscoelastic model and meshless GFD method for Blood Flow in collapsible Stenotic Arteries. Advances in Computational Engineering & Sciences; International Conference on Computational Engineering and Sciences.Tech Science Press; 2002. [Google Scholar]
- 33.Tang D, Yang C, Kobayashi K, Ku DN. A Generalized Finite Difference Method for 3-D Viscous Flow in Stenotic Tubes with Large Wall Deformation and Collapse, Applied Num. Math. 2001;38:49–68. [Google Scholar]
- 34.Tang D, Yang C, Mondal S, Liu F, Canton G, Hatsukami TS, Yuan C. A Negative Correlation between Human Carotid Atherosclerotic Plaque Progression and Plaque Wall Stress: In Vivo MRI-Based 2D/3D FSI Models. J Biomechanics. 2008;41(4):727–736. doi: 10.1016/j.jbiomech.2007.11.026. [DOI] [PMC free article] [PubMed] [Google Scholar]
- 35.Tang D, Yang C, Zheng J, Woodard PK, Saffitz JE, Petruccelli JD, Sicard GA, Yuan C. Local maximal stress hypothesis and computational plaque vulnerability index for atherosclerotic plaque assessment. Annals of Biomedical Engineering. 2005;33(12):1789–1801. doi: 10.1007/s10439-005-8267-1. [DOI] [PMC free article] [PubMed] [Google Scholar]
- 36.Yang C, Canton G, Yuan C, Ferguson M, Hatsukami TS, Tang D. Advanced human carotid plaque progression correlates positively with flow shear stress using follow-up scan data: an in vivo MRI multi-patient 3D FSI study. J Biomech. 2010;43(13):2530–8. doi: 10.1016/j.jbiomech.2010.05.018. [DOI] [PMC free article] [PubMed] [Google Scholar]
- 37.Yang C, Tang D, Atluri S. Three-Dimensional Carotid Plaque Progression Simulation Using Meshless Generalized Finite Difference Method Based on Multi-Year MRI Patient-Tracking Data. CMES: Computer Modeling in Engineering and Sciences. 2010;57(1):51–76. [PMC free article] [PubMed] [Google Scholar]
- 38.Yang C, Tang D, Yuan C, Kerwin W, Liu F, Canton G, Hatsukami TS, Atluri S. Meshless Generalized Finite Difference Method and Human Carotid Atherosclerotic Plaque Progression Simulation Using Multi-Year MRI Patient-Tracking Data. CMES: Computer Modeling in Engineering and Sciences. 2008;28(2):95–107. [PMC free article] [PubMed] [Google Scholar]
- 39.Yuan C, Kerwin WS. MRI of atherosclerosis. Journal of Magnetic Resonance Imaging. 2004;19(6):710–719. doi: 10.1002/jmri.20070. [DOI] [PubMed] [Google Scholar]
- 40.Yuan C, Mitsumori LM, Beach KW, Maravilla KR. Special review: carotid atherosclerotic plaque: noninvasive MR characterization and identification of vulnerable lesions. Radiology. 2001;221:285–299. doi: 10.1148/radiol.2212001612. [DOI] [PubMed] [Google Scholar]


