Abstract
Background & objectives:
This study attempts to compare the pattern of growth of Indian children as assessed by weight for age, height for age and BMI for age with the WHO standards for growth (2006) and to explore the implications of differences in undernutrition rates in the 0-59 months of age group as assessed by these three indices.
Methods:
From the National Family Health Survey -3 database, growth curves for height, weight and BMI for age in Indian preschool children were computed using LMS software and compared with the WHO (2006) standards. Using the WHO (2006) standards, trends in prevalence of undernutrition as assessed by height, weight and BMI for age in the 0-59 month age group were computed.
Results:
During the first three months there was no increase in underweight and stunting rates. There was progressive increase in underweight and stunting rates between 3-23 months of age. Low BMI for age and wasting rates were highest at birth.
Interpretation & conclusions:
Poor growth is an adaptation to chronic low energy intake and stunting is a measure of cumulative impact of chronic energy deficiency on linear growth. It is important to prevent stunting because it is not readily reversible. Low BMI is an indictor of current energy deficit. Early detection of energy deficit using BMI for age and expeditious interventions to correct the deficit might be effective in prevention of stunting.
Keywords: Growth, Indian preschool children, nutritional status, WHO 2006 Growth Standards
The World Health Organization (WHO) published the Child Growth Standard for infants and children up to the age of 5 yr based on a multi-country study (Brazil, Ghana, India, Norway, Oman and USA) on growth of healthy breast-fed children under optimal conditions in April 20061–4. The release of these new standards evoked a lot of interest. Some of the developed countries such as UK and USA, examined the usefulness of these growth standards for assessment of nutritional status vis-a-vis existing national standards5–7. It was reported that the major advantages for using WHO standards in developed countries were: (i) standards based on growth pattern of breast-fed infants could be used as tools to promote breast feeding, and (ii) these could result in better detection of overnutrition in early infancy and childhood.
Other groups have explored the usefulness of BMI for age from WHO standards for assessment of severe undernutrition during relief operations8–10. Ergo et al11 explored the extent to which the use of the WHO 2006 standards affect the estimated prevalence of undernutrition in low and middle income countries.
The Government of India has accepted the use of WHO (2006) standards for assessment of nutritional status in preschool children. During the transition period of switching over from National Centre for Health Statistics (NCHS)/WHO to WHO 2006 standards, National Family Health Survey (NFHS) and surveys conducted by National Nutrition Monitoring Bureau (NNMB) reported prevalence of undernutrition both in NCHS/WHO standards and WHO 2006 standards. Several investigators have explored the implications of the use of WHO growth standards for assessment of undernutrition vis-a-vis other standards which were widely used earlier in health services/surveys and Integrated Child Development Services Programme12–18.
In India, weight for age has been the most widely used indicator for assessment of nutritional status, detection of undernutrition and monitoring the improvement following interventions in children. The question whether in Indian children with high stunting rates due to past chronic undernutrition, BMI for age is a more appropriate indicator for assessment of current undernutrition and improvement following interventions is often debated among nutrition scientists in the country. While there is global acceptance that body mass index (BMI) should be used for assessment of obesity/adiposity in children19, there has not been a similar consensus regarding use of BMI for assessment of undernutrition in children. This study reports the results of analysis of data from NFHS-3 on growth patterns and prevalence of undernutrition in children 0-59 months of age as compared to WHO 2006 standards for weight for age, height for age and BMI for age.
Material & Methods
The National Family Health Survey-3 database provides information on age, sex, weight, height, infant and young child feeding practices and morbidity due to infections in the last fortnight in 56,438 children. Of these, 52,868 had recorded age between 0-59 months; 45,377 infants and children had weight and height within plausible range as defined in NFHS-3 report15. Growth curves of these 45,377 infants and children between 0-59 months (median ± 2 and 3 SD of height, weight and BMI in relation to age) were computed using LMS software, UK. The lmsChartMaker program fits smooth centile curves to reference data using the LMS method. Reference centile curves show the distribution of a measurement as it changes according to some covariate, e.g. age. The LMS method summarises the changing distribution by three curves representing the median (M), coefficient of variation (S) and skewness (L), the latter expressed as a Box-Cox power. Using penalised likelihood, the three curves can be fitted as cubic splines by non-linear regression, and the extent of smoothing required can be expressed in terms of smoothing parameters or equivalent degrees of freedom. The process involves five stages: data entry, model fitting, graphical display, model checking and model saving, with the last four stages repeated as often as necessary. The growth curves of these Indian preschool children were compared with growth curves based on the WHO (2006) standards4. Prevalence of undernutrition in relation to age as assessed by four anthropometric indices - weight for age, height for age, BMI for age, wasting, were computed from the WHO (2006) standards.
Results
Growth of Indian children: In the first month after birth, the median weight of Indian children was little lower than the corresponding values of WHO standards. By six months the median values of weight in Indian children corresponded to the <-2SD of the WHO standard. From 12 months onwards the median weight for age of Indian children was just below the -2SD of WHO standards. The -2SD values of Indian children which was just below the corresponding values of the WHO standards in the first few months, showed a fall over the next six months and thereafter fell to values well below but parallel to -2SD values of the WHO standards. The +2SD value of Indian children was similar to the corresponding values of the WHO standards in the first month but subsequently the values for Indian children were lower and by six months lie just above the median values of WHO standards. Thereafter, the +2SD values for Indian children were just above and parallel to the median values for WHO standards for weight for age (Fig. 1). The gap in the median weight for age between WHO standards and Indian children widened with increasing age: 0.5 kg at 1 month, 1.6 kg at 12, 2.4 kg at 24, 3.9 kg at 36 and 48 and 4.2 kg at 59 months.
Fig. 1.
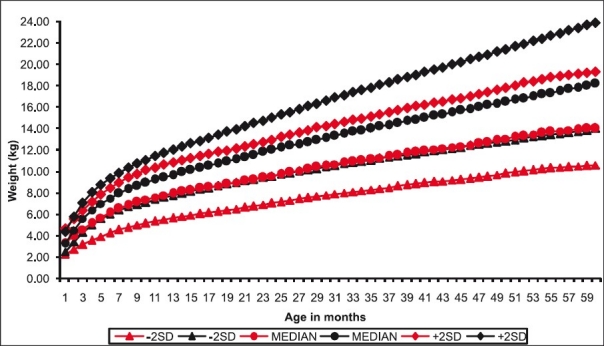
Weight for age in Indian children. Black lines indicate WHO data. Red lines indicate NFHS data.
Comparison of the height for age of Indian children and the WHO standards for height for age is shown in Fig. 2. In the first month after birth, the median and -2SD height for age of Indian children were little lower than the corresponding values of WHO standards; the +2SD height for age of Indian children was higher than the corresponding value of WHO standards. Between 1-12 months there was a progressive fall in the median height for age values in Indian children as compared to the WHO standards. From 12 months onwards the median values of height for age in Indian children was essentially similar to the -2SD values of WHO standards. The -2SD values for Indian children was below the corresponding values of the WHO standards at one month. There was a progressive reduction in the -2SD values for height for age in Indian children as compared to the WHO standards. The gap between -2SD values of the WHO standards was 3 cm at first month, 8 cm at 12 months and nearly 14 cm at 59 months.The +2SD values for Indian children which were above the corresponding values of the WHO standards in the first few months, progressively declined so that at 12 months these were similar to the WHO standards; the reduction continued between 12-59 months so that at 59 months, the gap between +2SD value of Indian children and corresponding value of the WHO standards was 6 cm.
Fig. 2.
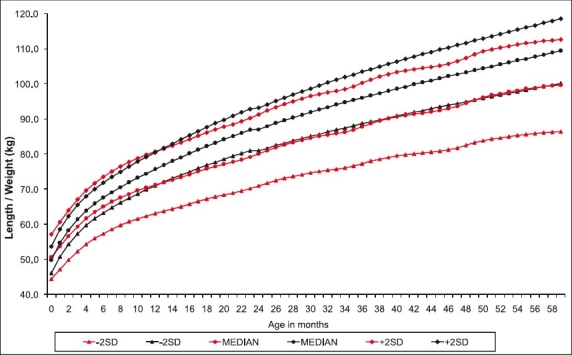
Height for age in Indian children. Black lines indicate WHO data. Red lines indicate NFHS data.
Comparison between the BMI for age of Indian children and the WHO standards is shown in Fig. 3. In the first month after birth, the median and -2SD values for BMI of Indian children were lower than the corresponding values of WHO standards; the +2SD values for Indian children were higher than the corresponding values of WHO standards. By three months the median of Indian children was just above the -2SD of the WHO standards. Subsequently the gap between median value of BMI for age for Indian children and -2SD values of the WHO (2006) widened; between 18 and 59 months the difference between the median BMI values of Indian children and the WHO standards was about 0.8. Throughout the 0-59 months the -2SD values of the Indian children were lower than the - 2SD values of the WHO standards. There was a widening of the gap between -2SD values of Indian children and the corresponding values of the WHO standards between 1- 6 months; this gap narrowed between 6-18 months and thereafter remained unaltered. The +2 SD values of Indian children were essentially similar to the +2SD values for WHO standards. Unlike weight and height parameters the difference in median BMI for age between Indian children and WHO standards was small: 0.6 at 1 months, 1.3 at 12 months, 0.6 at 24 months, 0.9 at 36, 48 and 59 months.
Fig. 3.
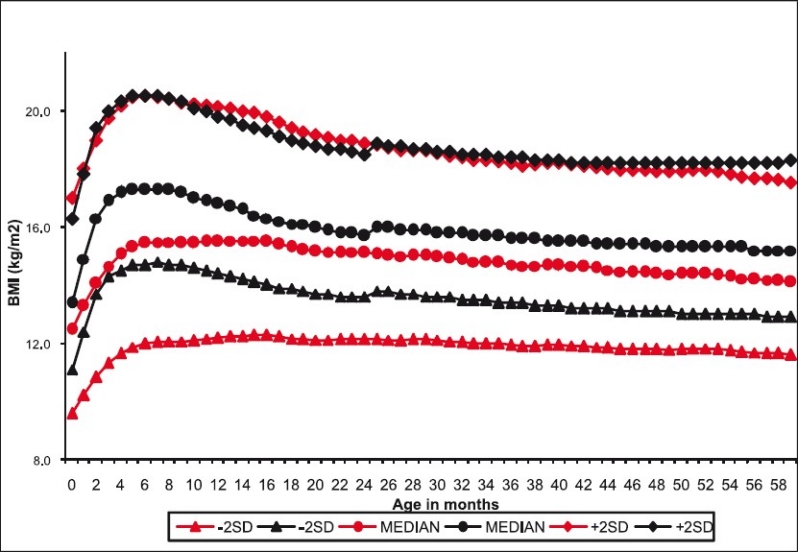
BMI for age in Indian children. Black lines indicate WHO 2006 data. Red lines indicate NFHS data.
Prevalence of undernutrition: Prevalence of undernutrition (<-2SD ) as assessed by weight for age, height for age, BMI for age and wasting (weight for height irrespective of age) for under-five children is shown in Fig. 4. Stunting was the most common manifestation (48%) of undernutrition in these children; 42.5 per cent of children were underweight. In contrast, only 16.9 per cent were undernourished if low BMI for age is used as the criterion for assessment of undernutrition. It is noteworthy that if BMI for age is used as the indicator, 2.2 per cent of these children were overnourished.
Fig. 4.
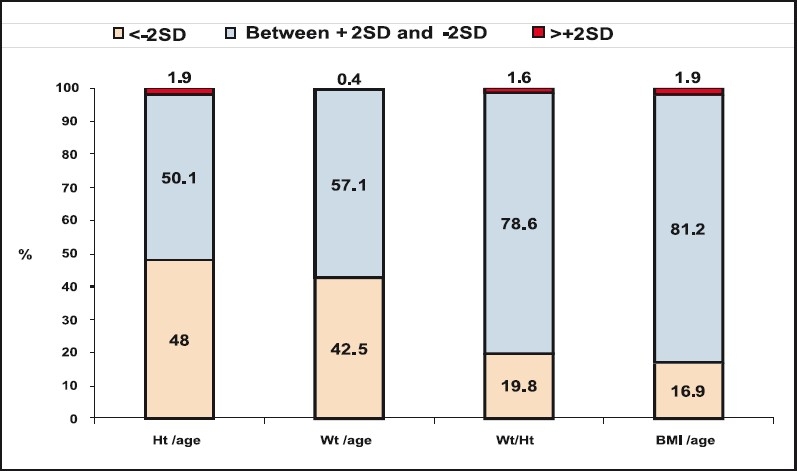
Nutritional status of preschool children.
Prevalence of undernutrition in relation to age: Change in prevalence of undernutrition in relation to age of the child as assessed by WHO standards for weight for age, height for age, wasting and BMI for age is shown in Fig. 5. In India about 30 per cent of infants weigh less than 2.5 kg at birth. Underweight rates in the first three months remained similar to low birth-weight rates. There was a progressive increase in underweight rates between 3 to 24 months. Underweight rates remained unaltered between 2-5 yr of age. In the first six months the stunting rates remained similar to the stunting rates reported at birth. Stunting rates showed a steep and progressive increase from 20 per cent during the first six months to 58 per cent in the 18-23 month age group. Over the next three years there was a 7 per cent reduction in stunting rate. Nearly a third of the infants had low BMI in the first six months of age. There was a small reduction in low BMI for age between 6-11 months of age to 29 per cent; followed by a steep reduction in low BMI and in the 12-17 months low BMI was 18.4 per cent. This was followed by slower but sustained fall so that in the 48-59 month age group prevalence of low BMI was only 11.7 per cent.
Fig. 5.
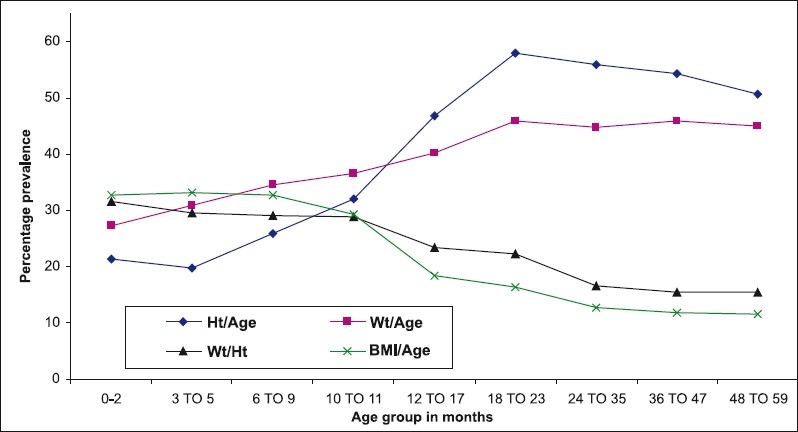
Prevalence of undernution relation to age.
Discussion
Indian infants begin life with a disadvantage due to poor intrauterine growth; at birth one third of Indian infants are underweight and wasted and 20 per cent are stunted20. Maternal factors associated with low birth weight (LBW) such as low maternal height and low pre-pregnancy weight cannot be modified during pregnancy. Low birth weight can be due to preterm birth, intrauterine growth retardation or both. Preterm low birth weight neonates require intensive care for survival, mature low birth weight infants survive with essential new born care21,22. In India one third of the infants are born with low birth weight but only 12 per cent are preterm births20,23. Data from Sri Lanka and Kerala, India over the last three decades confirm that with near universal access to essential newborn care, it is possible to achieve low infant mortality rate inspite of relatively high LBW rates in South Asian countries because these neonates are mature24.
Analysis of data on changes in prevalence of undernutrition as assessed by height for age, weight for age and BMI for age revealed some interesting findings. Indian infants begin their life with a lower in weight, height and BMI. During the first three month, there was no increase in underweight and stunting rates. This might be because the energy needs were met as most of the infants were are exclusively breast fed and nutrition toll of infection was low because of low morbidity rates. Increase in underweight rates between 3-5 months appears to be associated with introduction of animal milk and increase in morbidity due to infections. The further rise in underweight and stunting rates between 6-11 months might be due to late introduction, inadequate quantity and low calorie density of complementary feeds and increase in morbidity due to infections. Increase in the underweight and stunting rates between 12-23 months could be the result of inadequate energy intake when children shift to household diet. This is not due to household food insecurity, but poor child feeding habits. Young children need to be fed 5-6 times a day to meet their food requirements from the habitual household diets with low calorie density24. Low BMI for age and wasting rates were highest at birth reflecting the adverse impact of intrauterine undernutrition. The steady decline in the wasting and low BMI rates between 9-23 months is due to poor linear growth and steep increase in stunting rates in this period. This should not be interpreted as improvement in nutritional status of children.
The observed changes in undernutrition rates as assessed by weight, height and BMI for age can be explained on the basis of the response of these indices to chronic energy deficiency. Initial impact of energy deficit is wasting because energy is mobilized form fat deposits and muscle to bridge the gap between energy requirement and energy intake. If energy deficit is quickly corrected, wasting is reversed and the linear growth of children continues normally. If however the energy deficit persists, stunting occurs. These stunted children may have normal BMI for their height. If energy intake is inadequate even to meet the requirement of the stunted child, the stunted child develops wasting and the vicious cycle of wasting and stunting continue.
Weight, height and BMI for age are parameters for assessment of nutritional status in children. Of these, weight for age is the most widely used indicator for assessment of nutritional status because of ease of measurement. Children can be underweight because they are stunted, or wasted or stunted and wasted. Underweight cannot distinguish between current or past or past and current energy deficit. Stunting is an index of cumulative past energy deficit but does not reflect current energy status. BMI is an index of current energy deficit because it is computed from current weight and current height of children. As low BMI is the indicator of current energy deficit, early detection of low BMI for age and expeditious correction of it is likely to be the most effective intervention for preventing stunting. Prevention of stunting in the first two years of life is important, because once stunting has occurred, it may not readily reversible. Stunting in the first two years may be associated with low adult height and be a factor especially in women for lower birth weight in their offsprings – the trans-generational impact of childhood undernutrition20,25.
WHO growth standards (2006) state that BMI for age can used for detection of under- and overnutrition in preschool children. However, BMI for age has not been widely used as a method for detection of undernutrition in developing countries perhaps because there had not been many studies demonstrating the association between low BMI and functional decompensation such as increased risk of morbidity due to infections. Recently it has been reported that wasting at six months was a good predictor of infant mortality in India26. Relative risk of morbidity has been shown to be higher and more consistently associated with low BMI in Indian preschool children27. Use of BMI for assessment of current nutritional status in Indian children is essential in all settings where length / height measurements are possible because (i) early detection of current energy inadequacy leading to low BMI and intervention to correct it can prevent stunting; this is critical because stunting cannot be reversed; (ii) majority of Indian stunted children have appropriate weight for their height and age (normal BMI/age); increase energy intake may make them prone to overnutrition; and (iii) undernutrition in early childhood followed by rapid increase in body mass index in early/ late childhood/ adolescence may predispose to overnutrition and non-communicable disease risk in early adult life28.
Use of WHO 2006 standards for assessment of underweight/stunting in Indian children clearly brings out the importance of low birthweight, too early introduction of breast milk substitutes, too late introduction of complementary feeds, poor young child feeding practices, high morbidity rates due to infections and poor access to health care as major factors associated with increase in underweight/stunting rates in infants and young children. These data can used for advocacy and awareness building for two critical interventions to improve nutritional status of young children, namely nutri-tion education to ensure appropriate infant and child feeding practices, and health education to improve timely access to health care.
Convergence of services under National Rural Health Mission and Integrated Child Development Services can improve access to both nutrition and health education and care in India and effective implementation of these programmes can bring about improvement both in the health and nutritional status of preschool children.
References
- 1.de Onis M, Blössner M. The World Health Organization Global Database on Child Growth and Malnutrition: methodology and applications. Int J Epidemiol. 2003;32:518–26. doi: 10.1093/ije/dyg099. [DOI] [PubMed] [Google Scholar]
- 2.Garza C, de Onis M. Rationale for developing a new international growth reference. Food Nutr Bull. 2004;25(Suppl 1):S5–14. doi: 10.1177/15648265040251S102. [DOI] [PubMed] [Google Scholar]
- 3.de Onis M, Onyango AW, Borghi E, Garza C, Yang H for the WHO Multicentre Growth Reference Study Group. Comparison of the World Health Organization (WHO) Child Growth Standards and the National Center for Health Statistics/WHO international growth reference: implications for child health programmes. Public Health Nutr. 2006;9:942–7. doi: 10.1017/phn20062005. [DOI] [PubMed] [Google Scholar]
- 4.The WHO Child Growth Standards. [accessed on December 24, 2008]. Available from: http://www.who.int/childgrowth/standards/en/
- 5.Greer FR. Groups compare CDC, WHO growth curves. [accessed December 24, 2008];Am Acad Pediatr News. 2006 27:1–22. Available from: http://aapnews.aapublications.org/cgi/content/full/27/9/1-b . [Google Scholar]
- 6.de Onis M, Garza C, Onyango AW, Borghi E. Comparison of the WHO child growth standards and the CDC 2000 Growth Charts. J Nutr. 2007;137:144–8. doi: 10.1093/jn/137.1.144. [DOI] [PubMed] [Google Scholar]
- 7.Wright C, Lakshman R, Emmett P, Ong KK. Implications of adopting the WHO 2006 Child Growth Standard in the UK: two prospective cohort studies. Arch Dis Child. 2008;93:566–9. doi: 10.1136/adc.2007.126854. [DOI] [PMC free article] [PubMed] [Google Scholar]
- 8.Lopriore C, Dop MC, Solal-Celigny A, Lagnado G. Excluding infants under 6 months of age from surveys : impact on prevalence of pre-school undernutrition. Public Health Nutr. 2007;10:79–87. doi: 10.1017/S1368980007219676. [DOI] [PubMed] [Google Scholar]
- 9.Myatt M, Duffield A. Weight-for-height and MUAC for estimating the prevalence of acute undernutrition? [accessed on April 14, 2009]. Available from: www.humanitarianreform.org/humanitarianreform/Porteals/1/cluster%20approach%20pages/Nutrition/Myatt_SAVE_UK_MUAC_Nutritior .
- 10.Seal A, Kerac M. Operational implications of using 2006 World Health Organization growth standards in nutrition programmes: secondary data analysis. BMJ. 2007;334:733. doi: 10.1136/bmj.39101.664109.AE. [DOI] [PMC free article] [PubMed] [Google Scholar]
- 11.Ergo A, Gwatkin DR, Shekar M. What difference do the new WHO child growth standards make for the prevalence and socioeconomic distribution of undernutrition. Food Nutr Bull. 2009;30:3–15. doi: 10.1177/156482650903000101. [DOI] [PubMed] [Google Scholar]
- 12.Ramachandran P. Adoption of WHO growth standards (2006)-issues and implications. NFI Bull. 2007;28:1–6. [Google Scholar]
- 13.Prinja S, Thakur JS, Bhatia SS. Pilot testing of WHO child growth standards in Chandigarh : Implications for India's child health programmes. Bull World Health Organ. 2009;87:116–22. doi: 10.2471/BLT.08.051789. [DOI] [PMC free article] [PubMed] [Google Scholar]
- 14.Tarozzi A. Growth reference charts and the nutritional status of Indian children. Eco Hum Biol. 2008;6:455–68. doi: 10.1016/j.ehb.2008.07.004. [DOI] [PubMed] [Google Scholar]
- 15.International Institutes of Population Sciences (IIPS), Mumbai. Final report of the National Family Health Survey - 3. [accessed on June 25, 2010]. Available from: www.nfhsindia.org/nfhs3.html .
- 16.Brahmam GNV. Kolkatta, India: 2006. Nov, Nutritional Status of < 5 years children, using WHO growth standards, presented in XXXVII, Annual Conference, Nutrition Society of India. [Google Scholar]
- 17.Arnold F. The Nutrition Landscape in India : findings from the National Family Health Surveys. Demogr India. 2007;36:181–213. [Google Scholar]
- 18.Nigam AK. Determining grades of malnutrition in children: an appraisal of approaches used in India. In: Pandey A, editor. Biostatistical aspects of health and population. New Delhi: Hindustan Publishing Corporation; 2006. pp. 106–81. [Google Scholar]
- 19.International Obesity Task Force. Assessment of childhood and adolescent obesity. Results from an International Obesity Task Force Workshop. Dublin, June 16, 1997. Am J Clin Nutr. 1999;70:117S–75S. [PubMed] [Google Scholar]
- 20.Ramachandran P. Nutrition transition in India 1947-2007. [accessed on June 25, 2010]. Available from: http//www.wcd.nic.in//publications .
- 21.Yerushalmy J. The classification of newborn infants by birth weight and gestational age. J Pediatr. 1967;71:164–72. doi: 10.1016/s0022-3476(67)80067-2. [DOI] [PubMed] [Google Scholar]
- 22.Yerushalmy J. Relation of birth weight, gestational age, and the rate of intrauterine growth to perinatal mortality. Clin Obstet Gynecol. 1970;13:107–29. doi: 10.1097/00003081-197003000-00008. [DOI] [PubMed] [Google Scholar]
- 23.Ghosh S, Bhargava SK, Madhavan S, Taskar AD, Bhargava V, Nigam SK. Intra-uterine growth of North Indian babies. Pediatrics. 1971;47:826–30. [PubMed] [Google Scholar]
- 24.UNICEF. The State of the World's Children 2009. [accessed on April 23, 2009]. Available from: www.unicef.org./sowc09/docs/SOWC09FullReport-En.pdf .
- 25.Victora CG, Adair L, Fall C, Hallal PC, Martorell R, Richter L, et al. Maternal and Child Undernutrition Study Group. consequences for adult health and human capital. Lancet. 2008;371:340–57. doi: 10.1016/S0140-6736(07)61692-4. [DOI] [PMC free article] [PubMed] [Google Scholar]
- 26.Vesel L, Bahl R, Martines J, Penny M, Bhandari N, Kirkwood BR. WHO Immunization-linked Vitamin A Supplementation Study Group. Use of new World Health Organization child growth standards to assess how infant malnutrition relates to breastfeeding and mortality. Bull World Health Organ. 2010;88:39–48. doi: 10.2471/BLT.08.057901. [DOI] [PMC free article] [PubMed] [Google Scholar]
- 27.Ramachandran P, Gopalan HS. Undernutrition & risk of infections in preschool children. Indian J Med Res. 2009;130:579–83. [PubMed] [Google Scholar]
- 28.Bhargava SK, Sachdev HS, Fall CD, Osmond C, Lakshmy R, Barker DJ, et al. Relation of serial changes in childhood body mass index to impaired glucose tolerance in young adulthood. N Engl J Med. 2004;350:865–75. doi: 10.1056/NEJMoa035698. [DOI] [PMC free article] [PubMed] [Google Scholar]


