

Abstract
Rapamycin inhibits the TOR kinases, which regulate cell proliferation and mRNA translation and are conserved from yeast to man. The TOR kinases also regulate responses to nutrients, including sporulation, autophagy, mating, and ribosome biogenesis. We have analyzed gene expression in yeast cells exposed to rapamycin using arrays representing the whole yeast genome. TOR inhibition by rapamycin induces expression of nitrogen source utilization genes controlled by the Ure2 repressor and the transcriptional regulator Gln3, and globally represses ribosomal protein expression. gln3 mutations were found to confer rapamycin resistance, whereas ure2 mutations confer rapamycin hypersensitivity, even in cells expressing dominant rapamycin-resistant TOR mutants. We find that Ure2 is a phosphoprotein in vivo that is rapidly dephosphorylated in response to rapamycin or nitrogen limitation. In summary, our results reveal that the TOR cascade plays a prominent role in regulating transcription in response to nutrients in addition to its known roles in regulating translation, ribosome biogenesis, and amino acid permease stability.
Keywords: Rapamycin, TOR kinase, signal transduction
Rapamycin inhibits a conserved signaling cascade required for cell proliferation (Thomas and Hall 1997; Cardenas et al. 1998; Cutler et al. 1999). Rapamycin action is mediated by binding to the FKBP12 prolyl isomerase, and the FKBP12–rapamycin complex in turn inhibits conserved protein kinase homologs, Tor1 and Tor2 in yeast, and mTOR/FRAP/RAFT1 in mammalian cells (Heitman et al. 1991; Cafferkey et al. 1993; Kunz et al. 1993; Brown et al. 1994; Helliwell et al. 1994; Sabatini et al. 1994; Cardenas and Heitman 1995; Sabers et al. 1995; Zheng et al., 1995; Alarcon et al. 1996). The yeast Tor proteins and mammalian mTOR have intrinsic protein kinase activity (Brown et al. 1995; Brunn et al. 1997; Alarcon et al. 1999; Jiang and Broach 1999).
The TOR kinases are essential for viability and regulate translation initiation and cell cycle progression (Heitman et al. 1991; Kunz et al. 1993; Barbet et al. 1996). Depletion of TOR or exposure to rapamycin inhibits translation in yeast by destabilizing the initiation factor eIF4G (Berset et al. 1998). mTOR regulates translation in mammalian cells via p70 S6 kinase and the PHAS-I inhibitor of the CAP-binding protein eIF-4E (Graves et al. 1995; Lawrence and Abraham 1997). mTOR phosphorylates PHAS-I in vitro and regulates PHAS-I phosphorylation in vivo (Lin et al. 1995; von Manteuffel et al. 1996; Brunn et al. 1997; Burnett et al. 1998). Phosphorylation causes PHAS-I to release eIF-4E, which then interacts with eIF4G to form a productive 5′CAP-binding complex and initiate translation.
The yeast Tap42 protein and a homologous mammalian protein α4 have been implicated as targets of the TOR pathway. Tap42 is an essential protein that associates with protein phosphatase 2A (PP2A) subunits and regulates translation initiation in yeast (Di Como and Arndt 1996). Rapamycin treatment or nutrient deprivation disassociates Tap42 from the PP2A subunits Sit4, Pph21, and Pph22. Tap42 is a phosphoprotein in vivo and the Tor2 kinase regulates Tap42 phosphorylation (Jiang and Broach 1999). The mammalian α4 protein is homologous to yeast Tap42 (Chen et al. 1998) and its association with PP2A is also perturbed by rapamycin (Murata et al. 1997; Inui et al. 1998).
The Tor kinases play a role in nutrient sensing in yeast and mammalian cells. In yeast, the TOR kinases regulate sporulation and autophagy (Zheng and Schreiber 1997; Noda and Ohsumi 1998). TOR also regulates the Npr1 protein kinase that is required for the stabilization or degradation of amino acid permeases in response to nutrients (Schmidt et al. 1998). Rapamycin represses transcription of rRNA and tRNA by inhibiting RNA polymerases I and III (Zaragoza et al. 1998), and inhibits ribosome biogenesis (Powers and Walter 1999). In the fission yeast Schizosaccharomyces pombe, rapamycin has no effect on vegetative growth, but blocks mating in response to nitrogen starvation (Weisman et al. 1997). In mammalian cells, the mTOR kinase is activated by amino acids (Hara et al. 1998; Xu et al. 1998; Kimball et al. 1999) and regulates autophagy in cultured hepatocytes (Shigemitsu et al. 1999).
Signaling cascades enable yeast cells to shift from the utilization of abundant levels of good nitrogen sources to either poorer nitrogen sources or limiting concentrations of good nitrogen sources (Magasanik 1992). Glutamine synthetase plays a central role in nitrogen metabolism by converting ammonium to glutamine (Mitchell and Magasanik 1983). Intracellular glutamine is sensed by a pathway involving the Ure2 repressor, which binds and inhibits glutamine synthetase (Gln1) and the transcriptional activator Gln3 (Courchesne and Magasanik 1988; Coschigano and Magasanik 1991; Xu et al. 1995; Blinder et al. 1996). When cells are shifted to poor or limiting nitrogen sources, intracellular glutamine decreases, Ure2 is inactivated, and glutamine synthetase and Gln3 are activated, increasing glutamine and inducing nitrogen utilization genes. Gln3 activates genes encoding glutamine synthetase (Gln1), glutamate synthase (Glt1), glutamate dehydrogenase (Gdh1 and Gdh2), permeases for nitrogenous compounds (Gap1 and Mep2), enzymes involved in nitrogen source metabolism (Dal3 and Put1), and transcription factors that regulate gene expression (Dal80 and Dal82) (Mitchell and Magasanik 1984; Minehart and Magasanik 1991; Stanbrough et al. 1995). How cells sense nitrogen, how glutamine regulates Ure2, and how Ure2 regulates Gln3 are not known.
Gene expression analysis with yeast genome arrays reveals that rapamycin has profound effects on gene transcription, inducing nitrogen catabolite-repressed genes regulated by Gln3 and Ure2 and globally repressing ribosomal protein expression. Moreover, mutations in genes encoding nitrogen source regulatory proteins, including Ure2, Gln3, Npr1, and Npi1, were found to modulate rapamycin action. We show that Ure2 is a phosphoprotein in vivo whose phosphorylation state is regulated by nutrients and TOR kinase. In conclusion, the TOR kinases function in a signaling cascade that detects nitrogen sources and regulates gene expression.
Results
Rapamycin induces transcription of nitrogen catabolite-repressed genes and represses expression of ribosomal proteins
The TOR cascade is known to regulate translation in yeast and mammalian cells. Here, we tested whether the TOR cascade also regulates gene transcription. For this purpose, yeast cells were exposed to rapamycin and mRNA was isolated and hybridized to yeast whole-genome arrays. This analysis revealed that the expression of multiple genes was altered by rapamycin. Most importantly, a set of genes known to be transcriptionally induced by Gln3 was increased from 5- to 50-fold following rapamycin exposure (Table 1). These genes have been characterized previously as the nitrogen catabolite-repressed genes, which are repressed in the presence of abundant rich nitrogen sources by Ure2-dependent inhibition of Gln3, and induced in a Gln3-dependent fashion when cells are grown with limiting quantities of good nitrogen sources (glutamine and ammonia) or poor nitrogen sources (proline and urea) (Magasanik 1992). These genes encode nitrogen metabolizing enzymes, including glutamate dehydrogenase (Gdh1 and Gdh2), plasma membrane permeases for nitrogenous compounds, including the general amino acid permease (Gap1), the high affinity ammonium permease (Mep2), and the high affinity proline permease (Put4), and enzymes involved in the catabolism of nitrogen sources, including allantoin utilization (Dal1 and Dal3), urea degradation (Dur1,2), and GABA catabolism (Uga1) (Table 1).
Table 1.
Rapamycin induces expression of nitrogen catabolite repressed genes
| Gene
|
Fold induction
|
Gene product/function
|
|---|---|---|
| Permeases | ||
| MEP2 | 46.2 | high-affinity ammonium permease |
| DAL5 | 19.2a | allantoate and ureidosuccinate permease |
| GAP1 | 7.3 | general amino acid permease |
| DAL4 | 5.1a | allantoin permease |
| PUT4 | 4.5a | high affinity proline permease |
| CAN1 | 4.3 | arginine permease |
| General catabolism | ||
| GDH2 | 5.0 | glutamate dehydrogenase (NAD) |
| GLT1 | 3.0 | glutamate synthase |
| GDH1 | 1.4 | glutamate dehydrogenase (NADP) |
| GLN1 | 0.0 | glutamine synthetase |
| Specific catabolism | ||
| DUR1,2 | 16.0 | urea degradation |
| DAL3 | 15.7a | allantoin utilization (ureidoglycolate hydrolase) |
| PUT1 | 11.7a | proline catabolism |
| DAL1 | 7.9a | allantoin utilization (allantoinase) |
| UGA1 | 5.6 | GABA catabolism |
| PUT2 | 2.8 | proline catabolism |
| DAL7 | 1.6a | allantoin degradation (malate synthetase) |
| DAL2 | 1.5a | allantoin utilization (allantoicase) |
| Transcriptional regulation | ||
| DAL80/UGA43 | 8.2 | transcriptional repressor |
| GAT1/NIL1 | 3.1 | transcriptional activator |
| DAL82 | 2.5 | transcriptional repressor |
| Central regulators | ||
| GLN3 | 2.0a | transcriptional activator |
| URE2 | 2.2 | inhibitor of Gln3 and glutamine synthetase |
| NPR1 | 4.2 | serine/threonine kinase |
Strain MLY41 was grown to early exponential phase and treated with or without 0.2 μg/ml rapamycin for 2 hr. Cells were harvested and poly(A) RNA was isolated and processed for yeast genome analysis. Note that the results shown are fold of gene induction (above) or repression (Table 2) observed in the rapamycin-treated sample using the untreated sample as the baseline. Note that maximal induction of the GLN1 gene occurs at 1 hr after treatment (see Fig. 1), and at 2 hr expression has returned to the original uninduced level.
No signal detected in untreated cells.
To confirm these findings obtained by hybridization to whole genome arrays, mRNA was isolated from cells exposed to rapamycin for 0, 15, 30, 60, or 120 min and subjected to Northern blot analysis (Fig. 1). This analysis provided independent confirmation that the GAP1, MEP2, and GLN1 genes are induced by rapamycin, and also revealed that gene induction occurs rapidly following rapamycin addition. Other genes known to be induced by nutrient limitation, such as SNZ1, were induced by rapamycin only at later time points (Fig. 1). In contrast to rapamycin, the protein synthesis inhibitor cycloheximide did not affect GAP1, MEP2, or GLN1 expression (Fig. 1). These findings support a model in which the TOR cascade regulates nitrogen source utilization gene expression in response to nutrients.
Figure 1.
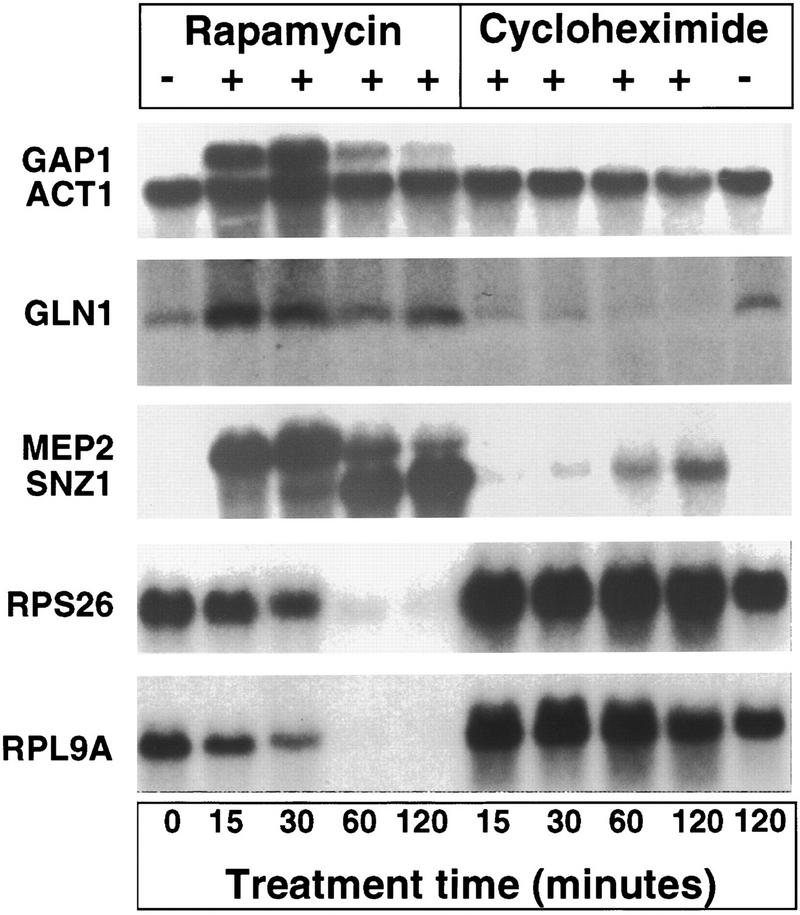
Rapamycin induces and represses gene expression. The wild-type yeast strain MLY41 was grown to early exponential phase, and treated with or without 0.2 μg/ml rapamycin or 10 μg/ml cycloheximide for 15, 30, 60, and 120 min, as indicated. RNA was prepared and analyzed by Northern blot with radioactive probes that hybridize to the genes indicated at left. Hybridization to the actin gene (ACT1) served as a loading control.
Consistent with a recent report (Powers and Walter 1999), analysis of gene expression with whole-genome arrays revealed a marked and global repression of the vast majority of the genes encoding cytoplasmic, but not mitochondrial, ribosomal proteins (Table 2). Northern blot analysis confirmed that rapamycin represses expression of two specific cytoplasmic ribosomal proteins (Rpl9A and Rps26) (Fig. 1). In contrast, cycloheximide treatment modestly stimulated the transcription of these ribosomal protein genes (Fig. 1). These observations confirm that the TOR cascade functions to regulate transcription of ribosomal components in addition to the known effects of the TOR-signaling cascade on translation.
Table 2.
Rapamycin represses expression of ribosomal proteins
| Gene
|
Fold change
|
Gene product
|
|---|---|---|
| Ribosomal proteins | ||
| RPL9A | −43.2 | ribosomal protein YL11 |
| RPS26A | −22.1 | ribosomal protein S26 |
| RPL6B | −16.6 | ribosomal protein YL8B |
| RPL10E | −6.8 | 60S ribosomal protein P0 |
| CRY2 | −6.5 | ribosomal protein CRY1 (rp59) |
| RPS18B | −6.1 | ribosomal protein S18 |
| URP1 | −5.4 | ribosomal protein URP1 |
| RPS28B | −5.2 | ribosomal protein rp28 |
| RPS5 | −4.6 | ribosomal protein S5 |
| RPS3 | −3.7 | ribosomal protein RPS3 |
| RPS26B | −3.4 | ribosomal protein S26 |
| RPS28A | −3.2 | ribosomal protein S28 |
| RPS25 | −2.5 | ribosomal protein S21 |
| RPL37A | −2.4 | ribosomal protein L25 |
| RPS33B | 0.0 | ribosomal protein S33 (YL27) |
| RPL4B | 9.9 | ribosomal protein L4B (YL5) |
| Mitochondrial ribosomal proteins | ||
| MRPL27 | 0.0 | MRPL27 |
| MRPL39 | 1.5 | MRPL39 |
| MRPL33 | 1.6 | MRPL33 |
| MRPL36 | 1.8 | MRPL36 |
Proteins that regulate utilization of nitrogen sources play a role in TOR signaling
Next, we sought to establish whether the ability of the TOR cascade to regulate Ure2 and Gln3-regulated genes results in physiological alterations in rapamycin action. gln3 mutant strains were partially resistant to rapamycin, whereas ure2 mutant strains were rapamycin hypersensitive (Fig. 2A). The fact that the ure2 and gln3 mutations confer opposite phenotypes is in accord with their known effects on Gln3-mediated gene expression, namely that ure2 mutations derepress Gln3-regulated genes, whereas gln3 mutations impair gene induction by nitrogen limitation (Magasanik 1992). A ure2 gln3 double mutant exhibited the rapamycin-resistant phenotype conferred by the gln3 single mutation (not shown), indicating that the effects of the gln3 mutation are epistatic to the ure2 mutation, in accord with a linear pathway in which Ure2 inhibits Gln3.
Figure 2.

Mutations affecting nitrogen-source utilization alter rapamycin toxicity. (A) Isogenic wild-type (MLY41) and Δgln3 (MLY139), Δure2 (MLY140a), Δnpr1 (MLY54a), npi1 (MLY141a), and fpr1 (MLY88) mutant strains were grown on YPD medium containing 0, 10, or 50 ng/ml rapamycin and incubated for 3 days at 30°C. (B) Isogenic wild-type (MLY41) and Δure2 (MLY140a), TOR2-1 (MLY152α), TOR2-1 Δure2 (MLY158α), TOR1-4 (MLY90-1), TOR1-4 Δure2 (MLY148α), fpr1 (MLY88), and fpr1 Δure2 (MLY146a) mutant strains were grown on YPD medium containing 0 or 100 ng/ml rapamycin and incubated for 3 days at 30°C.
To further test whether Ure2 is a component of the TOR cascade, we addressed whether the ure2 mutation alters the level of rapamycin resistance conferred by TOR2, TOR1, or fpr1 mutations. As shown in Figure 2B, the ure2 mutation significantly reduced the level of rapamycin resistance conferred by the dominant TOR2-1 or TOR1-4 mutations. Because rapamycin can only inhibit the wild-type Tor1 kinase in the ure2 TOR2-1 mutant cells, or the wild-type Tor2 kinase in the ure2 TOR1-4 mutant cells, the simplest explanation is that both Tor1 and Tor2 are required for rapamycin resistance in cells lacking Ure2. In comparison, the ure2 mutation had no effect on rapamycin resistance conferred by FKBP12 mutations, because in these mutant cells, rapamycin is unable to interact with TOR (Fig. 2B).
The level of rapamycin resistance or hypersensitivity conferred by gln3 and ure2 mutations was found to be similar to that afforded by mutations affecting the Npr1 kinase and Npi1 ubiquitin ligase (Fig. 2A), which function in a nutrient-regulated TOR pathway controlling nutrient permeases (Schmidt et al. 1998). A kinase-inactive Npr1 mutant did not restore rapamycin sensitivity of npr1 mutants, indicating kinase activity is important for function (not shown). In contrast, the npi1 mutation conferred rapamycin hypersensitivity (Fig. 2A), and suppressed rapamycin resistance conferred by npr1 or TOR mutations (not shown). Mutations in permeases regulated by Npr1 or Npi1, including Gap1, Mep1, Mep2, and Mep3, had little or no effect on rapamycin action (data not shown); hence, other Npr1 and Npi1 targets in the Tor pathway remain to be identified. Drug import assays revealed no effect of the gln3 or ure2 mutations on rapamycin import (data not shown), and taken together, these findings indicate altered rapamycin sensitivity is not attributable to alterations in drug uptake.
Tor regulates phosphorylation of nitrogen source regulator Ure2
The Ure2, Gln3, Npr1, and Npi1 nitrogen source regulators could alter sensitivity to rapamycin by regulating Tor1 or Tor2 expression, or as regulators or effectors of the TOR cascade. By Western blot analysis, the ure2, gln3, npr1, and npi1 mutations did not alter Tor1 or Tor2 expression (not shown).
Tor inhibition had only modest effects on GLN3 and URE2 gene expression, suggesting that rapamycin exerts a posttranscriptional effect. Next, we tested the hypothesis that Ure2 is a phosphoprotein regulated by the TOR pathway. By Western blot analysis with specific polyclonal antisera, the Ure2 protein migrated as either a single species, or, in some cases, as two species, in SDS-PAGE analysis of total protein extracts from vegetative cells grown in rich medium (Fig. 3). Importantly, treatment with 0.2 μg/ml rapamycin led to a rapid increase in the electrophoretic mobility of the faster-migrating form of Ure2, concomitant with the disappearance of the slower-migrating form of Ure2 (Fig. 3A,B). The effect of rapamycin on the mobility of Ure2 was blocked in an fpr1 rapamycin-resistant mutant (Fig. 3A,B). When cells growing in rich medium were shifted to SLAD medium limiting for ammonium, a similar and rapid increase in the electrophoretic mobility of Ure2 was observed (Fig. 3A). When protein extracts from cells grown in rich medium in the absence of rapamycin were treated with alkaline phosphatase, the mobility of the Ure2 protein was increased to an extent similar to that observed with rapamycin treatment or nutrient limitation (Fig. 3B). We conclude that Ure2 is a phosphoprotein that is rapidly dephosphorylated following exposure to rapamycin or nitrogen limitation.
Figure 3.

Tor and nutrients regulate the phosphorylation state of Ure2. (A) The isogenic wild-type (WT, strain MLY41) and Δfpr1 mutant strain (strain MLY88) were grown to early exponential phase (OD600 = 0.4) in YPD medium and treated with 0.2 μg/ml rapamycin for 0, 15, and 30 min. Alternatively, the isogenic wild-type strain MLY41 was grown as above, washed with SLAD ammonium limiting medium, and then incubated in SLAD medium for 15 and 30 min. Total cell extracts were prepared and 100 μg of protein analyzed by SDS-PAGE (12.5%) and Western blot with Ure2 antibodies. Cell extract from a Δure2 mutant strain (strain MLY140a) was included as a control for antisera specificity. (Arrows) The migration position of phosphorylated isoforms of Ure2; (*) a protein that crossreacts nonspecifically with the anti-Ure2 antisera. (B) Protein cell extract from wild-type strain MLY41 was incubated with 4 units of alkaline phosphatase for 30 min at 37°C. Protein extracts from rapamycin treated or untreated wild-type strain (MLY41) or the Δfpr1 mutant strain (MLY88), as indicated, were mock incubated and loaded in lanes 1, 3, 4, and 5 to compare the mobility of phosphorylated and dephosphorylated Ure2. Note that cell extracts in A were analyzed in 12.5% SDS–polyacrylamide gels; the extracts in B were fractionated in 10% SDS-PAGE for a longer period of time, which could explain the greater separation of phosphorylated and dephosphorylated Ure2 observed in B.
Because the Tor kinase is known to regulate association of the Tap42 regulatory subunit with protein phosphatase 2A (Di Como and Arndt 1996; Jiang and Broach 1999), we addressed whether Tor regulates Ure2 via Tap42. When a strain expressing a Tap42-11 conditional mutant was shifted from 24°C to 37°C, analysis of gene expression by hybridization to whole genome arrays revealed no induction of the nitrogen utilization genes regulated by the Tor pathway (not shown). The tap42-11 mutation confers partial resistance to rapamycin (DiComo and Arndt 1996). However, by Northern blot analysis, rapamycin still induced expression of the GAP1 and MEP2 genes, and repressed expression of the RPS26 ribosomal protein gene, in a tap42-11 mutant strain compared with the isogenic TAP42 wild-type strain at the permissive growth temperature (not shown). These observations suggest that the Tor pathway may not regulate Ure2 and Gln3 via the Tap42 regulatory subunit of PP2A.
Discussion
The TOR kinases are the targets of rapamycin in complex with the cellular protein FKBP12, and both TOR and FKBP12 are conserved from yeast to man. The TOR kinases regulate translation via divergent mechanisms in mammalian cells (PHAS-I, p70 S6 kinase) and yeast cells (eIF4G stability). Recent studies have revealed that the TOR kinase pathway also regulates cellular responses to nutrients. Here, we examined whether the Tor pathway regulates gene expression in yeast cells.
Whole-genome array analysis revealed that inhibiting the Tor kinase with rapamycin has profound effects on the transcription of many yeast genes. Rapamycin rapidly induces expression of nitrogen-source utilization genes (nitrogen catabolite-repressed genes) known to be regulated by the repressor Ure2 and the transcription factor Gln3. In contrast, another protein synthesis inhibitor, cycloheximide, does not induce the nitrogen catabolite-repressed genes (Fig. 1). Rapamycin also globally represses expression of ribosomal proteins, in accord with recent reports that rapamycin inhibits ribosome biogenesis and rRNA and tRNA gene expression (Zaragoza et al. 1998; Powers and Walter 1999).
We have found that nitrogen-source regulators play a general role in rapamycin toxicity in yeast. Mutations in the gene encoding the Ure2 repressor, the Gln3 transcriptional activator, and the Npr1 kinase and Npi1 ubiquitin ligase confer either rapamycin resistance (gln3, npr1) or hypersensitivity (ure2, npi1). We show that the Ure2 protein is a phosphoprotein. Ure2 is rapidly dephosphorylated following nutrient limitation or inhibition of the TOR kinases with rapamycin, with a time course similar to induction of the Ure2-repressed genes by rapamycin. As outlined in Figure 4, our findings support a model in which the TOR kinase pathway responds to nutrients, and regulates nitrogen-utilization gene expression by regulating the phosphorylation of Ure2 and thereby modulating interaction with, and inhibition of, Gln3. Such a model is analogous to the role of Tor in regulating phosphorylation and interaction of Tap42 with PP2A in yeast cells, of the Tap42 homolog α4 regulator of PP2A in mammalian cells, and of the PHAS-I inhibitor of eIF4E in mammalian cells. Recent studies have revealed a similar role for the Tor kinases in regulating nutrient permease stabilization and degradation by the Npr1 kinase (Schmidt et al. 1998). Mutations in Gln3 and Npr1 nitrogen-source regulators result in relative, but not absolute, rapamycin resistance, indicating that these mutations likely represent two of several independent signaling branches downstream of the TOR kinase (see Fig. 4), such that mutation of any one branch confers only partial drug resistance.
Figure 4.

The TOR signaling cascade regulates gene expression in response to nutrients. The Tor proteins are activated by nutrients, and regulate the expression of genes involved in the utilization of nitrogen sources via Ure2 and Gln3, ribosome biogenesis by RNA polymerases, and amino acid permease stability.
Activation of TOR and implications for rapamycin action in mammalian cells
Our studies implicate a role for the TOR-signaling cascade in sensing nitrogen sources in yeast cells. How the TOR kinases are activated is not understood, but recent findings in both yeast and mammalian cells suggest possible models involving the sensing of amino acids. Rapamycin has been thought to inhibit signaling pathways required for mammalian cells to respond to growth factors, such as interleukin-2 and insulin (Kuo et al. 1992; Price et al. 1992). However, rapamycin also inhibits response to nutrients, such as amino acids, which may activate a TOR-signaling cascade that functions in parallel with growth factor-signaling cascades to promote cell proliferation. For example, the p70 S6 kinase is activated by the mTOR-signaling pathway in response to either glutamine or leucine (Fox et al. 1998; Hara et al. 1998; Xu et al. 1998; Kimball et al. 1999). How these amino acids are sensed by mammalian cells is not yet known. Activation of p70 S6 kinase by the Tor pathway is inhibited in cells expressing conditional tRNA synthetase mutants, or in which tRNA synthetases are inhibited with amino acid alcohols. Thus, charged tRNAs may activate mTOR, or uncharged tRNAs might inhibit mTOR (Iiboshi et al. 1999b).
Rapamycin may have novel clinical indications as a chemotherapy agent for rapamycin-sensitive tumors, which include glioblastoma and prostate carcinoma (Dilling et al. 1994; Shi et al. 1995; Hosoi et al. 1999; Louro et al. 1999). The spectrum of rapamycin action might also be extended by applying insights derived from basic studies on rapamycin-sensitive signaling cascades. For example, the enzyme asparaginase is used to treat acute lymphoblastic leukemia, and exogenous asparaginase sensitizes cultured mammalian cells to rapamycin, possibly by reducing extracellular levels of glutamine and asparagine and thereby impairing TOR-dependent cell proliferation (Iiboshi et al. 1999a). Clearly, much still remains to be learned about TOR regulation of nutrient signaling, but studies in yeast continue to provide insights into conserved pathways as targets for therapy.
Materials and methods
RNA isolation and Northern analysis
Strain MLY41a was grown to an OD600 of 0.4 and treated or not treated with 0.2 μg/ml rapamycin for various periods of time as indicated in figure legends. Cells were harvested by centrifugation, washed with DEPC-treated water, and immediately frozen in an ethanol dry-ice bath. Total RNA was isolated from 50 OD600 units of cells by use of the RNeasy Mini kit from Qiagen, according to the manufacturer's instructions. RNA was quantified by spectrophotometry, actin mRNA level was detected by autoradiography in an initial gel, and equal amounts of RNA normalized to the level of the actin message were loaded on 5% formaldehyde and 1.2% agarose gels. Gels were electrophoresed in 20 mm MOPS (pH 7.0), 5 mm NaOAc, and 1 mm EDTA. RNA was transfered to Nytran Plus membranes (Schleicher & Schuell) and cross-linked by UV irradiation. The membranes were then incubated for 2 hr at 42°C in prehybridization solution (5× SSC, 5× Denhardt's solution, 50% formamide, 0.2% SDS, 10 mg/ml salmon sperm DNA) and the 32P-labeled radioactive probe was added and hybridized overnight at 42°C. The membranes were washed twice in 2× SSC at 42°C and four times at 62°C in 2× SSC, 0.2% SDS. RNA was visualized by autoradiography. Northern probes were labeled with [α-32P]dCTP with the random primer labeling kit from Stratagene. Quantitation of Northern blots was performed on a Molecular Dynamics Storm 860 PhosphorImager.
Gene chip hybridization and analysis
Total RNA preparation for gene array analysis was scaled up for 200 OD600 of cells and performed as above. Poly(A) mRNA was isolated from total RNA with a mini-oligo (dT) cellulose spin column kit from 5 prime-3 prime Inc. (Boulder, CO). Poly(A) mRNA was used to prepare cDNA with the Superscript Choice System (GIBCO BRL) and biotinylated cRNA was synthesized with Biotin-11-CTP and the Megascript T7 Kit (Ambion). Biotinylated cRNA was fragmented by incubation at 94°C for 35 min in 40 mm Tris acetate (pH 8.1), 100 mm KOAc, and 30 mm MgOAc. Free unincorporated Biotin nucleotides were eliminated with the RNeasy Mini Kit (Qiagen). Biotinyated cRNA was hybridized to the gene chip arrays at 45°C overnight. Hybridization, washing, and streptavidin staining were performed in the Affymetrix Gene Chip fluidics station 400. Gene chips were scanned in a Hewlett-Packard G2500A Gene array scanner and expression data was analyzed with the Affymetrix Gene Chip analysis suite version 3.1.
Media and strains
Yeast media were prepared as described previously (Sherman 1991; Gimeno et al. 1992). Rapamycin and cycloheximide were added to the media from concentrated stock solutions in 90% ethanol/10% Tween 20 and water, respectively. Yeast transformations were performed by the lithium acetate method (Schiestl et al. 1993). Unless noted otherwise, mutant yeast strains were constructed by PCR-mediated gene disruptions with the G418-resistance gene cassette derived from template plasmid pFA6–kanMX2 as described (Table 3; Wach et al. 1994). MLY88α and MLY90-1 were generated as spontaneous resistant mutants of strain MLY40 on YPD medium containing 0.2 μg/ml rapamycin. The rapamycin-resistant mutation in strain MLY88α was complemented by the introduction of a plasmid bearing the wild-type FPR1 gene (pYJH23). Strain MLY90-1 was shown to harbor the TOR1-4 mutation by meiotic segregation of the rapamycin-resistance phenotype opposite a tor1::LEU2 deletion mutation following a genetic cross. MLY152 a/α was created by PCR mutagenesis of strain MLY40α and the presence of the Ser-1975–Ile mutation in the TOR2 gene confirmed by DNA sequencing. Strains MLY158α, MLY148α, and MLY146α were constructed by mating strain MLY140a with strains MLY152α, MLY90-1, and MLY88α, respectively, followed by sporulation and dissection of tetrads.
Table 3.
Strain list
| Strain
|
Genotype
|
Source
|
|---|---|---|
| MLY41 | Σ1278b MATa ura3-52 | Lorenz (1997) |
| MLY40 | Σ1278b MATα ura3-52 | Lorenz (1997) |
| MLY88 | Σ1278b MATα ura3-52 fpr1 | this study |
| MLY139a | Σ1278b MATa ura3-52 Δgln3::G418 | Lorenz (1998) |
| MLY140a | Σ1278b MATa ura3-52 Δure2::G418 | Lorenz (1998) |
| MLY54a | Σ1278b MATa ura3-52 Δleu2::hisG Δnpr1::LEU2 | Lorenz (1998) |
| MLY141a | Σ1278b MATa ura3-52 npil | Lorenz (1998) |
| MLY152α | Σ1278b MATα ura3-52 TOR2-1 (Ser-1975–Ile) | this study |
| MLY158α | Σ1278b MATα ura3-52 TOR2-1 Δure2::G418 | this study |
| MLY90-1 | Σ1278b MATα ura3-52 TOR1-4 | this study |
| MLY148α | Σ1278b MATα ura3-52 TOR1-4 Δure2::G418 | this study |
| MLY146α | Σ1278b MATα ura3-52 fpr1 Δure2::G418 | this study |
Protein extracts, alkaline phosphatase treatment, and Western analysis
Cells harvested and frozen as indicated above were resuspended in ice-cold lysis buffer (20 mm KPO4 at pH 7.2, 1 mm EDTA, 1 mm EGTA, 0.5% Triton X-100, 25 mm β-glycerophosphate, 25 mm NaF, 100 μm Na3VO4, 1 mm DTT, 1 mm PMSF, 1 mm benzamidine, 1% aprotinin, 1 μg/ml pepstatin, 100 μm leupeptin). Cells were lyzed at 4°C with glass beads by five strokes of 1 min each in a bead beater (Biospec) with cooling for 1 min between strokes. Following centrifugation, protein was quantitated by Bradford assay (Amersham) and 100 μg of protein extract was loaded onto SDS–polyacrylamide gels. Proteins were detected by Western blot analysis with rabbit polyclonal antisera against Ure2 (Wickner 1994) and ECL plus detection (Amersham). For alkaline phosphatase treatment, 100 μg of protein extract were adjusted to 2 mm MgCl2 and 4 units of alkaline phosphatase (Boehringer Mannheim) were added and samples incubated at 37°C for 30 min. Extracts were mixed with protein sample buffer boiled for 4 min and analyzed by Western blot as indicated above.
Acknowledgments
We thank Helena Abushamaa for assistance with genome array analysis, Xuewen Pan for advice on Northern blots, and Dr. Reed Wickner for his generous gift of Ure2 protein antiserum. M.E.C. dedicates this paper to Dr. Wilhelm Hansberg for early inspiration. This work was supported by KO1 award CA77075 from the National Cancer Institute (to M.E.C.) and RO1 award AI41937 from The National Institute of Allergy and Infectious Diseases (to J.H. and M.E.C.). J.H. is an associate investigator of the Howard Hughes Medical Institute.
The publication costs of this article were defrayed in part by payment of page charges. This article must therefore be hereby marked “advertisement” in accordance with 18 USC section 1734 solely to indicate this fact.
Footnotes
E-MAIL carde004@mc.duke.edu; FAX (919) 684-5458.
References
- Alarcon CM, Cardenas ME, Heitman J. Mammalian RAFT1 kinase domain provides rapamycin-sensitive TOR function in yeast. Genes & Dev. 1996;10:279–288. doi: 10.1101/gad.10.3.279. [DOI] [PubMed] [Google Scholar]
- Alarcon CM, Heitman J, Cardenas ME. Protein kinase activity and identification of a toxic effector domain of the target of rapamycin TOR proteins in yeast. Mol Biol Cell. 1999;10:2531–2546. doi: 10.1091/mbc.10.8.2531. [DOI] [PMC free article] [PubMed] [Google Scholar]
- Barbet NC, Schneider U, Helliwell SB, Stansfield I, Tuite MF, Hall MN. TOR controls translation initiation and early G1 progression in yeast. Mol Biol Cell. 1996;7:25–42. doi: 10.1091/mbc.7.1.25. [DOI] [PMC free article] [PubMed] [Google Scholar]
- Berset C, Trachsel H, Altmann M. The TOR (target of rapamycin) signal transduction pathway regulates the stability of translation initiation factor eIF4G in the yeast Saccharomyces cerevisiae. Proc Natl Acad Sci. 1998;95:4264–4269. doi: 10.1073/pnas.95.8.4264. [DOI] [PMC free article] [PubMed] [Google Scholar]
- Blinder D, Coschigano PW, Magasanik B. Interaction of the GATA factor Gln3p with the nitrogen regulator Ure2p in Saccharomyces cerevisiae. J Bacteriol. 1996;178:4734–4736. doi: 10.1128/jb.178.15.4734-4736.1996. [DOI] [PMC free article] [PubMed] [Google Scholar]
- Brown EJ, Albers MW, Shin TB, Ichikawa K, Keith CT, Lane WS, Schreiber SL. A mammalian protein targeted by G1-arresting rapamycin-receptor complex. Nature. 1994;369:756–759. doi: 10.1038/369756a0. [DOI] [PubMed] [Google Scholar]
- Brown EJ, Beal PA, Keith CT, Chen J, Shin TB, Schreiber SL. Control of p70 S6 kinase by kinase activity of FRAP in vivo. Nature. 1995;377:441–446. doi: 10.1038/377441a0. [DOI] [PubMed] [Google Scholar]
- Brunn GJ, Hudson CC, Sekulic A, Williams JM, Hosoi J, Houghton PJ, Lawrence J JC, Abraham RT. Phosphorylation of the translational repressor PHAS-I by the mammalian target of rapamycin. Science. 1997;277:99–101. doi: 10.1126/science.277.5322.99. [DOI] [PubMed] [Google Scholar]
- Burnett PE, Barrow RK, Cohen NA, Snyder SH, Sabatini DM. RAFT1 phosphorylation of the translational regulators p70 S6 kinase and 4E-BP1. Proc Natl Acad Sci. 1998;95:1432–1437. doi: 10.1073/pnas.95.4.1432. [DOI] [PMC free article] [PubMed] [Google Scholar]
- Cafferkey R, Young PR, McLaughlin MM, Bergsma DJ, Koltin Y, Sathe GM, Faucette L, Eng W-K, Johnson RK, Livi GP. Dominant missense mutations in a novel yeast protein related to mammalian phosphatidylinositol 3-kinase and VPS34 abrogate rapamycin cytotoxicity. Mol Cell Biol. 1993;13:6012–6023. doi: 10.1128/mcb.13.10.6012. [DOI] [PMC free article] [PubMed] [Google Scholar]
- Cardenas ME, Heitman J. FKBP12-rapamycin target TOR2 is a vacuolar protein with an associated phosphatidylinositol-4 kinase activity. EMBO J. 1995;14:5892–5907. doi: 10.1002/j.1460-2075.1995.tb00277.x. [DOI] [PMC free article] [PubMed] [Google Scholar]
- Cardenas ME, Sanfridson A, Cutler NS, Heitman J. Signal-transduction cascades as targets for therapeutic intervention by natural products. Trends Biotechnal. 1998;16:427–433. doi: 10.1016/s0167-7799(98)01239-6. [DOI] [PubMed] [Google Scholar]
- Chen J, Peterson RT, Schreiber SL. Alpha 4 associates with protein phosphatases 2A, 4, and 6. Biochem Biophys Res Commun. 1998;247:827–832. doi: 10.1006/bbrc.1998.8792. [DOI] [PubMed] [Google Scholar]
- Coschigano PW, Magasanik B. The URE2 gene product of Saccharomyces cerevisiae plays an important role in the cellular response to the nitrogen source and has homology to gluthathione S-transferases. Mol Cell Biol. 1991;11:822–832. doi: 10.1128/mcb.11.2.822. [DOI] [PMC free article] [PubMed] [Google Scholar]
- Courchesne WE, Magasanik B. Regulation of nitrogen assimilation in Saccharomyces cerevisiae: Roles of the URE2 and GLN3 genes. J Bacteriol. 1988;170:708–713. doi: 10.1128/jb.170.2.708-713.1988. [DOI] [PMC free article] [PubMed] [Google Scholar]
- Cutler NS, Heitman J, Cardenas ME. TOR functions in a conserved signal transduction pathway that senses nutrient levels and growth factors and regulates protein synthesis and degradation. Mol Cell Endocrinol. 1999;155:135–142. doi: 10.1016/s0303-7207(99)00121-5. [DOI] [PubMed] [Google Scholar]
- Di Como CJ, Arndt KT. Nutrients, via the Tor proteins, stimulate the association of Tap42 with type 2A phosphatases. Genes & Dev. 1996;10:1904–1916. doi: 10.1101/gad.10.15.1904. [DOI] [PubMed] [Google Scholar]
- Dilling MB, Dias P, Shapiro DN, Germain GS, Johnson RK, Houghton PJ. Rapamycin selectively inhibits the growth of childhood rhabdomyosarcoma cells through inhibition of signaling via the type I insulin-like growth factor receptor. Cancer Res. 1994;54:903–907. [PubMed] [Google Scholar]
- Fox HL, Pham PT, Kimball SR, Jefferson LS, Lynch CJ. Amino acid effects on translational repressor 4E-BP1 are mediated primarily by L-leucine in isolated adipocytes. Am J Physiol. 1998;275:C1232–C1238. doi: 10.1152/ajpcell.1998.275.5.C1232. [DOI] [PubMed] [Google Scholar]
- Gimeno CJ, Ljungdahl PO, Styles CA, Fink GR. Unipolar cell divisions in the yeast S. cerevisiae lead to filamentous growth: Regulation by starvation and RAS. Cell. 1992;68:1077–1090. doi: 10.1016/0092-8674(92)90079-r. [DOI] [PubMed] [Google Scholar]
- Graves LM, Bornfeldt KE, Argast GM, Krebs EG, Kong X, Lin TA, John J, Lawrence C. cAMP- and rapamycin-sensitive regulation of the association of eukaryotic initiation factor 4E and the translational regulator PHAS-I in aortic smooth muscle cells. Proc Natl Acad Sci. 1995;92:7222–7226. doi: 10.1073/pnas.92.16.7222. [DOI] [PMC free article] [PubMed] [Google Scholar]
- Hara K, Yonezawa K, Weng Q-P, Kozlowski MT, Belham C, Avruch J. Amino acid sufficiency and mTOR regulate p70 S6 kinase and eIF-4E BP1 through a common effector mechanism. J Biol Chem. 1998;273:14484–14494. doi: 10.1074/jbc.273.23.14484. [DOI] [PubMed] [Google Scholar]
- Heitman J, Movva NR, Hall MN. Targets for cell cycle arrest by the immunosuppressant rapamycin in yeast. Science. 1991;253:905–909. doi: 10.1126/science.1715094. [DOI] [PubMed] [Google Scholar]
- Helliwell SB, Wagner P, Kunz J, Deuter-Reinhard M, Henriquez R, Hall MN. TOR1 and TOR2 are structurally and functionally similar but not identical phosphatidylinositol kinase homologues in yeast. Mol Biol Cell. 1994;5:105–118. doi: 10.1091/mbc.5.1.105. [DOI] [PMC free article] [PubMed] [Google Scholar]
- Hosoi H, Dilling MB, Shikata T, Liu LN, Shu L, Ashmun RA, Germain GS, Abraham RT, Houghton PJ. Rapamycin causes poorly reversible inhibition of mTOR and induces p53-independent apoptosis in human rhabdomyosarcoma cells. Cancer Res. 1999;59:886–894. [PubMed] [Google Scholar]
- Iiboshi Y, Papst PJ, Hunger SP, Terada N. L-Asparaginase inhibits the rapamycin-targeted signaling pathway. Biochem Biophys Res Commun. 1999a;260:534–539. doi: 10.1006/bbrc.1999.0920. [DOI] [PubMed] [Google Scholar]
- Iiboshi Y, Papst PJ, Kawasome H, Hosoi J, Abraham RT, Houghton PJ, Terada N. Amino acid-dependent control of p70s6k. Involvement of tRNA aminoacylation in the regulation. J Biol Chem. 1999b;274:1092–1099. doi: 10.1074/jbc.274.2.1092. [DOI] [PubMed] [Google Scholar]
- Inui S, Sanjo H, Maeda K, Yamamoto H, Miyamoto E, Sakaguchi N. Ig receptor binding protein 1 (alpha4) is associated with a rapamycin-sensitive signal transduction in lymphocytes through direct binding to the catalytic subunit of protein phosphatase 2A. Blood. 1998;92:539–546. [PubMed] [Google Scholar]
- Jiang Y, Broach JR. Tor proteins and protein phosphatase 2A reciprocally regulate Tap42 in controlling cell growth in yeast. EMBO J. 1999;18:2782–2792. doi: 10.1093/emboj/18.10.2782. [DOI] [PMC free article] [PubMed] [Google Scholar]
- Kimball SR, Shantz LM, Horetsky RL, Jefferson LS. Leucine regulates translation of specific mRNAs in L6 myoblasts through mTOR-mediated changes in availability of eIF4E and phosphorylation of ribosomal protein S6. J Biol Chem. 1999;274:11647–11652. doi: 10.1074/jbc.274.17.11647. [DOI] [PubMed] [Google Scholar]
- Kunz J, Henriquez R, Schneider U, Deuter-Reinhard M, Movva NR, Hall MN. Target of rapamycin in yeast, TOR2, is an essential phosphatidylinositol kinase homolog required for G1 progression. Cell. 1993;73:585–596. doi: 10.1016/0092-8674(93)90144-f. [DOI] [PubMed] [Google Scholar]
- Kuo CJ, Chung J, Fiorentino DF, Flanagan WM, Blenis J, Crabtree GR. Rapamycin selectively inhibits interleukin-2 activation of p70 S6 kinase. Nature. 1992;358:70–73. doi: 10.1038/358070a0. [DOI] [PubMed] [Google Scholar]
- Lawrence JC, Jr, Abraham RT. PHAS/4E-BPs as regulators of mRNA translation and cell proliferation. Trends Biochem Sci. 1997;22:345–349. doi: 10.1016/s0968-0004(97)01101-8. [DOI] [PubMed] [Google Scholar]
- Lin TA, Kong X, Saltiel AR, Blackshear PJ, Lawrence JC. Control of PHAS-I by insulin in 3T3-L1 adipocytes. Synthesis, degradation, and phosphorylation by a rapamycin-sensitive and mitogen-activated protein kinase-independent pathway. J Biol Chem. 1995;270:18531–18538. doi: 10.1074/jbc.270.31.18531. [DOI] [PubMed] [Google Scholar]
- Lorenz MC, Heitman J. Yeast pseudohyphal growth is regulated by GPA2, a G protein alpha homolog. EMBO J. 1997;16:7008–7018. doi: 10.1093/emboj/16.23.7008. [DOI] [PMC free article] [PubMed] [Google Scholar]
- ———. 1998. The MEP2 ammonium permease regulates pseudohyphal differentiation in Saccharomyces cerevisiae.17: 1236–1247. [DOI] [PMC free article] [PubMed]
- Louro ID, McKie-Bell P, Gosnell H, Brindley BC, Bucy RP, Ruppert JM. The zinc finger protein GLI induces cellular sensitivity to the mTOR inhibitor rapamycin. Cell Growth Differ. 1999;10:503–516. [PubMed] [Google Scholar]
- Magasanik B. Regulation of nitrogen utilization. In: Jones EW, Pringle JR, Broach JR, editors. The molecular and cellular biology of the yeast Saccharomyces Gene expression. Vol. 2. Cold Spring Harbor, NY: Cold Spring Harbor Press; 1992. pp. 283–317. [Google Scholar]
- Minehart PL, Magasanik B. Sequence and expression of GLN3, a positive nitrogen regulatory gene of Saccharomyces cerevisiae encoding a protein with a putative zinc finger DNA-binding domain. Mol Cell Biol. 1991;11:6216–6228. doi: 10.1128/mcb.11.12.6216. [DOI] [PMC free article] [PubMed] [Google Scholar]
- Mitchell AP, Magasanik B. Purification and properties of glutamine synthetase from Saccharomyces cerevisiae. J Biol Chem. 1983;258:119–124. [PubMed] [Google Scholar]
- ————— Regulation of glutamine-repressible gene products by the GLN3 function in Saccharomyces cerevisiae. Mol Cell Biol. 1984;4:2758–2766. doi: 10.1128/mcb.4.12.2758. [DOI] [PMC free article] [PubMed] [Google Scholar]
- Murata K, Wu J, Brautigan DL. B cell receptor-associated protein alpha4 displays rapamycin-sensitive binding directly to the catalytic subunit of protein phosphatase 2A. Proc Natl Acad Sci. 1997;94:10624–10629. doi: 10.1073/pnas.94.20.10624. [DOI] [PMC free article] [PubMed] [Google Scholar]
- Noda T, Ohsumi Y. Tor, a phosphatidylinositol kinase homologue, controls autophagy in yeast. J Biol Chem. 1998;273:3963–3966. doi: 10.1074/jbc.273.7.3963. [DOI] [PubMed] [Google Scholar]
- Powers T, Walter P. Regulation of ribosome biogenesis by the rapamycin-sensitive TOR-signaling pathway in Saccharomyces cerevisiae. Mol Biol Cell. 1999;10:987–1000. doi: 10.1091/mbc.10.4.987. [DOI] [PMC free article] [PubMed] [Google Scholar]
- Price DJ, Grove JR, Calvo V, Avruch J, Bierer BE. Rapamycin-induced inhibition of the 70-kilodalton S6 protein kinase. Science. 1992;257:973–977. doi: 10.1126/science.1380182. [DOI] [PubMed] [Google Scholar]
- Sabatini DM, Erdjument-Bromage H, Lui M, Tempst P, Snyder SH. RAFT1: A mammalian protein that binds to FKBP12 in a rapamycin-dependent fashion and is homologous to yeast TORs. Cell. 1994;78:35–43. doi: 10.1016/0092-8674(94)90570-3. [DOI] [PubMed] [Google Scholar]
- Sabers CJ, Martin MM, Brunn GJ, Williams JM, Dumont FJ, Wiederrecht G, Abraham RT. Isolation of a protein target of the FKBP12-rapamycin complex in mammalian cells. J Biol Chem. 1995;270:815–822. doi: 10.1074/jbc.270.2.815. [DOI] [PubMed] [Google Scholar]
- Schiestl RH, Manivasakam P, Woods RA, Gietz RD. Introducing DNA into yeast by transformation. Methods. 1993;5:79–85. [Google Scholar]
- Schmidt A, Beck T, Koller A, Kunz J, Hall MN. The TOR nutrient signalling pathway phosphorylates NPR1 and inhibits turnover of the tryptophan permease. EMBO J. 1998;17:6924–6931. doi: 10.1093/emboj/17.23.6924. [DOI] [PMC free article] [PubMed] [Google Scholar]
- Sherman F. Getting started with yeast. Methods Enzymol. 1991;194:3–21. doi: 10.1016/0076-6879(91)94004-v. [DOI] [PubMed] [Google Scholar]
- Shi Y, Frankel A, Radvanyi LG, Penn LZ, Miller RG, Mills GB. Rapamycin enhances apoptosis and increases sensitivity to cisplatin in vitro. Cancer Res. 1995;55:1982–1988. [PubMed] [Google Scholar]
- Shigemitsu K, Tsujishita Y, Hara K, Nanahoshi M, Avruch J, Yonezawa K. Regulation of translational effectors by amino acid and mammalian target of rapamycin signaling pathways. Possible involvement of autophagy in cultured hepatoma cells. J Biol Chem. 1999;274:1058–1065. doi: 10.1074/jbc.274.2.1058. [DOI] [PubMed] [Google Scholar]
- Stanbrough M, Rowen DW, Magasanik B. Role of the GATA factors Gln3p and Nil1p of Saccharomyces cerevisiae in the expression of nitrogen-regulated genes. Proc Natl Acad Sci. 1995;92:9450–9454. doi: 10.1073/pnas.92.21.9450. [DOI] [PMC free article] [PubMed] [Google Scholar]
- Thomas G, Hall MN. TOR signalling and control of cell growth. Curr Opin Cell Biol. 1997;9:782–787. doi: 10.1016/s0955-0674(97)80078-6. [DOI] [PubMed] [Google Scholar]
- von Manteuffel SR, Gingras A-C, Ming X-F, Sonenburg N, Thomas G. 4E-BP1 phosphorylation is mediated by the FRAP-p70s6k pathway and is independent of mitogen-activated protein kinase. Proc Natl Acad Sci. 1996;93:4076–4080. doi: 10.1073/pnas.93.9.4076. [DOI] [PMC free article] [PubMed] [Google Scholar]
- Wach A, Brachat A, Pohlmann R, Philippsen P. New heterologous modules for classical or PCR- based gene disruptions in Saccharomyces cerevisiae. Yeast. 1994;10:1793–1808. doi: 10.1002/yea.320101310. [DOI] [PubMed] [Google Scholar]
- Weisman R, Choder M, Koltin Y. Rapamycin specifically interferes with the developmental response of fission yeast to starvation. J Bacteriol. 1997;179:6325–6334. doi: 10.1128/jb.179.20.6325-6334.1997. [DOI] [PMC free article] [PubMed] [Google Scholar]
- Wickner RB. [URE3] as an altered URE2 protein: Evidence for a prion analog in Saccharomyces cerevisiae. Science. 1994;264:566–569. doi: 10.1126/science.7909170. [DOI] [PubMed] [Google Scholar]
- Xu G, Kwon G, Marshall CA, Lin T, Lawrence J JC, McDaniel ML. Branched-chain amino acids are essential in the regulation of PHAS-I and p70 S6 kinase by pancreatic β-cells. J Biol Chem. 1998;273:28178–28184. doi: 10.1074/jbc.273.43.28178. [DOI] [PubMed] [Google Scholar]
- Xu S, Falvey DA, Brandriss MC. Roles of URE2 and GLN3 in the proline utilization pathway in Saccharomyces cerevisiae. Mol Cell Biol. 1995;15:2321–2330. doi: 10.1128/mcb.15.4.2321. [DOI] [PMC free article] [PubMed] [Google Scholar]
- Zaragoza D, Ghavidel A, Heitman J, Schultz MC. Rapamycin induces the G0 program of transcriptional repression in yeast by interfering with the TOR signaling pathway. Mol Cell Biol. 1998;18:4463–4470. doi: 10.1128/mcb.18.8.4463. [DOI] [PMC free article] [PubMed] [Google Scholar]
- Zheng XF, Schreiber SL. Target of rapamycin proteins and their kinase activities are required for meiosis. Proc Natl Acad Sci. 1997;94:3070–3075. doi: 10.1073/pnas.94.7.3070. [DOI] [PMC free article] [PubMed] [Google Scholar]
- Zheng X-F, Fiorentino D, Chen J, Crabtree GR, Schreiber SL. TOR kinase domains are required for two distinct functions, only one of which is inhibited by rapamycin. Cell. 1995;82:121–130. doi: 10.1016/0092-8674(95)90058-6. [DOI] [PubMed] [Google Scholar]