

Abstract
Immune escape is an important reason why the immune system cannot control tumor growth, but how escape variants emerge during immunotherapy remains poorly understood. Here, we identify a new mechanism of tumor immune escape using an in vivo selection strategy. We generated a highly immune-resistant cancer cell line (P3) by subjecting a susceptible cancer cell line (P0/TC-1) to multiple rounds of in vivo immune selection. Microarray analysis of P0 and P3 revealed that vascular cell adhesion molecule-1 (VCAM-1) is up-regulated in the P3-resistant variant. Retroviral transfer of VCAM-1 into P0 significantly increased its resistance against a vaccine-induced immune response. Analysis of tumors showed a dramatic decrease in the number of tumor-infiltrating cluster of differentiation 8+ (CD8+) T cells in the tumors expressing VCAM-1. In vitro transwell migration assays showed that VCAM-1 can promote the migration of CD8+ T cells through its interaction with the α4β1 integrin. Site-directed mutagenesis of VCAM-1 at amino acid residues required for interaction with α4β1 integrin completely abolished the immune resistance conferred by VCAM-1 in vivo. Surface staining showed that most renal cell carcinomas (RCC) express VCAM-1, whereas an RCC that responded to vaccination was VCAM-1 negative. These data provide evidence that tumor expression of VCAM-1 represents a new mechanism of immune evasion and has important implications for the development of immunotherapy for human RCC.
Introduction
The ultimate goal of cancer immunology is to harness the power and specificity of the immune system to prevent or control tumor growth. Toward this end, significant progress has been made in identifying tumor antigens and devising several approaches to boosting the immune response against these antigens (1, 2). Despite the success in generating antitumor immune responses, tumor-specific T cells generated frequently fail to induce tumor regression in cancer patients receiving experimental immunotherapy (3). One likely explanation for why immunotherapy fails is that the antitumor immune response generated might not be sufficiently powerful or long lasting. Another important reason is that tumors, with their abnormal patterns of gene expression and prolonged, insidious growth, can influence and impair the immune system in many ways. Understanding the molecular abnormalities that allow tumors to escape immune attack thus represents an important objective in the field of cancer immunology.
Tumor escape from immune surveillance and attack has been studied for many years (4, 5). These studies have identified many distinct mechanisms. Loss of MHC and other components of the antigen presentation machinery has been found in many cancers (6, 7). Immunosuppressive factors such as transforming growth factor-β, interleukin-10, and vascular endothelial growth factor have also been found in different cancers (8–10). Tumor-associated tolerance and abnormal expansion of regulatory T cells can also lead to immunosuppression (11–14). In addition, the tumor microenvironment has been shown to be an impediment to anti-tumor immune responses (15). More recently, tumor expressions of B7-H1, indoleamine 2,3-dioxygenase enzyme, and galectin-1, as well as shedding of MIC-A and MIC-B, have been shown to affect proliferation, survival, or functioning of effector T cells (16–19). Together, these studies have laid the foundation for understanding how tumors escape immune attack and how tumors interact with the immune system in general. They also show that tumor escape is a complex phenomenon involving multiple pathways.
In contrast to our growing understanding of tumor escape in natural, unmanipulated hosts, a related question, how immune resistance of tumors emerges in the face of immunotherapy, has not been systematically explored. To tackle this question, we generated a mouse model of tumor escape, consisting of a susceptible cancer cell line (P0) and a highly resistant variant (P3). We have used microarray analysis to identify the potential mechanism(s) used by the P3-resistant variant to escape immune control. These analyses revealed the ectopic expression of vascular cell adhesion molecule-1 (VCAM-1) as a novel mechanism of escape from T cell–mediated antitumor immunity. Thus, this approach can help uncover additional tumor escape mechanisms and better our understanding of the complex interactions between tumors and the immune system.
Materials and Methods
Cell culture and antibodies
All cancer cell lines were cultured in RPMI 1640 containing 2 mmol/L L-glutamine, 1 mmol/L sodium pyruvate, nonessential amino acid, 100 IU penicillin/streptomycin and 10% fetal bovine serum in a 37°C incubator with 5% CO2. Antimouse VCAM-1 antibody (clone 429) and isotype control (clone R35–95; PharMingen, San Diego, CA) were used for surface staining in most experiments. For staining of VCAM-1 mutants, another antimouse VCAM-1 antibody (clone 112702; R&D Systems, Minneapolis, MN) was used. Antihuman VCAM-1 antibody (clone 51-10C9) and isotype control (clone MOPC-21) were purchased from PharMingen. For integrin staining, anti-β1 antibody (clone Ha2/5), anti-β2 antibody (clone C71/16), anti-β7 antibody (clone M293), and anti-α4 antibody (clone R1–2) were also purchased from PharMingen. The staining of the various antibodies was done according to the vendor’s manual.
RNA sample preparation and microarray analysis
Total RNA was extracted from P0 and P3 cell lines cultured in 10-cm dishes using TRIzol (Invitrogen, Carlsbad, CA) and followed by a cleanup step using RNeasy Mini Kit (Qiagen, Valencia, CA). The RNA was processed at Johns Hopkins Microarray Core Facility for hybridization with Affymetrix GeneChip Mouse Genome 430 2.0 Array. The resulting data were normalized and analyzed, and the data were submitted to the Gene Expression Omnibus database of the National Center for Biotechnology Information (NCBI; accession number GSE2774).
Method of microarray data analysis
The RNA samples were analyzed with Affymetrix GeneChip Mouse Genome 430 2.0 arrays. To estimate the gene expression signals, image analysis was done for the CEL files of the chips using the statistical technique and package guanine-cytosine content–robust multiarray analysis (20). The image processing includes a quantile normalization procedure to reduce the obscuring variations between gene chips, which might be introduced during the processes of sample preparation, manufacturing, fluorescence labeling, hybridization, or scanning (21). The normalized signal intensities were analyzed using parametric empirical Bayes method to estimate the posterior probabilities of differential expression of genes between P0 and P3 cell lines (22, 23). The criterion of the posterior probability, >0.5, which means the posterior probability is larger than random chance, was used to obtain a list of differentially expressed genes. Fold changes of the differentially expressed genes were calculated using geometric means of the signal intensities of P0 and P3 cell lines, which have been shown to perform better than the arithmetic means of the expression signals in terms of identifying differentially expressed genes.
Semiquantitative and quantitative real-time reverse transcription-PCR
Semiquantitative reverse transcription (RT)-PCR was done using Superscript One-Step RT-PCR system (Invitrogen). Primers for cloning mouse VCAM-1 were used (see below). The sequence for glyceraldehyde-3-phosphate dehydrogenase (GAPDH) primers are GAPDH(F) (atggtgaaggtcggtgtgaacggatttggc) and GAPDH(R) (catcgaaggtggaagagtgggagttgctgt). For quantitative measurement of VCAM-1 transcript, real-time RT-PCR was done using TaqMan One-Step RT-PCR Master Mix Reagents Kit and an ABI Prism 7700 Sequence Detection System (Applied Biosystems, Foster City, CA). The primers are 5-VCAM-1(94) (gaatacaaaacgattgctcaaatcg); 3-VCAM-1(219) (cgtcctcaccttcgcgttta); and TaqMan probe (6FAM-ccatggccctcacttgcagcact-TAMRA; Applied Biosystems). All primers were designed using Primer Express 1.0 (Applied Biosystems). For endogenous control, eukaryotic 18S rRNA (VIC/TAMRA probe) was used (Applied Biosystems). The relative standard curve method was used to calculate the level of gene expression for VCAM-1 transcript.
Retroviral transfer
Full-length isoform of mouse VCAM-1 cDNA was amplified from total RNA of P3 cell line using Superscript One-Step RT-PCR system (Invitrogen) and 5Xho1-VCAM-1 primer (gaactcgagatgcctgtgaagatggtcgcg) and 3EcoR1-VCAM-1 primer (ggggaattcctacactttggatttctgtgc). The resulting fragment was cloned into a pMSCVpuro retroviral vector (Clontech, Mountain View, CA) and verified by sequencing. The construct was transfected into Phoenix packaging cell line, and the virion-containing supernatant was collected 48 h after transfection. The supernatant was immediately clarified using a 0.45-μm cellulose acetate syringe filter (Nalgene, Rochester, NY) and used to infect target cells (P0) in the presence of 8 μg/mL Polybrene (Sigma, St. Louis, MO). One day after retroviral transduction, the virus supernatant was replaced with normal culture medium, and when the cells reached 70% confluency, puromycin (7.5 μg/mL) was used to select for cells with integrated pMSCV-VCAM-1. Gene expression level of VCAM-1 was verified by staining the cells with anti-VCAM-1 antibody (PharMingen) and analyzing by flow cytometry.
Site-directed mutagenesis of VCAM-1
Substitution mutants of VCAM-1 were generated by amplifying VCAM-1 cDNA in two fragments, a 5′ fragment and a 3′ fragment, which share an overlapping region of 43 bp and include the aspartate residue to be substituted with alanine. For VCAM-1-D40A, the 5′ fragment was amplified with 5Xho1-VCAM-1 primer (see above) and R-VCAM-1-D40A (accttcgcgtttagtgggctagctatctgggttctccatgaga), and the 3′ fragment was amplified with 3EcoR1-VCAM-1 primer (see above) and F-VCAM-1-D40A (tctcatggagaa cccagatagctagcccactaaacgcgaaggt). The 5′ and 3′ fragments are mixed and used as the template for PCR and amplified again using 5Xho1-VCAM-1 primer and 3EcoR1-VCAM-1 primer. The resulting fragment was then cloned into pMSCVpuro. VCAM-1-D328A mutant cDNA was generated in the same way. To generate the 5′ and 3′ fragments, the following primers are used: F-VCAM-1-D328A (tttcttggagaacccagacagctagccccctcaatggggtggtaag) and R-VCAM-1-D328A (cttaccaccccattgagggggctagctgtctgggttctccaagaaa). The resulting mutant VCAM-1 cDNA was verified by sequencing.
In vivo tumor growth experiments
C57BL/6 mice (6–8 weeks old) were purchased from the National Cancer Institute (Federick, MD). For the mouse experiments, five C57BL/6 mice per group are used unless stated otherwise. To induce anti-E7–specific immune response, mice are vaccinated with vaccinia virus Sig/E7/LAMP-1 at 1 × 10⁷ plaque-forming unit (pfu) per mouse. One week after the vaccination, mice are s.c. challenged with 1 × 10⁵ tumor cells per mouse in the right hind leg. Mice are monitored for tumor growth by palpation and inspection twice a week until they were sacrificed. Sizes of the tumors were determined by explanting the tumors from mice 28 to 30 days after tumor cell injection and measuring the weight using a scale. Immunodeficient RAG1 knock-out mice (B6.129S7-Rag1tm1Mom) were purchased from the Jackson Laboratory (Bar Harbor, ME).
Apoptotic assays
Terminal nucleotidyl transferase–mediated nick end labeling (TUNEL) assay was done on frozen sections of P0-NoInsert and P0-VCAM-1 tumors using In Situ Cell Death Detection Kit, AP (Roche, Indianapolis, IN). Tumors were isolated from mice 10 days after inoculation and snap-frozen in Tissue-Tek O.C.T. compound immediately (Sakura Finetek, Torrence, CA). Tissue sectioning was done by the Reference Histology Laboratory of Johns Hopkins Medical Laboratories. The assay was done according to the manufacturer’s instruction. DNA fragmentation was detected by the incorporation of fluorescein-linked nucleotide and subsequent binding with an anti-fluorescein antibody conjugated to alkaline phosphatase. TUNEL-positive cells were visualized by incubation of the substrate nitroblue tetrazolium/5-bromo-4-chloro-3-indolyl phosphate (Sigma), followed by counterstaining with Nuclear Fast Red (Vector Laboratories, Burlingame, CA).
Preparation of single cell suspensions from tumors for analysis of infiltrating CD8+, CD4+ T cells and natural killer cells
The P0-NoInsert, P0-VCAM-1, P0-VCAM-1/D40A, and P0-VCAM-1/D328A tumors were isolated from C57 BL/6 mice ( five per group) between days 7 and 11, and single cell suspensions were prepared using one of the following two methods. In the first, more rapid method, single cell suspensions were prepared by first immersing the tumors in PBS buffer and mashing the tumors against cell strainers using syringe plungers. Cells that passed through the cell strainers were collected, washed with fluorescence-activated cell sorting (FACS) buffer and used for FACS staining. Alternatively, in the slower, more gentle method, tumors were isolated from mice and immersed in 1× HBSS containing collagenase I (0.05 mg/mL), collagenase IV (0.05 mg/mL), and hyaluronidase (0.025 mg/mL; Sigma). The tumors were minced into very small pieces with surgical blades and incubated with the enzymes in a 37°C incubator with 5% CO2 for 15 min. After 15 min, an additional 1× HBSS with the enzymes was added, and the tumors were minced and incubated again. After the second incubation, the single cell suspension was filtered through cell strainers, washed with FACS buffer, and used for FACS staining.
In vitro migration assay
A modified Boyden chamber assay was used to study the migration of freshly isolated tumor-infiltrating cluster of differentiation 8+ (CD8+) T cells as previously described. Transwell polycarbonate membranes with 3-μm pores (Costar, Corning, Acton, MA) were coated with recombinant VCAM-1-Fc or human immunoglobulin G1 (IgG1)-Fc (R&D Systems) in PBS overnight at 4°C, followed by blocking with PBS containing 2% bovine serum albumin for 30 min at room temperature. Isolated CD8+ T cells (5 × 10⁴ cells per well) were resuspended in T cell medium and placed in the upper chamber, which is the same chamber coated with VCAM-1-Fc or human IgG1-Fc. About 600 μL of T cell medium containing 25 ng/mL SDF-1a (R&D Systems) was placed in the lower chamber. After 4 h of incubation, cells in the lower chamber were collected and counted using a flow cytometer.
Generation of luciferase-expressing E7-specific CD8+ T cells
An E7-specific CD8+ T cell line has been previously described (24). To generate a luciferase-expressing E7-specific CD8+ T cell line, we first created a retrovirus containing luciferase (pLucithy1.1 construct), which expressed both luciferase and thy1.1. Firefly luciferase was amplified by PCR from pGL3-basic (Promega, Madison, WI) using the 5′ primer CGGAGATCTATG-GAAGACGCCAAAAAC and the 3′ primer CGGGTTAACTTACACGGC-GATCTTTCC. The amplified luciferase cDNA was inserted into the BglII and HpaI sites of the bicistronic vector pMIG-thy1.1. Both luciferase and thy1.1 cDNA are under the control of a single promoter element and separated by an internal ribosomal entry site. The pLucithy1.1 was transfected into a Phoenix packaging cell line, and the virion-containing supernatant was collected 48 h after transfection. The E7-specific CD8+ T cells expressing luciferase were isolated using preparative flow cytometry of stained cells with Thy1.1 antibody (BD, Franklin Lakes, NJ).
In vivo bioluminescence imaging
Each C57BL/6 mouse ( five per group) was s.c. challenged with P0-VCAM-1 tumor cells at a dose of 5 × 10⁵ per mouse in the right hind leg and with either P0 tumor cells or P0-VCAM-1 D40A tumor cells at a dose of 5 × 10⁵ per mouse in the left hind leg. Tumor growth was monitored by visual inspection and palpation for a week. One week later, tumor-bearing mice were injected with luciferase-expressing E7-specific CD8+ T cells (5 × 10⁶ per mouse) by tail vein. The intensity of luminescence in the T cell–challenged mice was monitored on days 0, 1, 3, and 7 after transfer of the T cells. Tumor-bearing mice, which did not receive challenge with E7-specific CD8+ T cells, were used as a negative control. To monitor the intensity of luminescence, the mice were injected with 0.2 mL of 15 mg/mL beetle luciferin (potassium salt; Promega). After 10 min, the mice were imaged using the IVIS 200 system (Xenogen Corp., Alameda, CA). An integration time of 5 min was used for luminescence image acquisition.
Statistical analysis
All data expressed as means ± SE are representative of at least two different experiments. Data for intracellular cytokine staining with flow cytometry analysis and tumor treatment experiments were evaluated by ANOVA. Comparisons between individual data points were made using the Student’s t test. In the in vivo tumor growth experiment, the principal outcome of interest was time to tumor development. The event time distributions for different mice were compared using the method of Kaplan and Meier and the log-rank statistic. P < 0.05 was considered significant.
Results
Development of an in vivo model of tumor escape from immune attack
To study tumor evasion from immunotherapy and uncover novel tumor escape mechanisms, we generated a highly immune-resistant cancer cell line from a susceptible cancer cell line using an in vivo selection strategy. We have previously developed the TC-1/P0 cancer cell line as a mouse model of human papillomavirus (HPV)-associated cervical cancer by transducing murine lung epithelial cells with the HPV-16 E6 and E7 oncogenes (25). To control the growth of TC-1/P0 in vivo, we used a vaccinia virus termed Sig/E7/LAMP-1, which encodes a fusion protein consisting of an endoplasmic reticulum signal sequence, HPV-16 E7, and the transmembrane and cytoplasmic domains of lysosome-associated membrane protein-1 (LAMP-1; ref. 26). The signal peptide and LAMP-1 sorting sequence deliver the fusion protein into lysosomal compartments, a key component of MHC class II antigen-processing pathway. This results in a substantial increase in both E7-specific CD8+ and CD4+ T cell immune responses in mice injected with vaccinia Sig/E7/LAMP-1. We have observed that the immune response generated by Sig/E7/LAMP-1 can prevent the growth of TC-1/P0 in 60% to 80% of immunized mice (25).
We took advantage of this observation and explanted an outgrowth tumor from an immunized mouse and expanded it in vitro. This escape variant cell line was designated P1 and injected into a new group of mice immunized with vaccinia Sig/E7/LAMP-1. Again, one of the outgrowth tumors from immunized mice was explanted and expanded in vitro. This cell line was designated P2. These repeated injections with tumor cell lines allowed us to carry out in vivo immune selection and resulted in increasingly aggressive immunization-resistant cell lines (Fig. 1A). After three rounds of selection, we obtained P3, which was completely resistant to the vaccinia-induced immune response. We compared the growth kinetics of P0 and P3 in naïve mice and found that both cell lines grew with similar kinetics (Fig. 1B). However, when these cell lines were injected into mice immunized with vaccinia Sig/E7/LAMP-1, P3 was able to develop into a palpable mass in all of the mice within 7 days, whereas P0 only developed in two out of five mice after several weeks (Fig. 1C). P0 and P3 cell lines therefore represent a useful in vivo model for identifying genes that can contribute to tumor escape from immune attack.
Figure 1.
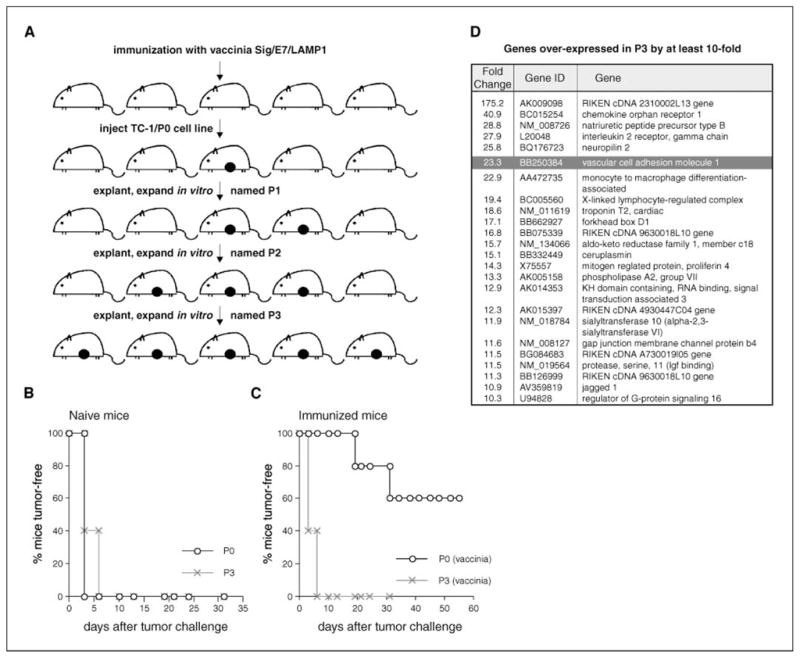
VCAM-1 is up-regulated in immune escape variant P3. A, a schematic diagram showing how a highly resistant escape variant P3 was generated from TC-1/P0 cell line. Filled circles, tumor outgrowth in the mouse. A representative mouse experiment showing the growth property of P0 and P3 cell lines in (B) naïve and (C) immunized mice. D, microrray data showing the most highly expressed genes in P3 by at least 10-fold (NCBI accession number GSE2774).
VCAM-1 is up-regulated in the immune-resistant variant P3
We first checked the surface MHC class I expression of P0 and P3, as decreased class I expression is frequently observed in many cancers. We found that P3 has a very low level of MHC class I expression, whereas P0 has a relatively high level of expression. However, this decreased expression of MHC class I can be restored by treatment of P3 with IFN-γ (27). To look for additional mechanisms underlying the immune resistance in P3, we compared gene expression profiles of the P0 and P3 cell lines using Affymetrix GeneChip Mouse Genome 430 2.0 arrays (NCBI accession number GSE2774). Analysis of microarray data showed that one of the most highly up-regulated genes in P3 was VCAM-1 (see Fig. 1D). We confirmed the differential expression of VCAM-1 in P3 using semiquantitative and quantitative RT-PCR (Fig. 2A and B). This differential expression was also seen at the protein level (Fig. 2C). Next, we cloned full-length mouse VCAM-1 cDNA into the pMSCVpuro retroviral vector, and the virus was used to generate the P0-VCAM-1 cell line. P0 tumor cells transfected with pMSCVpuro vector without insert (P0-NoInsert) were used as negative controls. The expression of VCAM-1 on P0-VCAM-1 was confirmed by surface staining (Fig. 2D). It should be noted that the expression level of VCAM-1 on P0-VCAM-1 is comparable to that of the P3 cell line. These lines provided the opportunity to assess the role of VCAM-1 in tumor immune evasion independent of any other genetic or epigenetic changes in P3.
Figure 2.

Characterization of VCAM-1 expression in P0 and P3. A, semiquantitative RT-PCR shows that VCAM-1 transcript is more abundant in P3 than P0. B, real-time quantitative RT-PCR shows that there is a 6.6-fold increase in VCAM-1 transcript in P3. C, flow cytometry analysis shows that P3 expresses a significantly higher level of VCAM-1 than does P0. Dotted lines, cells stained with isotype control antibody. D, flow cytometry analysis characterizes the expression of VCAM-1 in P0-VCAM-1 and P0-NoInsert cell lines.
Ectopic expression of VCAM-1 by P0 tumor cells increases its immune resistance in vivo
In murine experiments using C57BL/6 mice, we found that P0-VCAM-1 cells grew more aggressively than control P0-NoInsert cells. In both naïve mice and mice immunized with vaccinia Sig/E7/LAMP-1, P0-VCAM-1 developed into palpable tumors within 10 days of injection. In comparison, whereas all of P0-NoInsert tumor-injected mice developed into palpable tumors within 10 days in naïve mice, 40% of P0-NoInsert tumor remained tumor-free in the immunized mice (Fig. 3A). In naïve mice, P0-NoInsert tumors tended to be small. The growth difference of these two cell lines could be appreciated by weighing the tumors 4 weeks after injection; in both naïve and immunized mice, P0-VCAM-1 tumors were at least 2- to 3-fold larger than P0-NoInsert tumors (27). We confirmed that this growth difference was due to differential susceptibility to antitumor immunity by injecting P0-VCAM-1 and P0-NoInsert into RAG1 knock-out mice, which have no T and B lymphocytes. P0-VCAM-1 and P0-NoInsert tumors exhibited the similar growth kinetics and relatively similar size in RAG1 knock-out mice (P > 0.05). In contrast, in the wild-type C57BL/6 mice, there was a significant difference of tumor growth between P0-NoInsert and P0-VCAM-1 tumors (P < 0.01; Fig. 3B). These findings provided evidence that the presence of lymphocytes has led to the growth retardation of P0-NoInsert tumors, whereas P0-VCAM-1 is incapable of being controlled by T cells.
Figure 3.

VCAM-1 converts P0 from a susceptible cell line into a resistant cell line through an immune-mediated mechanism. A, in vivo tumor growth experiment in C57BL/6 mice. Both P0-VCAM-1 and P0-NoInsert cell lines were injected into naïve C57BL/6 mice (five per group) at a dose of 1 × 10⁵ tumor cells per mouse. In addition, both types of cell lines were injected into C57BL/6 mice (five per group) immunized with vaccinia Sig/E7/LAMP-1 7 d after immunization. B, in vivo tumor growth experiment in immunocompetent C57BL/6 mice and in RAG1−/− mice. Both P0-VCAM-1 and P0-NoInsert cell lines were injected into immunocompetent C57BL/6 mice and in RAG1−/− mice (five per group) at a dose of 1 × 10⁵ tumor cells per mouse. P0-VCAM-1 and P0-NoInsert tumors have similar growth kinetics and size in RAG1−/− mice. However, P0-VCAM-1 and P0-NoInsert tumors have significantly different growth kinetics, suggesting that their size difference in wild-type, naïve mice is lymphocyte mediated.
VCAM-1 expression by tumor cells decreases apoptosis of P0-VCAM-1 tumor cells and reduces the number of CD8+ T cells inside the tumors
To identify the mechanisms underlying VCAM-1–mediated immune resistance, we isolated P0-NoInsert and P0-VCAM-1 tumors from naïve mice 10 days after inoculation and determined the extent of apoptosis in the tumors using TUNEL assays. We noted widespread apoptosis in P0-NoInsert tissue sections, whereas there were few TUNEL-positive cells in P0-VCAM-1 tissue sections (Fig. 4A). To ensure that this was not due to the intrinsic nature of tumor cells, we characterized the basal levels of apoptosis in the P0-NoInsert and P0-VCAM-1 tumor cells in vitro by measuring caspase-3 levels. We found no significant difference between P0-NoInsert and P0-VCAM-1 tumors (data not shown).
Figure 4.

VCAM-1 expression promotes the migration of CD8+ T cells, resulting in a fewer number of apoptotic cells and a lower number of infiltrating CD8+ T cells. A, TUNEL assay. Frozen sections of P0-NoInsert and P0-VCAM-1 were stained for apoptotic cells using TUNEL assay. The number of apoptotic cells in P0-NoInsert and P0-VCAM-1 tumors was determined by counting TUNEL-positive cells in two representative frozen sections. B, left, representative staining of total CD8+ T cells by flow cytometry analysis. CD8+ T cells in single cell suspensions of P0-NoInsert and P0-VCAM-1 tumors were isolated 11 d after inoculation. B, right, bar graph depicting the number of total CD8+ T cells in the P0-NoInsert and P0-VCAM-1 tumors by flow cytometry analysis on days 7, 9, and 11. Five tumors were analyzed for each time point. C, bar graph depicting the number of CD4+ T cells and natural killer cells in the P0-NoInsert and P0-VCAM-1 tumors. C57BL/6 mice (five per group) were challenged with either P0-NoInsert or P0-VCAM-1 tumors. Tumor-infiltrating lymphocytes were isolated, and the numbers of CD4+ T cells and natural killer cells in the P0-VCAM-1 tumors and P0-NoInsert tumors were determined using flow cytometry analysis. D, in vitro transwell migration experiments. About 5 × 10⁴ of total CD8+ T cells were put into wells that were coated with either VCAM-1-Fc or control IgG1-Fc (left ). Recombinant VCAM-1 can prompt the migration of freshly isolated tumor-infiltrating CD8+ T cells. In another experiment, 5 × 10⁴ of total CD8+ T cells were put into wells that were coated with VCAM-1-Fc. The wells were added with antimouse α4 integrin antibody (PS/2) or control Rat IgG (right ). Blocking with antimouse α4 integrin antibody (PS/2) significantly retarded the migration of freshly isolated tumor-infiltrating CD8+ T cells in the transwell migration assay.
To determine whether this differential apoptosis is related to the number of tumor-infiltrating CD8+ T cells, we isolated P0-NoInsert and P0-VCAM-1 tumors, prepared single cell suspensions, and characterized the presence of CD8+ T cells in tumors by flow cytometry analysis. As shown in Fig. 4B, P0-NoInsert tumors contain significantly more CD8+ T cells than P0-VCAM-1 tumors. This clear difference in the number of CD8+ T cells infiltrating the tumors correlates with the difference in the extent of apoptosis in P0-VCAM-1 and P0-NoInsert tumors. We also characterized the other inflammatory cells in the P0-VCAM-1 tumors and in the P0 tumors and found a significant decrease of CD4+ Tcells and natural killer cells in P0-VCAM-1 compared with P0 tumors (Fig. 4C). The newly generated data were expected because the expression of VLA-4 has been shown in CD4+ T cells (28, 29) and natural killer cells (30, 31).
VCAM-1 can promote migration of CD8+ T cells in vitro
Previous studies have shown that binding of VCAM-1 to α4β1 integrin (VLA-4) can promote the migration of CD8+ T cells ( for review, see ref. 32). We characterized the α4β1 integrin expression in tumor infiltrating lymphocytes (TIL) and in splenocytes derived from P0 tumors. We found that CD8+ TILs exhibit higher expression of α4β1 integrin as compared with CD8+ T cells in the spleen (see Supplementary Fig. S1). Thus, to test if the presence of VCAM-1 can influence the migration of infiltrating CD8+ T cells, we did in vitro transwell migration assays. CD8+ T cells isolated from the tumors were put in the upper chamber, which was coated with recombinant VCAM-1-Fc or human IgG-Fc. We found that the T cells put in the upper chamber coated with VCAM-1-Fc showed an increased ability to migrate toward SDF-1a compared with the T cells put in the upper chamber coated with IgG-Fc (Fig. 4D, left). In addition, we showed that this migration is dependent on α4 integrin because the addition of an α4 integrin-blocking antibody (PS/2) led to a significant inhibition of migration (Fig. 4D, right). Thus, these in vitro studies suggest that tumor expression of VCAM-1 may modulate the motility of infiltrating CD8 T cells.
Mutation of α4β1 integrin-binding sites on VCAM-1 completely abolishes the immune resistance conferred by VCAM-1 in vivo
VCAM-1 has been shown to bind to its receptor VLA-4 (α4β1 integrin) through two independent binding sites in immunoglobulin domains 1 and 4 of its extracellular portion (33–35). To better understand how VCAM-1 promotes immune resistance through interaction with VLA-4 in vivo, we generated two VCAM-1 mutants by modifying the key binding sites in domain 1 or domain 4. Both domains 1 and 4 contain a highly conserved integrin-binding motif (IDSPL; ref. 34). We mutated the aspartate residue in each binding site to alanine, generating two constructs called VCAM-1/D40A and VCAM-1/D328A (Fig. 5A). These constructs were used to transfect P0 tumor cells to generate two cell lines, P0-VCAM-1/D40A and P0-VCAM-1/D328A. The expression of these VCAM-1 mutants was verified by surface staining and was comparable to the expression level of P0-VCAM-1 (Fig. 5B). Next, we injected these cell lines into naïve and immunized mice. The growth behavior of P0-VCAM-1/D40A and P0-VCAM-1/D328A was indistinguishable from that of P0-NoInsert, demonstrating that either single mutation can completely abolish the resistance conferred by VCAM-1 in vivo (Fig. 5C). These in vivo experiments showed that the immune resistance provided by VCAM-1 requires its interaction with its receptor, α4β1 integrin.
Figure 5.

VCAM-1–mediated impairment of T cell effector functions is integrin dependent. A, two VCAM-1 mutants (VCAM-1/D40A and VCAM-1/D328A). The location of the amino acid change in domains 1 and 4 of VCAM-1 was indicated by A. Tm/Cy, the transmembrane and cytoplasmic domains. B, flow cytometry analysis that characterize the relative levels of VCAM-1 expression in P0-VCAM-1/D40A and P0-VCAM-1/D328A cell lines. Both P0-VCAM-1/D40A and P0-VCAM-1/D328A cell lines expressed similar levels of VCAM-1 compared with P0-VCAM-1. C, in vivo tumor growth experiment. C57BL/6 mice (five per group) were immunized with 1 × 10⁷ pfu/mouse of vaccinia Sig/E7/LAMP-1. Seven days after the vaccination, immunized mice were challenged with the various tumor cell lines at a dose of 1 × 10⁵ tumor cells per mouse. P0-VCAM-1/D40A and P0-VCAM-1/D328A have completely lost immune resistance.
Mutation of VCAM-1 in P0-VCAM-1 tumor cells (VCAM-1/D40A and VCAM-1/D328A) restores the number of infiltrating CD8+ T cells in tumors similar to the amount of CD8+ T cells in P0
Our data indicated that expression of VCAM-1 in P0 tumors led to a decrease in the amount of infiltrating CD8+ T cells in tumors (see Fig. 4B). To determine if a single mutation on VCAM-1 can restore the number of infiltrating CD8+ T cells in tumors, CD8+ T cells in single cell suspensions from P0-NoInsert, P0-VCAM-1/D40A, P0-VCAM-1/D328A, and P0-VCAM-1 tumors were isolated 11 days after inoculation and characterized by flow cytometry analysis. As shown in Fig. 6A, whereas P0-VCAM-1 tumor cells had a low number of CD8+ T cells present in the tumor, a single mutation in VCAM-1 (VCAM-1/D40A and VCAM-1/D328A) increased the number of CD8+ T cells in levels similar to P0-NI. These data indicate that a single amino acid mutation of VCAM-1 at a site important for interaction with α4β1 integrin can significantly influence the number of infiltrating CD8+ T cells in tumors.
Figure 6.

Mutation of VCAM-1 in P0-VCAM-1 tumor cells restores the number of tumor-infiltrating CD8+ T cells and leads to the accumulation of E7-specific CD8+ T cells in the tumors. A, CD8+ T cells in single cell suspensions of P0-NoInsert, P0-VCAM-1/D40A, P0-VCAM-1/D328A, and P0-VCAM-1 tumors were isolated 11 d after inoculation. The number of CD8+ T cells within the various tumors was characterized by flow cytometry analysis. Bar graphs depicting the percentage of CD8+ T cells in tumors are shown. Five tumors were analyzed in each group. B, C57BL/6 mice (five per group) were challenged s.c. with P0-VCAM-1 tumors in the right hind leg and with either P0 tumor cells or P0-VCAM-1 D40A tumor cells in the left hind leg. One week later, tumor-bearing mice were injected with the luciferase-expressing E7-specific CD8+ T cells (5 × 10⁶ per mouse) by tail vein. The intensity of luminescence in the T cell–challenged mice was monitored on days 0, 1, 3, and 7 after transfer of the T cells using the IVIS 200 system (Xenogen). Tumor-bearing mice, which did not receive E7-specific CD8+ T cells, were used as a negative control. An integration time of 5 min was used for luminescence image acquisition. C, line graph depicting the photon counts in T cell-challenged mice on days 0, 1, 3, and 7 after transfer of T cells.
E7-specific CD8+ T cells were concentrated in P0 and P0-VCAM-1/D40A but not in P0-VCAM-1 tumor cells
To further assess if the expression of VCAM-1 in P0 tumor cells would lead to a reduction in the amount of E7-specific CD8+ T cells, we injected tumor-bearing mice with luciferase-expressing E7-specific CD8+ T cells. C57BL/6 mice were challenged with P0-VCAM-1 tumor in the right hind leg and with either P0 tumor cells or P0-VCAM-1/D40A tumor cells in the left hind leg. One week after the tumor challenge, the mice were injected with luciferase-expressing E7-specific CD8+ T cells through the tail vein. Luminescence image acquisition was done on days 0, 1, 3, and 7 after transfer of the T cells. Tumor-bearing mice, which did not receive E7-specific CD8+ T cells, were used as a negative control. As shown in Fig. 6B and C, whereas E7-specific CD8+ T cells were concentrated in P0 tumors beginning on day 1, a significantly reduced number of E7-specific CD8+ T cells was observed in P0-VCAM-1 tumors. Furthermore, a significant number of E7-specific CD8+ T cells was observed within the P0-VCAM-1/D40A tumors (with a single amino acid change on VCAM-1), similar to the amount of E7-specific CD8+ T cells within the P0 tumors. Similar results were observed in P0-VCAM-1/D328A tumors (data not shown). Our data indicated that VCAM-1 plays an important role in the reduction of antigen-specific CD8+ T cells in the tumors, and that the amino acid locations within VCAM-1, which mediate interaction with α4β1 integrin, are crucial in reducing the number of E7-specific CD8+ T cells within the tumor.
Down-regulation of VCAM-1 in P3 tumors leads to reduced tumor immune evasion
To determine whether the down-regulation of VCAM-1 in the P3 tumors leads to reduced tumor immune evasion, we generated lentivirus encoding small interfering RNA (siRNA) targeting VCAM-1. To confirm that the P3 tumor transduced with the lentivirus leads to down-regulation of VCAM-1, we did flow cytometry analysis using VCAM-1–specific antibody. We found that P3 tumors transduced with lentivirus encoding siRNA targeting VCAM-1(P3-VCAM-1 RNAi) resulted in almost undetectable levels of VCAM-1, similar to the level of VCAM-1 in P0 tumors. In comparison, P3 tumors transduced with the empty vector (P3-empty vector) did not lead to a decrease of VCAM-1 levels (similar to the parental P3 tumors; see Supplementary Fig. S2A). To determine the influence of down-regulation of VCAM-1 on tumor immune evasion of the P3 tumors, we characterized the tumor growth of the P3-VCAM RNAi, P3-empty vector, P3, and P0 tumors in mice vaccinated with 1 × 10⁷ pfu/mouse of Sig/E7/LAMP-1 vaccinia and measured the tumor volume over time. We found that there was a significant decrease in tumor volume in the P3-VCAM-1 RNAi compared with P3-empty vector tumors 2 weeks after tumor challenge (see Supplementary Fig. S2B). However, the down-regulation of VCAM-1 did not completely abolish the tumor immune evasion phenotype of P3 tumors (see Supplementary Fig. S2B). Thus, our data suggest that VCAM-1 is an important factor involved in tumor immune evasion, but other factors may also contribute to the tumor immune evasion in the P3 tumor.
Human renal cell carcinoma cell lines express VCAM-1
We also found that many human renal cell carcinoma (RCC) cell lines express VCAM-1. We searched for human cancers with over-expression of VCAM-1 using the Oncomine 2.0 Cancer Microarray Database (36, 37). Analysis of this database showed that most human cancers do not up-regulate VCAM-1. However, human RCC was highly positive for VCAM-1 expression in comparison with other cancers or normal renal tissues. Surface staining of several human RCC cell lines showed that most indeed stained positive for VCAM-1 (see Supplementary Fig. S3). Interestingly, we found that the only cell line (RCC1.24 B7) that stained negative for VCAM-1 was derived from the only patient from a previous clinical trial (38) who responded to an irradiated granulocyte macrophage colony-stimulating factor (GM-CSF)–secreting RCC tumor vaccine. These findings suggest that at least a subset of human RCC express VCAM-1, and that the expression of VCAM-1 may serve as an indicator for the outcome of immunotherapy.
Discussion
We have identified a novel mechanism for tumor immune escape using an in vivo selection strategy. We first generated an immune-resistant cancer cell line (P3) by subjecting a susceptible cancer cell line (P0) to three rounds of in vivo immune selection. Using these two cell lines, we carried out microarray analysis to identify candidate genes for functional screening. Mouse experiments consistently showed that tumor expression of VCAM-1 could lead to immune resistance and allow the tumor cells to grow in mice with preexisting immunity.
VCAM-1 is known be to expressed by many different cell types, including activated endothelial cells, bone marrow stromal cells, spleen stromal cells, thymic epithelial cells, and some dendritic cells in the spleen (39–43). Among these cells, VCAM-1 is well recognized for its up-regulated expression in activated endothelium, where it facilitates the trafficking of leukocytes through the endothelium and into inflamed, infected tissues (32). In this context, our findings are unexpected because they show that a proinflammatory integrin ligand such as VCAM-1 can dramatically impair antitumor immune responses when it is expressed by tumor cells.
Although VCAM-1 expression by human RCC have been reported previously, our finding was particularly intriguing because the only RCC cell line (RCC1.24 B7) that stained negative for VCAM-1 turned out to be derived from the only patient who responded to a GM-CSF vaccine from our clinical trial (44). Because the RCC cell lines came from a pilot clinical trial, additional large-scale studies are required to confirm that VCAM-1 expression by human RCC can adversely affect an antitumor immune response.
One likely explanation for VCAM-1–mediated immune resistance is that VCAM-1 can promote T cell migration, thereby minimizing the contact between T cells and the tumor cells. The ability of VCAM-1 to promote the migration of CD8+ T cells is well documented (45–48). Several studies have shown that α4 integrin possesses the unique property of opposing cellular spreading and focal adhesion formation while promoting cells for migration (48–50). More specifically, it has been shown that binding of VCAM-1 to α4 integrin leads to the specific association of the cytoplasmic tail of α4 integrin to paxillin, a signaling adaptor protein. This association leads to phosphorylation of paxillin, which can then phosphorylate and activate focal adhesion kinase (FAK; ref. 49). In turn, FAK can interact with Src kinases and regulate the disassembly of focal adhesions and integrin-dependent cell migration. In addition, binding of α4β1 integrin to VCAM-1 can also stimulate T cell migration mediated by LFA-1 (αLβ2 integrin; ref. 45).
Consistent with these previous reports, our data showed that there is a significant decrease in the number of CD8+ T cells in P0-VCAM-1 tumors compared with P0-NoInsert tumors. Furthermore, our in vitro transwell studies showed that VCAM-1 can promote the migration of freshly isolated tumor-infiltrating CD8+ T cells, and that this VCAM-1–mediated migration is diminished in the presence of an α4 integrin blocking antibody. To eliminate the concern that tumor cells also express VLA-4, which may influence the interpretation of the data, we characterized the expression of VLA-4 in the P0, P3, P0-NoInsert, and P0-VCAM-1 tumors. We found no detectable expression of VLA-4 in the tumors (data not shown). Because all the tumor cells do not express VLA-4, we do not expect significant difference in cell-cell adhesion among the different tumor cells. Nevertheless, we examined the cell-cell adhesion using the three-dimensional collagen cell culture system (Chemicon-Millipore, Billerica, MA) with Madin-Darby canine kidney cells as the positive control. We observed no significant difference in cell adhesion between the P0-NoInsert and P0-VCAM-1 tumor cells (data not shown).
Furthermore, to avoid the concern that tumor cells are able to express chemotactic factors such as SDF-1, which could potentially influence the number of CD8+ T cells in the tumor, we examined the chemokine profile between P0 and P3 tumors. We found similar expression of SDF1 in P0 and P3 tumors (data not shown). Furthermore, to ensure that the observed results are not due to migration defects of CD8+ T cells derived from the P0-VCAM-1 tumors or the P0-NoInsert tumors, we compared the migration of CD8+ T cells isolated from P0-VCAM-1 and P0-NoInsert tumors using in vitro transwell experiments with SDF-1a. We observed no significant difference in the chemotaxis of the CD8+ T cells derived from the tumors (data not shown). Taken together, these findings suggest that tumor expression of VCAM-1 might promote T cell migration away from tumors, resulting in decreased accumulation of T cells inside the tumors. The decreased accumulation of T cells around tumor cells might contribute to the ability of P0-VCAM-1 tumor cells to escape immune attack.
The mouse experiments using site-specific VCAM-1 mutants provided additional evidence that integrin receptors play a role in the immune resistance provided by VCAM-1. The specific aspartate residues, D40 and D328, have been shown to be required for VCAM-1 interaction with its integrin receptors α4β1 (34). Our data showed that substitution of either aspartate residue with alanine completely abolished the immune resistance conferred by VCAM-1 in vivo. These findings strongly suggest that the immune resistance mediated by VCAM-1 requires its interaction with its integrin receptors, such as α4β1.
This work represents the first report demonstrating that dysregulation of a cell adhesion molecule by tumor cells can interfere with immune functions. Because a wide variety of cell adhesion molecules are known to be dysregulated in cancers, this study raises the question of whether dysregulation of other cell adhesion molecules can also play a role in tumor escape from immune attack (51). Lastly, this study shows the usefulness of using in vivo immune selection to study tumor escape. Similar approaches can be taken to generate highly resistant variants from other murine cancer cell lines. Characterization of these resistant variants may lead to identification of additional tumor escape mechanisms.
Supplementary Material
Acknowledgments
Grant support: National Cancer Institute 1RO1 CA114425-01, U19 CA113341-01, and 1P50 CA098252-02.
We thank Steve Desiderio, Mark Soloski, and Paula Pitha-Rowe for helpful discussions.
Footnotes
Note: Supplementary data for this article are available at Cancer Research Online (http://cancerres.aacrjournals.org/).
K. Lin is a recipient of the Howard Hughes Predoctoral Fellowship.
References
- 1.Boon T, Cerottini JC, Van den Eynde B, van der Bruggen P, Van Pel A. Tumor antigens recognized by T lymphocytes. Annu Rev Immunol. 1994;12:337–65. doi: 10.1146/annurev.iy.12.040194.002005. [DOI] [PubMed] [Google Scholar]
- 2.Pardoll DM. Spinning molecular immunology into successful immunotherapy. Nat Rev Immunol. 2002;2:227–38. doi: 10.1038/nri774. [DOI] [PubMed] [Google Scholar]
- 3.Rosenberg SA, Yang JC, Restifo NP. Cancer immunotherapy: moving beyond current vaccines. Nat Med. 2004;10:909–15. doi: 10.1038/nm1100. [DOI] [PMC free article] [PubMed] [Google Scholar]
- 4.Dunn GP, Old LJ, Schreiber RD. The three Es of cancer immunoediting. Annu Rev Immunol. 2004;22:329–60. doi: 10.1146/annurev.immunol.22.012703.104803. [DOI] [PubMed] [Google Scholar]
- 5.Khong HT, Restifo NP. Natural selection of tumor variants in the generation of “tumor escape” phenotypes. Nat Immunol. 2002;3:999–1005. doi: 10.1038/ni1102-999. [DOI] [PMC free article] [PubMed] [Google Scholar]
- 6.Hicklin DJ, Marincola FM, Ferrone S. HLA class I antigen downregulation in human cancers: T-cell immunotherapy revives an old story. Mol Med Today. 1999;5:178–86. doi: 10.1016/s1357-4310(99)01451-3. [DOI] [PubMed] [Google Scholar]
- 7.Seliger B, Cabrera T, Garrido F, Ferrone S. HLA class I antigen abnormalities and immune escape by malignant cells. Semin Cancer Biol. 2002;12:3–13. doi: 10.1006/scbi.2001.0404. [DOI] [PubMed] [Google Scholar]
- 8.Gorelik L, Flavell RA. Immune-mediated eradication of tumors through the blockade of transforming growth factor-β signaling in T cells. Nat Med. 2001;7:1118–22. doi: 10.1038/nm1001-1118. [DOI] [PubMed] [Google Scholar]
- 9.Yue FY, Dummer R, Geertsen R, et al. Interleukin-10 is a growth factor for human melanoma cells and down-regulates HLA class-I, HLA class-II and ICAM-1 molecules. Int J Cancer. 1997;71:630–7. doi: 10.1002/(sici)1097-0215(19970516)71:4<630::aid-ijc20>3.0.co;2-e. [DOI] [PubMed] [Google Scholar]
- 10.Gabrilovich DI, Chen HL, Girgis KR, et al. Production of vascular endothelial growth factor by human tumors inhibits the functional maturation of dendritic cells. Nat Med. 1996;2:1096–103. doi: 10.1038/nm1096-1096. [DOI] [PubMed] [Google Scholar]
- 11.Sotomayor EM, Borrello I, Levitsky HI. Tolerance and cancer: a critical issue in tumor immunology. Crit Rev Oncog. 1996;7:433–56. doi: 10.1615/critrevoncog.v7.i5-6.30. [DOI] [PubMed] [Google Scholar]
- 12.Staveley-O’Carroll K, Sotomayor E, Montgomery J, et al. Induction of antigen-specific T cell anergy: an early event in the course of tumor progression. Proc Natl Acad Sci U S A. 1998;95:1178–83. doi: 10.1073/pnas.95.3.1178. [DOI] [PMC free article] [PubMed] [Google Scholar]
- 13.Liyanage UK, Moore TT, Joo HG, et al. Prevalence of regulatory T cells is increased in peripheral blood and tumor microenvironment of patients with pancreas or breast adenocarcinoma. J Immunol. 2002;169:2756–61. doi: 10.4049/jimmunol.169.5.2756. [DOI] [PubMed] [Google Scholar]
- 14.Curiel TJ, Coukos G, Zou L, et al. Specific recruitment of regulatory T cells in ovarian carcinoma fosters immune privilege and predicts reduced survival. Nat Med. 2004;10:942–9. doi: 10.1038/nm1093. [DOI] [PubMed] [Google Scholar]
- 15.Singh S, Ross SR, Acena M, Rowley DA, Schreiber H. Stroma is critical for preventing or permitting immunological destruction of antigenic cancer cells. J Exp Med. 1992;175:139–46. doi: 10.1084/jem.175.1.139. [DOI] [PMC free article] [PubMed] [Google Scholar]
- 16.Dong H, Strome SE, Salomao DR, et al. Tumor-associated B7-1 promotes T-cell apoptosis: a potential mechanism of immune evasion. Nat Med. 2002;8:793–800. doi: 10.1038/nm730. [DOI] [PubMed] [Google Scholar]
- 17.Munn DH, Mellor AL. IDO and tolerance to tumors. Trends Mol Med. 2004;10:15–8. doi: 10.1016/j.molmed.2003.11.003. [DOI] [PubMed] [Google Scholar]
- 18.Rubinstein N, Alvarez M, Zwirner NW, et al. Targeted inhibition of galectin-1 gene expression in tumor cells results in heightened T cell-mediated rejection; A potential mechanism of tumor immune privilege. Cancer Cell. 2004;5:241–51. doi: 10.1016/s1535-6108(04)00024-8. [DOI] [PubMed] [Google Scholar]
- 19.Groh V, Wu J, Yee C, Spies T. Tumour-derived soluble MIC ligands impair expression of NKG2D and T-cell activation. Nature. 2002;419:734–8. doi: 10.1038/nature01112. [DOI] [PubMed] [Google Scholar]
- 20.Irizarry RA, Hobbs B, Collin F, et al. Exploration, normalization, and summaries of high density oligonucleotide array probe level data. Biostatistics. 2003;4:249–64. doi: 10.1093/biostatistics/4.2.249. [DOI] [PubMed] [Google Scholar]
- 21.Bolstad BM, Irizarry RA, Astrand M, Speed TP. A comparison of normalization methods for high density oligonucleotide array data based on variance and bias. Bioinformatics. 2003;19:185–93. doi: 10.1093/bioinformatics/19.2.185. [DOI] [PubMed] [Google Scholar]
- 22.Kendziorski CM, Newton MA, Lan H, Gould MN. On parametric empirical Bayes methods for comparing multiple groups using replicated gene expression profiles. Stat Med. 2003;22:3899–914. doi: 10.1002/sim.1548. [DOI] [PubMed] [Google Scholar]
- 23.Newton MA, Kendziorski CM, Richmond CS, Blattner FR, Tsui KW. On differential variability of expression ratios: improving statistical inference about gene expression changes from microarray data. J Comput Biol. 2001;8:37–52. doi: 10.1089/106652701300099074. [DOI] [PubMed] [Google Scholar]
- 24.Wang TL, Ling M, Shih IM, et al. Intramuscular administration of E7-transfected dendritic cells generates the most potent E7-specific anti-tumor immunity. Gene Ther. 2000;7:726–33. doi: 10.1038/sj.gt.3301160. [DOI] [PubMed] [Google Scholar]
- 25.Lin KY, Guarnieri FG, Staveley-O’Carroll KF, et al. Treatment of established tumors with a novel vaccine that enhances major histocompatibility class II presentation of tumor antigen. Cancer Res. 1996;56:21–6. [PubMed] [Google Scholar]
- 26.Wu TC, Guarnieri FG, Staveley-O’Carroll KF, et al. Engineering an intracellular pathway for major histocompatibility complex class II presentation of antigens. Proc Natl Acad Sci U S A. 1995;92:11671–5. doi: 10.1073/pnas.92.25.11671. [DOI] [PMC free article] [PubMed] [Google Scholar]
- 27.Cheng WF, Hung CF, Lin KY, et al. CD8+ T cells, NK cells and IFN-γ are important for control of tumor with downregulated MHC class I expression by DNA vaccination. Gene Ther. 2003;10:1311–20. doi: 10.1038/sj.gt.3301982. [DOI] [PubMed] [Google Scholar]
- 28.Salomon DR, Mojcik CF, Chang AC, et al. Constitutive activation of integrin α4 β1 defines a unique stage of human thymocyte development. J Exp Med. 1994;179:1573–84. doi: 10.1084/jem.179.5.1573. [DOI] [PMC free article] [PubMed] [Google Scholar]
- 29.Mittelbrunn M, Molina A, Escribese MM, et al. VLA-4 integrin concentrates at the peripheral supramolecular activation complex of the immune synapse and drives T helper 1 responses. Proc Natl Acad Sci U S A. 2004;101:11058–63. doi: 10.1073/pnas.0307927101. [DOI] [PMC free article] [PubMed] [Google Scholar]
- 30.Melder RJ, Koenig GC, Witwer BP, Safabakhsh N, Munn LL, Jain RK. During angiogenesis, vascular endothelial growth factor and basic fibroblast growth factor regulate natural killer cell adhesion to tumor endothelium. Nat Med. 1996;2:992–7. doi: 10.1038/nm0996-992. [DOI] [PubMed] [Google Scholar]
- 31.Fogler WE, Volker K, McCormick KL, Watanabe M, Ortaldo JR, Wiltrout RH. NK cell infiltration into lung, liver, and subcutaneous B16 melanoma is mediated by VCAM-1/VLA-4 interaction. J Immunol. 1996;156:4707–14. [PubMed] [Google Scholar]
- 32.Pribila JT, Quale AC, Mueller KL, Shimizu Y. Integrins and T cell-mediated immunity. Annu Rev Immunol. 2004;22:157–80. doi: 10.1146/annurev.immunol.22.012703.104649. [DOI] [PubMed] [Google Scholar]
- 33.Renz ME, Chiu HH, Jones S, et al. Structural requirements for adhesion of soluble recombinant murine vascular cell adhesion molecule-1 to α4β1. J Cell Biol. 1994;125:1395–406. doi: 10.1083/jcb.125.6.1395. [DOI] [PMC free article] [PubMed] [Google Scholar]
- 34.Vonderheide RH, Tedder TF, Springer TA, Staunton DE. Residues within a conserved amino acid motif of domains 1 and 4 of VCAM-1 are required for binding to VLA-4. J Cell Biol. 1994;125:215–22. doi: 10.1083/jcb.125.1.215. [DOI] [PMC free article] [PubMed] [Google Scholar]
- 35.Jones EY, Harlos K, Bottomley MJ, et al. Crystal structure of an integrin-binding fragment of vascular cell adhesion molecule-1 at 1. 8 A ° resolution. Nature. 1995;373:539–44. doi: 10.1038/373539a0. [DOI] [PubMed] [Google Scholar]
- 36.Rhodes DR, Yu J, Shanker K, et al. ONCOMINE: a cancer microarray database and integrated data-mining platform. Neoplasia. 2004;6:1–6. doi: 10.1016/s1476-5586(04)80047-2. [DOI] [PMC free article] [PubMed] [Google Scholar]
- 37.Rhodes DR, Yu J, Shanker K, et al. Large-scale meta-analysis of cancer microarray data identifies common transcriptional profiles of neoplastic transformation and progression. Proc Natl Acad Sci U S A. 2004;101:9309–14. doi: 10.1073/pnas.0401994101. [DOI] [PMC free article] [PubMed] [Google Scholar]
- 38.Simons JW, Jaffee EM, Weber CE, et al. Bioactivity of autologous irradiated renal cell carcinoma vaccines generated by ex vivo granulocyte-macrophage colony-stimulating factor gene transfer. Cancer Res. 1997;57:1537–46. [PMC free article] [PubMed] [Google Scholar]
- 39.Miyake K, Medina K, Ishihara K, Kimoto M, Auerbach R, Kincade PW. A VCAM-like adhesion molecule on murine bone marrow stromal cells mediates binding of lymphocyte precursors in culture. J Cell Biol. 1991;114:557–65. doi: 10.1083/jcb.114.3.557. [DOI] [PMC free article] [PubMed] [Google Scholar]
- 40.Jacobsen K, Kravitz J, Kincade PW, Osmond DG. Adhesion receptors on bone marrow stromal cells: in vivo expression of vascular cell adhesion molecule-1 by reticular cells and sinusoidal endothelium in normal and γ-irradiated mice. Blood. 1996;87:73–82. [PubMed] [Google Scholar]
- 41.Castro A, Bono MR, Simon V, Vargas L, Rosemblatt M. Spleen-derived stromal cells. Adhesion molecules expression and lymphocyte adhesion to reticular cells. Eur J Cell Biol. 1997;74:321–8. [PubMed] [Google Scholar]
- 42.Salomon DR, Crisa L, Mojcik CF, Ishii JK, Klier G, Shevach EM. Vascular cell adhesion molecule-1 is expressed by cortical thymic epithelial cells and mediates thymocyte adhesion. Implications for the function of α4β1 (VLA4) integrin in T-cell development. Blood. 1997;89:2461–71. [PubMed] [Google Scholar]
- 43.Koni PA, Joshi SK, Temann UA, Olson D, Burkly L, Flavell RA. Conditional vascular cell adhesion molecule 1 deletion in mice: impaired lymphocyte migration to bone marrow. J Exp Med. 2001;193:741–54. doi: 10.1084/jem.193.6.741. [DOI] [PMC free article] [PubMed] [Google Scholar]
- 44.Vasselli JR, Shih JH, Iyengar SR, et al. Predicting survival in patients with metastatic kidney cancer by gene-expression profiling in the primary tumor. Proc Natl Acad Sci U S A. 2003;100:6958–63. doi: 10.1073/pnas.1131754100. [DOI] [PMC free article] [PubMed] [Google Scholar]
- 45.Rose DM, Liu S, Woodside DG, Han J, Schlaepfer DD, Ginsberg MH. Paxillin binding to the α4 integrin subunit stimulates LFA-1 (integrin αLβ2)-dependent T cell migration by augmenting the activation of focal adhesion kinase/proline-rich tyrosine kinase-2. J Immunol. 2003;170:5912–8. doi: 10.4049/jimmunol.170.12.5912. [DOI] [PubMed] [Google Scholar]
- 46.Han J, Rose DM, Woodside DG, Goldfinger LE, Ginsberg MH. Integrin α4 β1-dependent T cell migration requires both phosphorylation and dephosphorylation of the α4 cytoplasmic domain to regulate the reversible binding of paxillin. J Biol Chem. 2003;278:34845–53. doi: 10.1074/jbc.M304691200. [DOI] [PubMed] [Google Scholar]
- 47.Rose DM, Grabovsky V, Alon R, Ginsberg MH. The affinity of integrin α(4)β(1) governs lymphocyte migration. J Immunol. 2001;167:2824–30. doi: 10.4049/jimmunol.167.5.2824. [DOI] [PubMed] [Google Scholar]
- 48.Rose DM, Han J, Ginsberg MH. α4 integrins and the immune response. Immunol Rev. 2002;186:118–24. doi: 10.1034/j.1600-065x.2002.18611.x. [DOI] [PubMed] [Google Scholar]
- 49.Liu S, Thomas SM, Woodside DG, et al. Binding of paxillin to α4 integrins modifies integrin-dependent biological responses. Nature. 1999;402:676–81. doi: 10.1038/45264. [DOI] [PubMed] [Google Scholar]
- 50.Kassner PD, Alon R, Springer TA, Hemler ME. Specialized functional properties of the integrin α4 cytoplasmic domain. Mol Biol Cell. 1995;6:661–74. doi: 10.1091/mbc.6.6.661. [DOI] [PMC free article] [PubMed] [Google Scholar]
- 51.Cavallaro U, Christofori G. Cell adhesion and signalling by cadherins and Ig-CAMs in cancer. Nat Rev Cancer. 2004;4:118–32. doi: 10.1038/nrc1276. [DOI] [PubMed] [Google Scholar]
Associated Data
This section collects any data citations, data availability statements, or supplementary materials included in this article.