

Abstract
Objectives
N-acetyltransferase 1 (NAT1) metabolizes drugs and environmental carcinogens. NAT1 alleles *10 and *11 have been proposed to alter protein level or enzyme activity compared to wild-type NAT1 *4 and to confer cancer risk, via uncertain pathways. This study characterizes regulatory polymorphisms and underlying mechanisms of NAT1 expression.
Methods
We measured allelic NAT1 mRNA expression and translation, as a function of multiple transcription start sites, alternative splicing, and three 3′-polyadenylation sites in human livers (one of which discovered in this study), B lymphocytes, and transfected cells. In a clinical study of 469 HIV/AIDS patients treated with the NAT1/NAT2 substrate sulfamethoxazole (SMX), associations were tested between SMX induced hypersensitivity and NAT1 *10 and *11 genotypes, together with known NAT2 polymorphisms.
Results
NAT1*10 and *11 were determined to act as common regulatory alleles accounting for most NAT1 expression variability, both leading to increased translation into active protein. NAT1*11 (2.4% minor allele frequency) affected 3′polyadenylation site usage, thereby increasing formation of NAT1 mRNA with intermediate length 3′UTR (major isoform) at the expense of the short isoform, resulting in more efficient protein translation. NAT1 *10 (19% minor allele frequency) increased translation efficiency without affecting 3′-UTR polyadenylation site usage. Livers and B-lymphocytes with *11/*4 and *10/*10 genotypes displayed higher NAT1 immunoreactivity and NAT1 enzyme activity than the reference genotype *4/*4. Patients who carry *10/*10 and *11/*4 (‘fast NAT1 acetylators’) were less likely to develop hypersensitivity to SMX, but this was observed only in subjects also carrying a slow NAT2 acetylator genotype.
Conclusion
NAT1 *10 and *11 significantly increase NAT1 protein level/enzyme activity, enabling the classification of carriers into reference and rapid acetylators. Rapid NAT1 acetylator status appears to protect against SMX toxicity by compensating for slow NAT2 acetylator status.
Keywords: N-acetyltransferase, NAT1, polyadenylation, allelic expression imbalance, sulfamethoxazole, cotrimoxazole, protein translation, acetylator phenotype, idiosyncratic drug reactions
Introduction
Human N-acetyltransferase 1 (NAT1) metabolizes numerous drugs, environmental carcinogens, and endogenous substrates such as folate. It catalyzes N-acetylation of arylamines or arylhydrazines, O-acetylation of arylhydroxylamines, and N to O acetyl transfer of acetylhydroxamates, resulting in either biological activation or inactivation [1, 2]. NAT1 maps to chromosome location, 8p21.3, next to its homologue NAT2 and an inactive pseudogene, NATP. While sharing high sequence similarity in the coding region, NAT1 and NAT2 differ markedly in gene structure, tissue expression and substrate specificity [1]. NAT1 is ubiquitously expressed, whereas NAT2 expression is mainly restricted to liver and intestine. NAT1 consists of a single coding exon and 8 differentially spliced upstream exons with three proposed promoters (Fig. 1), giving rise to multiple 5′UTR mRNA variants reported to have different protein translation efficiencies [2–7]. In contrast, NAT2 has only one upstream exon and one promoter [1, 7].
Figure 1.

NAT1 gene structure with three types of transcripts and 5′UTR splice variants [7]. P1, P2 and P3 represent three promoter regions. The consensus poly-adenylation signal sites polyA1, polyA2, and polyA3 produce short, major and long 3′UTR isoforms, respectively. F1, F2, R1, R2, IIF and IIIF indicate the location and direction of PCR primers.
NAT2 is highly polymorphic with several loss-of-function non-synonymous SNPs [1] that are associated with isoniazid-induced hepatitis [8], sulfamethoxazole (SMX)-induced cutaneous hypersensitivity [9–11] and cancer risk [12, 13]. In contrast, NAT1 was thought to be less variable [14], possibly because of the low frequency of coding region SNPs, as earlier studies had mainly focused on non-synonymous SNPs. Currently, two common NAT1 alleles, *10 and *11, have been identified. NAT1 *10 contains one unique SNP in the 3′UTR (rs1057126), while *11 consists of a haplotype with two SNPs upstream of coding exon 9 (rs4986989 and rs4986988), three SNPs in the coding region (rs4987076, rs4986990, rs4986783), and a nine-base pair deletion (three TAA repeats, rs72554666) in the 3′UTR. NAT1 *10 was associated with higher N-acetylation activity and DNA adduct formation in human bladder and colon tissues [15, 16], risks of birth defect [17, 18] and cancers [12, 19, 20]. Also, NAT1 *11, in combination with NAT2 genotype and environmental factors, was associated with risk of cancers [12, 17–21]. Although all these phenotype-genotype association results suggest NAT1 *10 and *11 increase NAT1 enzyme activity, published results are inconsistent. For example, N-acetyltransferase activity in blood samples from individuals carrying *10 or *11 showed no change or decreased enzyme activity, respectively, compared to reference allele *4 (‘wild-type’) [22]. Moreover, results from in vitro studies on the functional effects of *10 and *11 have been equivocal [23–25], leaving molecular genetic mechanisms uncertain. Even the critical question remains unresolved whether *10 and *11 represent a gain- or loss-of-function. In vitro transfection of the *10 or *11 NAT1 coding region sequence showed either no change [13, 23, 24] or increased protein level/enzyme activity [25], compared to NAT1*4 [22]. Lastly, additional regulatory polymorphisms could exist contributing to NAT1 variability. As a result, NAT1 genotype cannot be used with confidence in clinical association studies.
The purpose of this study was to determine whether and how *10 and *11 regulate NAT1 mRNA or protein expression, and whether additional cis-acting regulatory polymorphisms exist. Because *10 does not alter the NAT1 amino acid sequence, and the coding region SNPs in *11 were found not to change enzyme activity [13], *10 and *11 appear to affect NAT1 activity by regulating transcription, mRNA processing, or translation. A complex spectrum of NAT1 mRNA transcripts is generated from three transcription start sites, alternative splicing, and at least two alternative polyadenylation sites (we describe here a third such site). We measured all NAT1 transcripts and translational efficiency of 3′UTRs with different length. Since cis-acting regulatory polymorphisms can be tissue specific [26, 27], we investigated the effect of NAT1 polymorphisms on expression in livers and B-lymphocytes – the latter chosen because immune cells are involved in sulfamethoxazole-induced hypersensitivity. In addition, we measured allelic mRNA expression, which has proven highly effective in finding regulatory polymorphisms in other genes, including CYP3A4 [27–29]. With this approach, we have identified *11 and *10 as the main functional regulatory polymorphisms accounting for increased NAT1 protein expression. The results further indicate that the regulation of both *11 and *10 involves post-transcriptional/translational processes, firmly establishing NAT1 as a highly polymorphic xenobiotic metabolizing enzyme.
The in vivo effect of NAT1 *10 and *11 on drug metabolism was assessed in a cohort of HIV/AIDS patients treated with sulfamethoxazole (SMX) to prevent opportunistic infections. Nearly 30% of HIV/AIDS patients develop hypersensitivity or idiosyncratic adverse drug reactions to SMX [30], mediated by reactive metabolites, oxidative stress, and immune response [31]. SMX is predominantly metabolized and inactivated in liver or target tissues by NAT1- and NAT2-mediated N-acetylation [32], with NAT1 having 10 times more binding affinity for SMX than NAT2 [33]. Moreover, NAT1 has broader tissue expression than NAT2 and can inactivate SMX in skin (keratinocytes) or immune cells, affecting cutaneous drug reactions [34]. Yet, thus far only NAT2 slow acetylator genotype/phenotype has been associated with SMX-induced hypersensitivity [10, 11, 35], but the results were inconsistent, especially in HIV/AIDS patients [36–39] who have reduced liver enzyme activity in general [40, 41]. In addition to the influence of HIV/AIDS and small samples size (less than 50 in case groups), incomplete genotyping of functionally relevant polymorphisms, especially polymorphisms in NAT1, could have caused inconsistent results. Here, we show that both NAT1 alleles *10 and *11 represent gain-of-function variants that appear to protect against SMX-induced hypersensitivity in HIV/AIDS patients with slow NAT2 acetylator genotype background.
Materials and Methods
Tissue samples
125 liver autopsy/biopsy samples were obtained from The Cooperative Human Tissue Network Midwestern and Western Division under protocol approved by The Ohio State University Institutional Review Board (OSU IRB). Ninety-six Epstein Barr (EB) virus-transformed B-lymphocytes were obtained from Coriell Cell Repositories.
Clinical information and specimens
Subjects included in this study had consented to an IRB-approved protocol designed to collect clinical data and specimens on HIV-infected individuals evaluated for participation in clinical trials between 1993 to 1998 in the HIV Clinical Research Unit at The Ohio State University Medical Center. A total of 469 individuals with HIV/AIDS who were taking Cotrimoxazole (trimethoprim-sulfamethoxazole) for prophylaxis or treatment of opportunistic infections and who had complete clinical data and banked blood samples available, were identified. Genomic DNA samples were prepared from blood cells (PBMC) as described [42]. The presence of SMX hypersensitivity was diagnosed by presence of at least two indicator adverse drug reactions, including skin rash, fever, pruritus, etc., that disappear after drug discontinuation [43].
DNA and RNA preparation
Preparation of genomic DNA, RNA and cDNA from tissues or cells was performed as described [42, 44]. To avoid genomic DNA contamination in tissue/cell RNA, samples were treated with DNase I. To avoid plasmid DNA contamination in RNA extracted from transfected cells, samples were treated with DNase I together with two restriction enzymes (DpnI and XbaI), to linearize plasmid DNA so that it can be degraded by DNase I. All samples were tested by real-time PCR, showing no amplification after 40 cycles in cDNA preparation without reverse transcriptase.
Genotyping
Twelve SNPs in NAT1 (Table 1a) and four SNPs in NAT2 (Table 1b) were genotyped in livers, B-lymphocytes or patient blood DNA samples with a single or multiplex SNaPshot assays. The nine base-pair deletion (rs72554666) was genotyped using PCR with fluorescently labeled primers, followed by ABI 3730 electrophoresis separation as described [4]. PCR conditions and primer sequences are provided in Supplemental Table 1.
Table 1a.
Polymorphisms genotyped in 125 livers and 96 B-lymphocytes.
| SNP# | Polymorphism ID | Position | MAF |
|---|---|---|---|
| 1 | rs4986988, *11 | Intron8 | 0.024 |
| 2 | rs4986989, *11 | Intron8 | 0.024 |
| 3 | rs4987076, *11, marker | Exon9, V149I | 0.024 |
| 4 | rs4986990, *11, marker | Exon9, T153T | 0.024 |
| 5 | rs4986783, *11, marker | Exon9, S214A | 0.024 |
| 6 | rs72554666, *11 | Exon 9, 3′UTR 3 copy TAA deletion |
0.024 |
| 7 | rs1057126, *10 | Exon 9, 3′UTR | 0.192 |
| 8 | rs15561, marker | Exon 9, 3′UTR | 0.239 |
| 9 | rs4986993, marker | Exon 9, 3′UTR | 0.239 |
| 10 | rs28359534, *11 | Downstream 3′UTR | 0.024 |
| 11 | rs8190862, *11 | Downstream 3′UTR | 0.024 |
| 12 | rs8190863, *11 | Downstream 3′UTR | 0.024 |
Table 1b.
Polymorphisms genotyped in 469 patient samples.
| Gene/SNPs | Position | MAF | HWE P value |
|---|---|---|---|
| NAT1 rs1057126, *10 | Exon 9, 3′UTR | 0.239 | 0.22 |
| NAT1 rs2554666, *11 | Exon 9, 3′UTR | 0.028 | 0.53 |
| NAT2 rs1801280, *5 | Exon 2, I114T | 0.364 | 0.85 |
| NAT2 rs1799930, *6 | Exon 2, R197Q | 0.278 | 0.47 |
| NAT2 rs1799931, *7 | Exon 2, G286E | 0.029 | 0.52 |
| NAT2 rs1801279, *14 | Exon 2, R64Q | 0.024 | 0.61 |
Quantitative analysis of NAT1 total mRNA, transcripts with different 3′UTR lengths or 5′UTR splice variants in human livers and B-lymphocytes
RNA extracts were converted with reverse transcriptase to cDNA using gene-specific primers and poly-dT. Levels of total mRNA and the various transcript isoforms were measured with quantitative real-time PCR using specific primers (Supplemental Table 1) and SYBR Green (Applied Biosystems), with GAPDH mRNA as an internal control as described [45]. The amplification of a single PCR product was verified by melting curve analysis. Relative amount of splice variants were also determined using PCR with fluorescently labeled primers (Supplemental Table 1) followed by ABI3730 separation as described [4].
Quantitative analysis of allelic mRNA ratios using SNaPshot
The detailed method has been published [44]. Briefly, a fragment of genomic DNA or cDNA (full or partial NAT1 cDNA NC_000008 or different 5′UTR splice variants, see Fig 1 for PCR primers) was PCR amplified, followed by a primer extension assays (SNaPshot) with 5 SNPs as markers (three coding region SNPs that are part of *11, and two frequent SNPs located in the 3′UTR) (Table 1a). Ten samples (6 livers and 4 B-lymphocytes) heterozygous for *11, and 50 livers and 33 B-lymphocytes heterozygous for the two 3′UTR SNPs (including ten *11 heterozygous samples) were selected for measuring allelic mRNA ratios. Genomic DNA allelic ratios at each SNP in the same individuals, normalized to 1, served as internal control. Deviations of allelic RNA ratios from 1 (after normalization to DNA ratios), i.e, allelic expression imbalance (AEI), indicates the presence of cis-acting regulatory polymorphisms. To detect the allelic RNA ratios in different splice variants, we PCR amplified splice variants using specific primers (Fig 1, Supplemental Table 1) followed by SNaPshot assays.
Quantitative analysis of allelic ratios of the major 3′UTR isoform using PCR with fluorescently labeled primer
A fragment of cDNA corresponding to the major 3′UTR isoform (sequence 77–315 bp’s after the stop codon and encompassing the second polyadenylation site (polyA2, Fig.1)) were PCR amplified with fluorescently labeled primer followed by ABI3730 electrophoresis, in *4/*11 heterozygous samples. Since *11 has a 9bp deletion, this yielded two distinct peaks corresponding to *4 and *11 that can be accurately quantitated. After normalization to gDNA ratios, the peak ratios (*4/*11) represent the relative amounts of major 3′UTR isoform derived from *4 and *11.
Regulation of translation measured with a 3′UTR reporter gene assay
The ability of NAT1 3′UTRs to support translation was tested in a luciferase reporter gene assay, with all three 3′UTR isoforms (short, major or long), each representing wild-type (*4), *10, and *11. We added a CMV promoter to the pGL3 basic vector (Promega) by excising the CMV promoter region (877bp) from pcDNA (Invitrogen) using BglII and HindIII digestion, then cloning it into pGL3 upstream of the fly luciferase gene (CMV-pGL3). To generate a CMV-pGL3 expression vector lacking a 3′UTR as negative control (‘no 3′UTR’), we removed the SV40 poly(A) signal sequence (262bp) in CMV-pGL3 using XbaI and BamHI digestion, followed by blunt-ending with DNA polymerase I large (Klenow) fragment and self-ligation. To generate CMV-pGL3 luciferase reporter vectors with three NAT1 3′UTR isoforms (all starting 44bp after the stop codon, short isoform P-short 242 bp, major isoform P-major 343 bp, and long isoform P-long 826 bp, based on sequence NT030737, Fig 4a), containing wild-type (*4) sequence, the *10 allele, or *11 allele, we PCR amplified the corresponding NAT1 3′-UTRs from gDNA of individuals with reference or variant alleles, and cloned these into CMV-pGL3 vector using XbaI and BamHI sites. All constructs were sequenced, showing the expected sequences. These plasmids were transfected into HepG2 and HEK293 cells. As transfection efficiency control, a Renilla luciferase construct driven by TK-promoter (Promega) was co-transfected with CMV-PGL3 fused constructs at a 1:3 ratio, and luciferase activities measured at 48hr post-transfection with Dual-Glo luciferase assays kit (Promega) on a fluorescence plate reader (PerkinElmer Life and Analytical Science, Waltham, MA). We also collected cells to prepare total RNA for NAT1 3′UTR and luciferase mRNA measurement at 48hr post-transfection. For each construct, three clones were selected for plasmid DNA preparation.
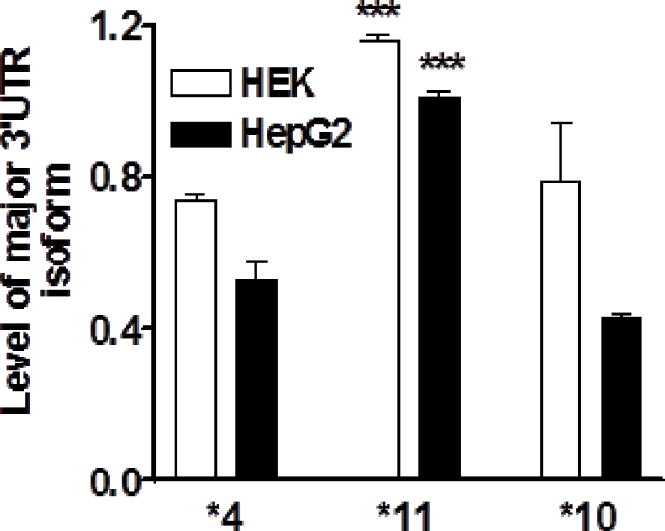
Figure 4.

Luciferase reporter gene assays of NAT1 3′UTR polyA site usage and translation efficiency. a. Protein translation efficiency of reporter gene plasmids containing the short, major or long 3′UTR isoforms after transfection into HepG2 (filled bar) and HEK cells (blank bar). Luciferase activities were measured 48 hours after transfection. Protein translation efficiency was measured by the ratio of luciferase activity/luciferase mRNA level. *** compared to short isoform P-short, p<0.001, ANOVA with Dunnett post test. b. 3′UTR activities of reporter gene plasmids containing *4, *11 and *10 after transfection into HepG2 cells. 3′UTR activities were reflected by luciferase activities measured 48 hours after transfection. *** compared to P-short, p<0.001, ### compared to *4, p<0.001, ANOVA with Dunnett post test.
Testing allelic differences in mRNA expression in vitro: co-transfection of NAT1 cDNA *4 and *11 constructs
Full length (1438bp) NAT1 cDNA (major 3′UTR isoform, NM_000662) containing exon 4-exon 8-exon 9, representing the reference *4 allele, or the *11 allele, were PCR amplified from liver cDNA and cloned into pcDNA3 using BamHI and XhoI sites. The expected DNA constructs were confirmed by sequencing. We selected three clones of each construct for DNA preparation. The same amounts of *4 and *11 cDNA were co-transfected into HepG2 or HEK293 cells, and cells were harvested 48hr post-transfection for plasmid DNA and RNA preparation. Allelic DNA and RNA ratios were measured as described above. We also harvested HEK cells 48 hr post-transfection for NAT1 enzyme activity measurement.
Cell culture and transfection
Cells were cultured at 37°C in humidified air at 5% CO2 in DMEM (HepG2) or DMEM/F12 (HEK293) or 1640 medium (B-lymphocytes), supplemented with 10% fetal bovine serum, 100 U/ml penicillin and 100 μg/ml streptomycin. The day before transfection, cells were plated into 12-well plates. Transfection was performed using lipofectamine 2000 according to the manufacture’s protocol (Invitrogen life technologies, Carlsbad, CA, USA).
NAT1 enzymatic activity assay
NAT1 enzymatic activity in B-lymphocytes and HEK293 cell cytosols was measured using p-aminobenzoic acid (PABA) as substrate [46]. Briefly, 3 million cells in 0.8 ml lysis buffer [20 mM Tris-HCl, pH7.5, 1 mM EDTA, 0.1% Triton X-100, 1 mM phenylmethanesulfonyl fluoride (PMSF), 1 mM benzamidine, 1.4 μM pepstatin A, 2 μM leupeptin] were disrupted at 4°C by sonication using sonic dismembrator model 100 (Fisher Scientific) (5 × 5sec bursts at setting of 2). Cell lysates were centrifuged at 13 000 rpm for 15 min. Fifty microliter supernatant was incubated with 200 μM PABA and 400 μM AcCoA in a total volume of 100 μl at 37°C for 10 min. The reaction was stopped by adding 100 μl cold trichloroacetic acid (20% w/v). After centrifugation at 12 000 g for 5 min, supernatant was added to 800 μl 4-dimethylaminobenzaldehyde (5% w/v in 9:1 acetonitrile/water). To determine the Km of NAT1 toward PABA in cytosol from transfected HEK cells, different concentration of PABA (from 20 to 500 μM) were incubated with 400 μM AcCoA and 10 μg cytosol for 10 min at 37°C. PABA was quantitated by subtracting the absorbance at 450 nM in experimental samples from the control, containing no AcCoA. The concentration of PABA was calculated from a standard curve with serials dilutions (0.3 to 40 μM). All assays were performed in triplicates.
Quantitation of NAT1 protein level in human livers
Liver tissues (~50 mg) with different genotypes were homogenized in 150 μl RIPA buffer (20 mM Tris-HCl, pH 7.5, 150 mM NaCl, 1mM EDTA, 1mM EGTA, 1% NP40, 0.5% sodium deoxycholate, 0.1% SDS and protease inhibitors cocktail) using sonic dismembrator (model 100, Fisher Scientific, 5 × 10sec bursts at setting of 2), followed by centrifugation at 20,000 g for 30 min at 4°C. The supernatants were stored at −80°C. Protein concentration was measured using Bio-Rad protein assay kit (Bio-Rad). Two hundred microgram protein was dissolved in 10% SDS-PAGE gel. Then proteins were transferred to PVDF membrane and blotted with anti-NAT1 antibody (1:200) (Santa Cruz NAT-1/2 (C-16), sc-47219, specific for human NAT1 and rat/mouse NAT2, 1:200 dilution), and then horseradish peroxidase-conjugated anti-goat secondary antibody (1:8000). Bands were visualized using ECL detection system and quantitated using Image J (http://rsb.info.nih.gov). Membranes were stripped with 2M glycine (pH 2.2) buffer for 30 min, and re-probed with GAPDH antibody. Relative NAT1 immunoreactivity was determined by the ratio of NAT1 intensity over GAPDH intensity. Quantitative measurements were separately performed on 24 livers (6 from each genotype group). The Western blot image shown in Figure 5a was from pooled samples each with an identical genotypes.
Figure 5.

NAT1 protein level/enzyme activity and NAT1 genotype. a. NAT1 protein levels in livers measured by Western blot. NAT1 immunoreactivities were quantitated in livers with different NAT1 genotypes, using GAPDH as internal control. * p<0.05 compared to *4/*4, ANOVA with Dunnett post test. Western blots were run for each sample separately, and quantitative data are shown in bar graph form. Upper panel shows a Western blot image of pooled samples. Same protein amounts from each liver in the same group were pooled and analyzed by Western blot. As control, Western blots were also run for cell lysates from NAT1 or NAT2 transfected cells. The antibody can only detect NAT1 but not NAT2. b. NAT1 enzyme activities in B-lymphocytes grouped by NAT1 genotypes. NAT1 enzyme activities in cell cytosol were measured using PABA as substrate. *Compared to *4/*4, p<0.001, ANOVA with Dunnett post test.
Data analysis
Data are expressed as means ± SD. Statistical analysis of gene expression, 3′UTR activity, enzyme activity, and allelic RNA ratio was performed using Prism (GraphPad Software, San Diego, CA). Association between genotype and AEI status was analyzed using Helix-Tree software (Golden Helix, Bosman MT). The association between genotype and SMX-induced hypersensitivity was analyzed with a logistics regression model performed using SAS 9.1 software. The suitability of model fitting was judged by deviance goodness-of-fit statistics P-value and score test P-value, both of which should exceed 0.05. Data are mean ± SD.
Results
(1) Expression of NAT1 mRNA transcript isoforms in livers and B-lymphocytes
NAT1 consists of a single coding exon (exon 9), and 8 exons upstream with three possible promoters, producing several tissue-specific 5′UTR splice variants [3, 7] (Fig 1). NAT1 transcripts were categorized into three isoforms [7]: type I, driven by a promoter upstream of exon 1(P1); type II, driven by a promoter upstream of exon 4 (P2) and type III (P3), driven by a promoter upstream of exon 9 (Fig 1). We first measured total NAT1 mRNA levels in 65 livers and 96 B-lymphocytes using primers targeting the coding region common to all NAT1 isoforms (Supplemental Table1). The average NAT1 mRNA level in livers exceeded that of B-lymphocytes threefold, with relative expression levels of 305 ± 178 and 94 ± 146 (arbitrary unit), respectively. Inter-person variability was greater than tenfold in both livers and B-lymphocytes (range 68 ~767 for liver and 10 ~ 835 for B-lymphocytes).
We then separately measured type I – III transcripts with different transcription start sites (P1–P3), using PCR with fluorescently labeled primers (Supplemental Table 1). All three types of transcripts were detectable in livers, with relative levels of 17 ± 9, 14 ± 12 and 11 ± 5 (arbitrary unit) for type I, type II and type III, respectively, and inter-person variability similar to that of total mRNA (>tenfold). In contrast, B-lymphocytes mainly expressed type II transcript, and type I transcripts were undetectable. Because different type II isoforms (Fig. 1) have been reported to display different protein translation efficiency [3], we also determined the relative levels of type II splice variants (type IIA-D) in B-lymphocytes using real-time PCR with specific primers (Supplemental Table 1). While the minor splice variants (type IIB-D) differed considerably between subjects, the type IIA splice isoforms predominated in all individuals (87 ± 3% of total type II transcript). Therefore, differences in type II splice variants do not appear to be a major factor for the variability in NAT1 enzyme activity in B-lymphocytes. Variability of transcript isoforms in other tissues needs to be further investigated.
Lastly, we considered NAT1 3′UTR transcripts arising from use of different polyA sites. Two consensus polyA signals in the NAT1 3′UTR, polyA1, polyA2 have been reported [7], with the predominant polyA2 site yielding a 3′UTR length of 392 bp after the stop codon (major 3′UTR isoform, Fig 1). Using polyA site prediction software PolyA_SVM [47, 48] (http://exon.umdnj.edu/polya_SVM/), we found a third consensus polyA signal site 397bp downstream of the polyA2 signal site. Consistent with this, a long 3′UTR isoform with a length of 546bp downstream of the stop codon was detectable in both human livers and B-lymphocytes. To estimate relative amount of three 3′UTR isoforms in livers, we used PCR with fluorescently labeled primers. We estimate the relative mean abundance of short, major and long 3′UTR isoform to be approximately 30, 60 and 10%, respectively. The distribution of the NAT1 3′UTR isoforms did not differ substantially between livers and B-lymphocytes, indicating similar RNA processing mechanisms in both tissues.
(2) Genotype associations with mRNA transcripts
Six SNPs (SNP 1–6) corresponding to *11 and one to *10 (SNP 7) were genotyped in the livers and B-lymphocytes (Table 1a). Allele frequencies were 19% for *10 and 2.4% for *11. Total NAT1 mRNA did not significantly differ between reference allele *4, *10 and *11 genotypes (P>0.05). Similarly, *11 and *10, were not associated with levels of type I – III isoforms in livers, nor type II splice variants in B-lymphocytes (P>0.05). Relative levels of the major 3′UTR isoform tended to be higher in the *4/*11 group than in *4/*4 group (24 ± 7 versus 16 ± 7, p=0.36), but this did not reach statistical significance. Nevertheless we suspected a role of *11 in polyA site usage on the basis of bioinformatics analyses.
For full characterization of the *11 haplotype, the entire NAT1 exon 9 including 450bp upstream and downstream of exon 9 was sequenced in two *11 heterozygous liver samples (L59 and L63), confirming the known variants representing haplotype *11[49] (Table 1a). Three additional SNPs (rs28359534, rs8190862 and rs8190863) in complete LD with *11 were identified in the long 3′UTR isoform, downstream of polyA2 site (Table 1a, SNP10–SNP12). With the long 3′UTR isoforms of *4, *10 and *11 as input sequence, the PolyA_SVM algorithm predicted that *11 reduce the usage of polyA1 signal site compared to *4 (scores for *4 and *11 were 1.463 and 0.869, respectively), while *10 have no effect. This result suggested that *11 inhibit the usage of polyA1 site and increase formation of the major 3′UTR isoform (and the less abundant long isoform). However, when using a truncated 3′UTR without sequence downstream of polyA2 site as input sequence, no differences in polyA site usage were computed between *4 and *11, predicting DNA sequence downstream of polyA2 site including three newly identified SNPs may be required for preferentially selection of polyA2 sites by *11. To test this experimentally, we developed a series of allele-specific mRNA transcript assays.
(3) NAT1 *11 increases the amount of mRNA with major 3′UTR isoform
Allelic ratios of mRNA transcripts are more sensitive measures of regulatory variants than overall levels [26–29, 45, 50]. To test whether *11 increased levels of mRNA with the major 3′UTR isoform, we measured allelic RNA ratios in 10 heterozygous *4/*11 samples (6 livers and 4 B-lymphocytes) using three coding region SNPs as markers (Table 1a), in a primer extension (SNaPshot) assay. Full-length NAT1 cDNA with extended 3′UTR isoforms (mostly the major isoform plus 10% long 3′UTR isoform) was selectively amplified using primers F1/R1 (Fig.1). Shown in Fig 2a, all 10 samples showed allelic RNA ratios of ~0.5, with *11 displaying a ~twofold higher level of NAT1 mRNA with major 3′UTR isoform compared to *4. This result was duplicated using PCR amplification of the major 3′UTR isoform with fluorescently labeled primers and capillary electrophoresis, exploiting the *11 9bp deletion in the 3′UTR as marker (Fig 2b). These results demonstrate that *11 reduces usage of polA site 1, thereby increasing formation of the extended 3′UTR isoforms relying on polyA site 2 usage, and to a small extent site3 usage, in both livers and B-lymphocytes, consistent with polyA_SVM predictions.
Figure 2.

Allelic expression ratios of NAT1 mRNA in human livers (labeled ‘L’) and B-lymphocytes (‘C’) heterozygous for *11/*4. a. Allelic mRNA ratios were measured with three coding region SNPs as markers (rs4987076, rs4986990 and rs4986783 in exon 9), after PCR amplification of full-length of NAT1 cDNA using F1/R1 primers, capturing major 3′UTR isoform (see Fig. 1). b. Allelic mRNA ratios of major 3′UTR isoform in the same tissues using PCR with fluorescently labeled primers, taking advantage of 9 bp deletion in *11 (rs72554666). RNA ratios were normalized to genomic DNA ratios, which were set at 1. The ratios for all samples were significantly different from genomic DNA ratios; p<0.001, ANOVA with Dunnett post test.
In contrast, allelic RNA ratio analysis after PCR with primers that capture all transcripts (partial cDNA without 3′UTR, primers F2/R2, Fig 1) failed to show allelic RNA ratios deviating from 1 in any of the same 10 tissues heterozygous for *11 ( Supplemental Fig 1). This result demonstrates that *11 does not alter total mRNA levels, but rather specifically the formation of the major 3′UTR isoform, leaving overall levels unaffected.
(4) Full-length 3′UTR of *11 enhances translation in a luciferase reporter gene assay via formation of the major 3′UTR isoform
As the *11 allele had been suspected to increase enzyme activity in association studies [19] but overall NAT1 transcript levels remained unchanged, we tested whether the major 3′UTR isoform supports more efficient translation than the short isoform. First, we determined whether a NAT1 3′UTR-luciferase reporter gene assay reproduces polyA site usage as a function of genotype. Luciferase reporter gene constructs containing full-length NAT1 3′UTR (P-long with all three polyA sites, see Fig 4a), representing *11 or *4, were transfected into HEK293 or HepG2 cells. After 48 hours, the relative mRNA levels of the major 3′UTR isoforms were determined using PCR with fluorescently labeled primers, normalized to total luciferase mRNA. To avoid amplifying endogenous NAT1 mRNA, the forward primer was targeted to the luciferase coding region. Haplotype *11 with full length 3′UTR (P-long construct) produced significantly higher levels of the major 3′UTR isoform than *4 in both HEK and HepG2 cells (Fig 3), consistent with results from livers and B-lymphocytes (Fig 2).
Figure 3.
mRNA level of major 3′UTR isoform after transfection of reporter gene plasmid containing full-length of NAT1 3′UTR (P-long construct), corresponding to *4, *11 and *10. For each variant, formation of the major NAT1 3′UTR isoform was measured in HEK293 and HepG2 cells. *** compared to *4, *** p<0.001, ANOVA with Dunnett post test.
To test whether the 3′UTR isoforms have different protein translation efficiency, we fused the short, major, and long 3′UTR isoforms of NAT1 separately to pGL3 vector, downstream of the luciferase gene, after removal of SV40 3′UTR from the pGL3 vector (Fig 4a). Whereas luciferase activity was barely detectable without any 3′UTR sequence, the NAT1 short 3′UTR isoform rescued luciferase activity to 50% of positive control (SV40 3′UTR). However, luciferase activities of the major and long 3′UTR isoforms were nearly twofold greater than that of the short isoform (Fig 4a). This result indicates that the short 3′UTR isoform derived from polyA1 has reduced translational activity compared to the other two isoforms. In contrast, there was no difference in luciferase activities between P-major and P-long 3′UTR constructs, indicating the major isoform contains the requisite regulatory 3′UTR elements. Moreover, *11 yielded higher luciferase activity than *4, but this was observed only when the long 3′UTR isoform (P-long) was transfected (Fig 4b). This result further supports the finding that the entire long 3′UTR *11 haplotype, including the three newly identified 3′UTR SNPs, is required for enhanced production of the major 3′UTR isoform, consistent with PolyA_SVM prediction.
(5) Polymorphisms of *11 upstream of coding exon 9 do not affect mRNA transcription site usage nor 5′UTR splicing
Two SNPs (rs4986988, rs4986989) in *11 located upstream of exon 9 could have affected formation of type I–III transcripts arising from different promoters, or 5′UTR processing/splicing. Because B-lymphocytes did not express the type I transcript, and both liver and B-lymphocytes displayed similar allelic expression imbalance patterns in *11 heterozygous samples, polymorphisms that regulate type I transcription can be ruled out. Since type II and type III transcripts are driven by different promoters ~12kb apart, any upstream *11 polymorphisms (e.g., rs4986988, rs4986989) should have affected transcription for either type II or type III, but not both. Therefore, we specifically PCR amplified type II (primers IIF/R1) or type III (primers IIIF/R1) (Fig. 1) transcripts tethered to the major 3′UTR isoform (Fig. 1) in all 10 AEI positive samples (6 livers and 4 B-lymphocytes). Allelic RNA ratios were again ~ 0.5 for both type II and type III transcripts (Supplemental Figure 2), arguing against any selective effect of upstream *11 polymorphisms on NAT1 transcript isoforms.
(6) Coding region SNPs of *11 do not alter NAT1 mRNA levels nor expressed enzyme activity
We next tested whether the *11 haplotype affects NAT1 expression after mature mRNA has been generated, for example by affecting mRNA processing or stability, as reported for OPRM1 and ABCB1 [3, 50]. We compared mRNA levels after co-transfection in equal amounts of *4 and *11 cDNA expression vectors (full-length exon 9 cDNA with major 3′UTR isoforms). Allelic RNA ratios were measured using all 5 *11 SNPs located in the coding region and 3′UTR (upstream of polyA2) as markers (Table 1a). No significant AEI was detectable in both HepG2 and HEK293 cells, indicating that none of the *11 SNPs, including those in the coding region, affect mRNA levels.
To test whether the two non-synonymous SNPs (rs4987076 and rs4986783) in *11 change enzyme activity via changing protein sequence, we compared NAT1 acetylation activity in HEK293 cell cytosol after transfections with *4 and *11 expression plasmids. N-acetyl transferase activity was determined colorimetrically with PABA as substrate [46]. HEK293 cells endogenously express NAT1 activity of 6.9 nmol PABA/min/mg protein. After NAT1 cDNA transfection, NAT1 activity increased 12 fold. There was no significant difference in Km and Vmax of the NAT1 enzyme between *11 and *4 transfections. The Km values were 52 μM (95% CL 37 ~ 67) and 61 μM (95% CL 35 ~ 87) for *4 and *11 respectively. Vmax values were 104 nmol/min/mg protein (95% CL 94 ~ 114) and 128 nmol/min/mg protein (95% CL 104 ~ 154) for *4 and *11 respectively (P > 0.05). This result indicates that the two non-synonymous *11 SNPs did not affect enzyme activity, and NAT1 *11 cDNA lacking full-length 3′UTR sequence did not change NAT1 protein expression, consistent with a previous report [13].
(7) Searching for additional cis-acting regulatory polymorphisms by allelic expression imbalance (AEI)
We measured AEI with two frequent marker SNPs, rs15661 and rs4986993, located in the 3′UTR but not unique to *11, after PCR amplification of full-length of NAT1 cDNA with the major 3′UTR isoform (primers F1/R1, Fig 1). Of 50 livers and 33 B-lymphocytes heterozygous for these two SNPs, 10 samples (6 livers and 4 B-lymphocytes) showed allelic RNA ratios (major/minor allele) of ~0.5, after normalizing to DNA ratios (Supplemental Fig 3). However, all 10 samples were previously found to be also heterozygous for *11, displaying identical AEI ratios when using thee unrelated coding region SNPs as markers (Fig 2a). This experiment therefore failed to reveal any additional regulatory NAT1 polymorphisms.
(8) NAT1 *10 allele enhances translation into functional enzyme without affecting mRNA levels
The single *10 SNP (rs1057126) resides in the 3′UTR upstream of the polyA1 site; therefore, *10 is present in all three 3′UTR isoforms. *10 did not change total NAT1 mRNA levels in livers and B-lymphocytes (P>0.05), and heterozygous *4/*10 tissues did not display AEI (Supplemental Figure 4), indicating *10 does not affect mRNA levels. Moreover, the relative formation of short and major 3′UTR isoforms did not differ between *4 and *10 transfections (using long 3′UTR constructs) (Fig 3), consistent with PolyA_SVM predictions showing no difference in polyA site scores. However, 3′UTR luciferase reporter gene assays demonstrated that *10 is associated with higher luciferase activity compared to *4 (Fig 4b), without affecting luciferase mRNA levels. Increased luciferase activity was observed regardless of 3′UTR length (short, major, long). This results indicates that *10 increases protein translation efficiency via a yet unknown mechanisms.
(9) NAT1 protein levels of *4, *11 and *10 in livers or B-lymphocytes
We next tested whether *11 and *10 affect NAT1 protein expression using Western blot in livers and by measuring NAT1 enzyme activity in B-lymphocytes. We selected all liver samples heterozygous for *11/*4, homozygous for *10/*10, and matched with samples homozygous for *4/*4 or heterozygous for *10/*4 by mRNA expression level (average mRNA levels in livers for *4/*4, *4/*10, *10/*10 and *4/*11 were 332 ± 72, 378 ± 78, 342 ± 80 and 359 ± 94, respectively). Western blot analysis showed *11/*4 and *10/*10 have higher NAT1 immunoreactivity than *4/*4 (Figure 5a). To ensure the detected bands correspond to NAT1 but not NAT2, which is also expressed in liver, we tested specificity of the NAT1 antibody using NAT1 and NAT2 transfected HEK cell lysates. The NAT1 antibody used in this study only detected NAT1 but not NAT2 (Figure 5a).
NAT1 expression in B-lymphocytes was found to be too low for accurate quantitation NAT1 protein levels by Western blot. Because *10 did not change NAT1 protein structure, and the coding region SNP in *11 did not change Km toward PABA, any changes in the rate of NAT1 enzymatic activity likely result from changes in NAT1 protein levels. Therefore, we used single point measurement of the substrate PABA to estimate the NAT1 protein levels as function of genotype. At the PABA concentrations used, NAT1 enzyme activity was linear for at least 20 min. Therefore, we selected incubation times of 10 min for single point activity measurement. B-lymphocytes with *11/*4 and *10/*10 genotypes have higher N-acetyltransferase activity compared to *4/*4 genotype (Figure 5b) (average mRNA levels in B-lymphocytes for *4/*4, *4/*10, *10/*10 and *4/*11 were 92 ± 50, 89 ± 45, 94 ± 50 and 99 ± 49, respectively). This result indicates *11 and *10 increase NAT1 protein expression, consistent with the result from livers. On the other hand, *10/*4 heterozygous carriers did not differ detectably from *4/*4 carriers (Figure 5). Therefore, each *11 allele alone matched the *10/*10 genotype activity effect. Because of low frequency, *11/*11 homozygous carriers were absent in the available tissues.
(10) Association between NAT1 and NAT2 genotype and sulfamethoxazole (SMX)-induced hypersensitivity in HIV/AIDS patients
We tested the association of NAT1 *10 and *11 with SMX induced hypersensitivity in 469 HIV/AIDS patients (149 with and 320 without hypersensitivity). Baseline characteristics between patients with or without hypersensitivity did not differ (Supplemental Table 2). Since SMX is also metabolized by NAT2, previously shown to be associated with SMX-induced hypersensitivity in non-HIV/AIDS individuals [10, 11], we also genotyped known functional NAT2 polymorphisms. Two SNPs corresponding to NAT1*10 (rs1057126) and *11(rs72554666), and four SNPs corresponding to NAT2 *5 (rs1801280), *6 (rs1799930), *7 (rs1799931) and *14 (rs1801279) (Table 1b) were genotyped. The distribution of all SNPs followed Hardy-Weinberg equilibrium (Table 1b). Single SNP analysis showed none of these SNPs were significantly associated with SMX hypersensitivity (Supplemental Table 3), consistent with previous reports in HIV/AIDS patients [36, 40]. We therefore tested the interaction between NAT1 and NAT2, categorizing individuals by genotype and acetylator phenotype as follows.
Because the known functional SNPs in NAT2 all reduce enzyme activity, an individual’s NAT2 activity depends on the combination of different SNPs on one or both alleles. Since the four NAT2 SNPs tested are in low linkage disequilibrium (LD r between *5 and *6 is 0.46601, LD r between any other NAT2 SNP pairs is less than 0.13), two different SNPs present in an individual carrier are more likely to be on different alleles (compound heterozygotes). Therefore, individuals who carry two or more NAT2 SNP alleles are categorized as slow metabolizers (loss of function for both alleles), while carriers of one SNP are intermediate metabolizers, and those with two reference alleles (*4) are reference metabolizers (Table 2). For NAT1, individuals homozygous for allele *4 are categorized as reference metabolizers, while those homozygous for *10 are fast metabolizers, and *10 heterozygous are intermediate. Because NAT1 *11 heterozygotes already showed increased protein level or enzyme activity in this study (Fig 5), all NAT1*11 carriers (*11/*4 and *11/*10) were designated as fast metabolizers (Table 2).
Table 2.
Association between NAT1 and NAT2 genotypes and SMX-induced hypersensitivity.
| Gene | Genotype | Predicted phenotype | Count (%) | Odds ratio (95%CL) | P value | |
|---|---|---|---|---|---|---|
| Case | Control | |||||
| NAT1 | *4/*4 (reference) | Reference | 80 (54%) | 173 (54%) | 1 | |
| *10/*4 | Intermediate | 49 (33%) | 110 (34%) | 1.169 (0.638–2.141) | 0.864 | |
| *10/*10, *11/*4, (*11/*11)a | Fast | 20 (13%) | 37 (12%) | 0.963 (0.628–1.478) | 0.613 | |
| NAT2 | *4/*4 (reference) | Reference | 10 (7%) | 28 (8%) | 1 | |
| *5/*4, *6/*4, *7/*4, *14/*4 | Intermediate | 68 (46%) | 140 (44%) | 1.360 (0.625–2.961) | 0.438 | |
| *5/*5, *6/*6, *5/*6, *5/*7, *5/*14, *6/*7, *6/*14 | Slow | 71 (47%) | 152 (48%) | 1.308 (0.602–2.839) | 0.497 | |
| NAT1+ NAT2 | NAT2 slow | NAT1 slow + intermediate | 67 (96%) | 132 (86%) | 1 | |
| NAT1 fast | 3 (4%) | 21 (14%) | 0.282 (0.081–0.978) | 0.046 | ||
| NAT2 reference + intermediate | NAT1 slow + intermediate | 67 (85%) | 150 (90%) | 1 | ||
| NAT1 fast | 12 (15%) | 17 (10%) | 1.580 (0.715–3.493) | 0.258 | ||
Not found in the present study, projected to be ultra-fast.
In contrast to a lack of association between SMX hypersensitivity and NAT1 and NAT2 separately (Supplemental Table 3, Table 2), when considering the joint effects of NAT1 and NAT2, a significant association emerged. Because of the high frequency of NAT2 loss-of-function polymorphisms, nearly 50% of patients were considered NAT2 slow acetylators (Table 2). In this genetic background, the proportion of patients with SMX hypersensitivity was 3 times less frequent in patients who were NAT1 fast acetylators compared to NAT1 slow and intermediate acetylators (Table 2), with an odds ratio of 0.28 (95% CL 0.081 – 0.978, p=0.046). Although requiring replication in an independent cohort, this result indicates that NAT1 *11 and *10 protect against the development of SMX-induced hypersensitivity in HIV/AIDS patients who are defective in NAT2 activity, consistent with a gain-of-function of NAT1 *10 and *11.
Discussion
The results of this study demonstrate that two NAT1 variants, *11 and *10, account for most of the observed genetic influence on NAT1 protein expression. Both *10 and *11 represent gain of function polymorphisms, leading to increased protein level or enzyme activity in livers and B-lymphocytes, thereby resolving previous contradictory results [23–25] . While *11 was shown to direct preferential polyA2 site usage, yielding more of the major 3′UTR isoforms endowed with higher translation efficiency, the regulation of *10 involves increased protein translation efficiency without affecting mRNA levels or processing. Moreover, the association between NAT1 *10 and *11 and SMX-induced hypersensitivity in HIV/AIDS patients further demonstrates the gain-of-function of NAT1 *10 and *11. With these results, we classify *4/*4 carriers as reference acetylators, *4/*10 carriers as intermediate acetylators, and *10/*10 and *11 carriers as fast acetylators, reflecting the stronger increase of protein level or enzyme activity caused by *11 compared to *10 (Table 2). Homozygous *11/*11 carriers could be considered ultra-fast metabolizers but are rare (≪1%).
NAT1 *11 and *10 have been implicated as risk alleles in several clinical association studies [12, 13, 19, 20], mostly being referred to as fast acetylator alleles [15, 16, 19, 20], while the biological mechanisms remained uncertain. Our finding that *11 increases NAT1 protein level/enzyme activity involving switching of polyA site usage was supported by both in vivo and in vitro results: (1) Allelic mRNA analysis, in vitro NAT1 expression, and 3′UTR reporter gene assays demonstrate that *11 yields higher levels of the major 3′UTR NAT1 isoform . (2) The major 3′UTR isoform displayed higher protein translation efficiency than the short isoform. (3) NAT1 immunoreactivity and enzyme activity is higher in *11 than *4 liver or B-lymphocytes. Consistent with this, *11 had been associated with higher enzyme activity in previous association studies [12, 19, 20] and in this study.
mRNA polyadenylation is a cellular process that adds polyA tails to the vast majority of maturing mRNAs, affecting mRNA stability, translation, and transport [52–54]. mRNA polyadenylation starts with an endonucleolytic cleavage at a site determined by the surrounding RNA sequence (cis-elements) and their binding proteins (trans factors). PolyA addition is determined by a polyadenylation signal, AAUAAA or a close variant located 10–35 bp upstream of the cleavage site, acting in concert with auxiliary upstream and downstream elements [48]. The switch from polyA site 1 to polyA site 2 usage in *11, observed in both liver and B-lymphocytes, appears to be determined by the 9bp deletion located near the polyA1 site, as well as DNA sequence downstream of the polyA2 site, including three SNPs (rs28359534, rs8190862 and rs8190863) in complete LD with *11, but not previously included with this haplotype. This potential long-range conformational folding effect was suggested by 3′UTR reporter gene results showing that only the reporter gene constructs carrying the long 3′UTR isoform resulted in greater luciferase activity for *11 than *4, whereas reporter genes with short and major 3′UTRs showed no difference between *11 and *4 (Fig 4b). Moreover, NAT1 expression of cDNA lacking sequence downstream of polyA2 site failed to show difference in NAT1 mRNA expression and enzyme activity between *4 and *11. All three NAT1 3′UTR isoforms appear to have similar turn-over rates, because allelic expression imbalance was undetectable after PCR amplification of total NAT1 mRNA encompassing all isoforms. Therefore, *11 selectively increased usage of the polyA2 site resulting in increased levels of the major 3′UTR isoform, and hence increased protein translation. Taken together, the *11 allele causes a robust gain-of-function.
Coding region SNPs can directly affect protein sequence and function (nonsynonymous), or mRNA processing and translation (synonymous and non-synonymous), as we had reported previously [45, 50]. The results in the present study indicate that three coding region SNPs present in *11 did not change mRNA expression nor protein level/protein activity. This result is consistent with two previous reports [13, 23], but inconsistent with others [24, 25]. Because regulation of *11 involves switching of polyA site usage, changes in NAT1 activity of *11 cannot be observed after transfection of coding region sequence lacking the full length 3′UTR. However, we cannot rule out the possibility that the non-synonymous coding region SNPs in *11 change NAT1 activity for some substrates [24], other than PABA used in the present study. Also, we cannot exclude the possibility that the non-synonymous SNP embedded in *11 affects enzymatic activity with respect to SMX, as the enzyme activity was measured here with PABA as a substrate. Thus far, there is no clear evidence in the literature that *11 affects substrate selectivity, but more detailed studies should be carried out to address this possibility.
Our results also differ from a previous report showing lower or unchanged of NAT1 enzyme activity of *11 and *10 in whole blood lysates [22]. While regulatory polymorphisms could be tissue specific as we have demonstrated for VKORC1 and CYP3A4 [26, 27], our results suggest the regulation of NAT1 *10 and *11 are similar in livers and B-lymphocytes. However, we cannot rule out different regulation of other cells in whole blood. Moreover, since NAT1 displayed a wide range of inter-person variability in total mRNA expression (>10 fold) in B lymphocytes and livers independent of cis-acting polymorphisms, other factors, for example, epigenetic regulation or trans-acting factors may mask or even override the effects from cis-acting polymorphisms. It is further important to note that the most abundant heterozygous carriers of *10 are not expected to show a pronounced change in NAT1 activity, as demonstrated here.
Two possible mechanisms had been advanced previously underlying NAT1 *10 regulation: (1) altered consensus polyadenylation signal (AATAAA to AAAAAA) leading to changes in polyadenylation, and enhanced mRNA stability [7]; (2) interaction of an RNA-binding protein with NAT1 mRNA, thereby increasing NAT1 mRNA stability[55]. Both of these two possible mechanisms would have resulted in increased NAT1 mRNA levels associated with *10, and therefore, in detectable allelic expression imbalance. However, the present results demonstrate that *10 did not yield changes in mRNA levels (Supplemental Figure 4), nor did it change the usage of polyA sites (Fig 3). In contrast, 3′UTR reporter gene assays indicate that NAT1 *10 increases protein translation efficiency (Fig 4b). The mechanism underlying this regulation remains unclear. Since *10 resides close to a microRNA target site, it is possible that microRNAs may be involved in *10 regulation, requiring further investigation.
We also have observed differences in tissue-selective expression of 5′UTR splice variants, and inter-individual variability in type II 5′UTR splice variants in B-lymphocytes. Since 5′UTR variants can affect protein translation efficiency [3] , the variation in 5′UTR splicing may impose another source of tissue-selective inter-individual variability in NAT1 enzyme activity. However, our result suggests that inter-person variability of type II transcripts was unrelated to genetic factors, and clearly independent of *10 and *11.
While the main focus of this study was on molecular genetics of NAT1 *10 and *11, we also explored the in vivo impact of *10 and *11 on SMX metabolism/inactivation. N-acetylation mediated by NAT1 and NAT2 are the major inactivation pathway for SMX [32]. Because NAT1 has higher binding affinity and Vmax for SMX [33] and has broader tissue expression than NAT2, NAT1 may be the primary determinant of SMX clearance both systemically and in target tissues, such as skin and immune-responsive cells. However, the association between NAT1 polymorphisms and SMX-induced hypersensitivity had not been extensively studied, because the function of NAT1 *10 and *11 was previously uncertain, and NAT1 is often considered to be monomorphic. The molecular genetics results reported here led to the prediction that NAT1 *10 and *11 may be protective against SMX-induced hypersensitivity. In contrast to loss of function polymorphisms in NAT2, the effect of which appears to be confounded by reduced liver enzyme activity caused by HIV infection [40], gain of function polymorphisms could have a persistent effect even in HIV/AIDS subjects. Our result indicate for the first time that NAT1 fast acetylators (*10/*10 and *11 carriers) are protected against SMX-induced hypersensitivity in HIV/AIDS, but only in slow NAT2 metabolizer subjects. While this example is one of a few studies revealing a robust gene-gene interaction, our results require replication in an independent patient cohort.
In summary, we have identified *11 and *10 as functional alleles that increase NAT1 enzyme activity through increasing protein translation efficiency. Since NAT1 *11 and *10 have been associated with various cancers and with response to drugs and xenobiotics, understanding the molecular mechanisms will provide a solid foundation for clinical association studies and assist in the design of biomarkers for personalized medicine.
Supplementary Material
Acknowledgments
This study was supported by NIH grants R21 AI074399 (DW) and U01 GM092655 (WS).
Footnotes
Conflict of Interest Statement: Authors declared no conflict of interests in this study.
References
- 1.Sim E, Lack N, Wang CJ, et al. Arylamine N-acetyltransferases: structural and functional implications of polymorphisms. Toxicology. 2008;254:170–183. doi: 10.1016/j.tox.2008.08.022. [DOI] [PubMed] [Google Scholar]
- 2.Minchin RF, Hanna PE, Dupret JM, Wagner CR, Rodrigues-Lima F, Butcher NJ. Arylamine N-acetyltransferase I. Int J Biochem Cell Biol. 2007;39:1999–2005. doi: 10.1016/j.biocel.2006.12.006. [DOI] [PubMed] [Google Scholar]
- 3.Butcher NJ, Arulpragasam A, Goh HL, Davey T, Minchin RF. Genomic organization of human arylamine N-acetyltransferase Type I reveals alternative promoters that generate different 5′-UTR splice variants with altered translational activities. Biochem J. 2005;387:119–127. doi: 10.1042/BJ20040903. [DOI] [PMC free article] [PubMed] [Google Scholar]
- 4.Barker DF, Husain A, Neale JR, et al. Functional properties of an alternative, tissue-specific promoter for human arylamine N-acetyltransferase 1. Pharmacogenet Genomics. 2006;16:515–525. doi: 10.1097/01.fpc.0000215066.29342.26. [DOI] [PMC free article] [PubMed] [Google Scholar]
- 5.Husain A, Zhang X, Doll MA, States JC, Barker DF, Hein DW. Functional analysis of the human N-acetyltransferase 1 major promoter: quantitation of tissue expression and identification of critical sequence elements. Drug Metab Dispos. 2007;35:1649–1656. doi: 10.1124/dmd.107.016485. [DOI] [PMC free article] [PubMed] [Google Scholar]
- 6.Husain A, Barker DF, States JC, Doll MA, Hein DW. Identification of the major promoter and non-coding exons of the human arylamine N-acetyltransferase 1 gene (NAT1) Pharmacogenetics. 2004;14:397–406. doi: 10.1097/01.fpc.0000114755.08559.6e. [DOI] [PubMed] [Google Scholar]
- 7.Boukouvala S, Sim E. Structural analysis of the genes for human arylamine N-acetyltransferases and characterisation of alternative transcripts. Basic Clin Pharmacol Toxicol. 2005;96:343–351. doi: 10.1111/j.1742-7843.2005.pto_02.x. [DOI] [PubMed] [Google Scholar]
- 8.Huang YS, Chern HD, Su WJ, et al. Polymorphism of the N-acetyltransferase 2 gene as a susceptibility risk factor for antituberculosis drug-induced hepatitis. Hepatology. 2002;35:883–889. doi: 10.1053/jhep.2002.32102. [DOI] [PubMed] [Google Scholar]
- 9.Wolkenstein P, Carriere V, Charue D, et al. A slow acetylator genotype is a risk factor for sulphonamide-induced toxic epidermal necrolysis and Stevens-Johnson syndrome. Pharmacogenetics. 1995;5:255–258. doi: 10.1097/00008571-199508000-00011. [DOI] [PubMed] [Google Scholar]
- 10.Rieder MJ, Shear NH, Kanee A, Tang BK, Spielberg SP. Prominence of slow acetylator phenotype among patients with sulfonamide hypersensitivity reactions. Clin Pharmacol Ther. 1991;49:13–17. doi: 10.1038/clpt.1991.3. [DOI] [PubMed] [Google Scholar]
- 11.Zielinska E, Niewiarowski W, Bodalski J, et al. Genotyping of the arylamine N-acetyltransferase polymorphism in the prediction of idiosyncratic reactions to trimethoprim-sulfamethoxazole in infants. Pharm World Sci. 1998;20:123–130. doi: 10.1023/a:1008664707825. [DOI] [PubMed] [Google Scholar]
- 12.Lilla C, Verla-Tebit E, Risch A, et al. Effect of NAT1 and NAT2 genetic polymorphisms on colorectal cancer risk associated with exposure to tobacco smoke and meat consumption. Cancer Epidemiol Biomarkers Prev. 2006;15:99–107. doi: 10.1158/1055-9965.EPI-05-0618. [DOI] [PubMed] [Google Scholar]
- 13.Hein DW. Molecular genetics and function of NAT1 and NAT2: role in aromatic amine metabolism and carcinogenesis. Mutat Res. 2002;506–507:65–77. doi: 10.1016/s0027-5107(02)00153-7. [DOI] [PubMed] [Google Scholar]
- 14.Evans WE, Relling MV. Pharmacogenomics: translating functional genomics into rational therapeutics. Science. 1999;286:487–491. doi: 10.1126/science.286.5439.487. [DOI] [PubMed] [Google Scholar]
- 15.Bell DA, Badawi AF, Lang NP, Ilett KF, Kadlubar FF, Hirvonen A. Polymorphism in the N-acetyltransferase 1 (NAT1) polyadenylation signal: association of NAT1*10 allele with higher N-acetylation activity in bladder and colon tissue. Cancer Res. 1995;55:5226–5229. [PubMed] [Google Scholar]
- 16.Badawi AF, Hirvonen A, Bell DA, Lang NP, Kadlubar FF. Role of aromatic amine acetyltransferases, NAT1 and NAT2, in carcinogen-DNA adduct formation in the human urinary bladder. Cancer Res. 1995;55:5230–5237. [PubMed] [Google Scholar]
- 17.Lammer EJ, Shaw GM, Iovannisci DM, Finnell RH. Periconceptional multivitamin intake during early pregnancy, genetic variation of acetyl-N-transferase 1 (NAT1), and risk for orofacial clefts. Birth Defects Res A Clin Mol Teratol. 2004;70:846–852. doi: 10.1002/bdra.20081. [DOI] [PubMed] [Google Scholar]
- 18.Lammer EJ, Shaw GM, Iovannisci DM, Van Waes J, Finnell RH. Maternal smoking and the risk of orofacial clefts: Susceptibility with NAT1 and NAT2 polymorphisms. Epidemiology. 2004;15:150–156. doi: 10.1097/01.ede.0000112214.33432.cc. [DOI] [PubMed] [Google Scholar]
- 19.Jiao L, Doll MA, Hein DW, et al. Haplotype of N-acetyltransferase 1 and 2 and risk of pancreatic cancer. Cancer Epidemiol Biomarkers Prev. 2007;16:2379–2386. doi: 10.1158/1055-9965.EPI-06-0992. [DOI] [PMC free article] [PubMed] [Google Scholar]
- 20.Li D, Jiao L, Li Y, et al. Polymorphisms of cytochrome P4501A2 and N-acetyltransferase genes, smoking, and risk of pancreatic cancer. Carcinogenesis. 2006;27:103–111. doi: 10.1093/carcin/bgi171. [DOI] [PMC free article] [PubMed] [Google Scholar]
- 21.Dai Y, Leng S, Li L, et al. Effects of genetic polymorphisms of N-Acetyltransferase on trichloroethylene-induced hypersensitivity dermatitis among exposed workers. Ind Health. 2009;47:479–486. doi: 10.2486/indhealth.47.479. [DOI] [PubMed] [Google Scholar]
- 22.Bruhn C, Brockmoller J, Cascorbi I, Roots I, Borchert HH. Correlation between genotype and phenotype of the human arylamine N-acetyltransferase type 1 (NAT1) Biochem Pharmacol. 1999;58:1759–1764. doi: 10.1016/s0006-2952(99)00269-5. [DOI] [PubMed] [Google Scholar]
- 23.de Leon JH, Vatsis KP, Weber WW. Characterization of naturally occurring and recombinant human N-acetyltransferase variants encoded by NAT1. Mol Pharmacol. 2000;58:288–299. doi: 10.1124/mol.58.2.288. [DOI] [PubMed] [Google Scholar]
- 24.Doll MA, Jiang W, Deitz AC, Rustan TD, Hein DW. Identification of a novel allele at the human NAT1 acetyltransferase locus. Biochem Biophys Res Commun. 1997;233:584–591. doi: 10.1006/bbrc.1997.6501. [DOI] [PubMed] [Google Scholar]
- 25.Zhu Y, Hein DW. Functional effects of single nucleotide polymorphisms in the coding region of human N-acetyltransferase 1. Pharmacogenomics J. 2008;8:339–348. doi: 10.1038/sj.tpj.6500483. [DOI] [PMC free article] [PubMed] [Google Scholar]
- 26.Wang D, Chen H, Momary KM, Cavallari LH, Johnson JA, Sadee W. Regulatory polymorphism in vitamin K epoxide reductase complex subunit 1 (VKORC1) affects gene expression and warfarin dose requirement. Blood. 2008;112:1013–1021. doi: 10.1182/blood-2008-03-144899. [DOI] [PMC free article] [PubMed] [Google Scholar]
- 27.Wang D, Guo Y, Wrighton SA, Cooke GE, Sadee W. Intronic polymorphisms in CYP3A4 affects hepatic expression and response to statin drugs. The Pharmacogenomics J. 2010 doi: 10.1038/tpj.2010.28. in press. [DOI] [PMC free article] [PubMed] [Google Scholar]
- 28.Johnson AD, Gong Y, Wang D, et al. Promoter polymorphisms in ACE (angiotensin I-converting enzyme) associated with clinical outcomes in hypertension. Clin Pharmacol Ther. 2009;85:36–44. doi: 10.1038/clpt.2008.194. [DOI] [PMC free article] [PubMed] [Google Scholar]
- 29.Zhang Y, Bertolino A, Fazio L, et al. Polymorphisms in human dopamine D2 receptor gene affect gene expression, splicing, and neuronal activity during working memory. Proc Natl Acad Sci U S A. 2007;104:20552–20557. doi: 10.1073/pnas.0707106104. [DOI] [PMC free article] [PubMed] [Google Scholar]
- 30.Schneider MM, Nielsen TL, Nelsing S, et al. Efficacy and toxicity of two doses of trimethoprim-sulfamethoxazole as primary prophylaxis against Pneumocystis carinii pneumonia in patients with human immunodeficiency virus. Dutch AIDS Treatment Group. J Infect Dis. 1995;171:1632–1636. doi: 10.1093/infdis/171.6.1632. [DOI] [PubMed] [Google Scholar]
- 31.Ju C, Uetrecht JP. Mechanism of idiosyncratic drug reactions: reactive metabolite formation, protein binding and the regulation of the immune system. Curr Drug Metab. 2002;3:367–377. doi: 10.2174/1389200023337333. [DOI] [PubMed] [Google Scholar]
- 32.Winter HR, Unadkat JD. Identification of cytochrome P450 and arylamine N-acetyltransferase isoforms involved in sulfadiazine metabolism. Drug Metab Dispos. 2005;33:969–976. doi: 10.1124/dmd.104.002998. [DOI] [PubMed] [Google Scholar]
- 33.Nakamura H, Uetrecht J, Cribb AE, et al. In vitro formation, disposition and toxicity of N-acetoxy-sulfamethoxazole, a potential mediator of sulfamethoxazole toxicity. J Pharmacol Exp Ther. 1995;274:1099–1104. [PubMed] [Google Scholar]
- 34.Reilly TP, Lash LH, Doll MA, Hein DW, Woster PM, Svensson CK. A role for bioactivation and covalent binding within epidermal keratinocytes in sulfonamide-induced cutaneous drug reactions. J Invest Dermatol. 2000;114:1164–1173. doi: 10.1046/j.1523-1747.2000.00985.x. [DOI] [PubMed] [Google Scholar]
- 35.Zielinska E, Niewiarowski W, Bodalski J. The arylamine N-acetyltransferase (NAT2) polymorphism and the risk of adverse reactions to co-trimoxazole in children. Eur J Clin Pharmacol. 1998;54:779–785. doi: 10.1007/s002280050551. [DOI] [PubMed] [Google Scholar]
- 36.Eliaszewicz M, Flahault A, Roujeau JC, et al. Prospective evaluation of risk factors of cutaneous drug reactions to sulfonamides in patients with AIDS. J Am Acad Dermatol. 2002;47:40–46. doi: 10.1067/mjd.2002.120468. [DOI] [PubMed] [Google Scholar]
- 37.Alfirevic A, Stalford AC, Vilar FJ, Wilkins EG, Park BK, Pirmohamed M. Slow acetylator phenotype and genotype in HIV-positive patients with sulphamethoxazole hypersensitivity. Br J Clin Pharmacol. 2003;55:158–165. doi: 10.1046/j.1365-2125.2003.01754.x. [DOI] [PMC free article] [PubMed] [Google Scholar]
- 38.Pirmohamed M, Alfirevic A, Vilar J, et al. Association analysis of drug metabolizing enzyme gene polymorphisms in HIV-positive patients with co-trimoxazole hypersensitivity. Pharmacogenetics. 2000;10:705–713. doi: 10.1097/00008571-200011000-00005. [DOI] [PubMed] [Google Scholar]
- 39.Carr A, Gross AS, Hoskins JM, Penny R, Cooper DA. Acetylation phenotype and cutaneous hypersensitivity to trimethoprim-sulphamethoxazole in HIV-infected patients. Aids. 1994;8:333–337. doi: 10.1097/00002030-199403000-00006. [DOI] [PubMed] [Google Scholar]
- 40.O’Neil WM, MacArthur RD, Farrough MJ, et al. Acetylator phenotype and genotype in HIV-infected patients with and without sulfonamide hypersensitivity. J Clin Pharmacol. 2002;42:613–619. doi: 10.1177/00970002042006004. [DOI] [PubMed] [Google Scholar]
- 41.Quirino T, Bonfanti P, Arcidiacono M, et al. Acetylator phenotype prevalence in HIV-infected patients without previous trimethoprim-sulfamethoxazole hypersensitivity. Biomed Pharmacother. 1999;53:286–287. doi: 10.1016/s0753-3322(99)80101-2. [DOI] [PubMed] [Google Scholar]
- 42.Miller SA, Dykes DD, Polesky HF. A simple salting out procedure for extracting DNA from human nucleated cells. Nucleic Acids Res. 1988;16:1215. doi: 10.1093/nar/16.3.1215. [DOI] [PMC free article] [PubMed] [Google Scholar]
- 43.Para MF, Finkelstein D, Becker S, Dohn M, Walawander A, Black JR. Reduced toxicity with gradual initiation of trimethoprim-sulfamethoxazole as primary prophylaxis for Pneumocystis carinii pneumonia: AIDS Clinical Trials Group 268. J Acquir Immune Defic Syndr. 2000;24:337–343. doi: 10.1097/00126334-200008010-00007. [DOI] [PubMed] [Google Scholar]
- 44.Pinsonneault J, Nielsen CU, Sadee W. Genetic variants of the human H+/dipeptide transporter PEPT2: analysis of haplotype functions. J Pharmacol Exp Ther. 2004;311:1088–1096. doi: 10.1124/jpet.104.073098. [DOI] [PubMed] [Google Scholar]
- 45.Wang D, Johnson AD, Papp AC, Kroetz DL, Sadee W. Multidrug resistance polypeptide 1 (MDR1, ABCB1) variant 3435C>T affects mRNA stability. Pharmacogenet Genomics. 2005;15:693–704. [PubMed] [Google Scholar]
- 46.Liu L, Wagner CR, Hanna PE. Human arylamine N-acetyltransferase 1: in vitro and intracellular inactivation by nitrosoarene metabolites of toxic and carcinogenic arylamines. Chem Res Toxicol. 2008;21:2005–2016. doi: 10.1021/tx800215h. [DOI] [PubMed] [Google Scholar]
- 47.Cheng Y, Miura RM, Tian B. Prediction of mRNA polyadenylation sites by support vector machine. Bioinformatics. 2006;22:2320–2325. doi: 10.1093/bioinformatics/btl394. [DOI] [PubMed] [Google Scholar]
- 48.Hu J, Lutz CS, Wilusz J, Tian B. Bioinformatic identification of candidate cis-regulatory elements involved in human mRNA polyadenylation. Rna. 2005;11:1485–1493. doi: 10.1261/rna.2107305. [DOI] [PMC free article] [PubMed] [Google Scholar]
- 49.http://louisville.edu/medschool/pharmacology/consensus-human-arylamine-n-acetyltransferase-gene-nomenclature/
- 50.Zhang Y, Wang D, Johnson AD, Papp AC, Sadee W. Allelic expression imbalance of human mu opioid receptor (OPRM1) caused by variant A118G. J Biol Chem. 2005;280:32618–32624. doi: 10.1074/jbc.M504942200. [DOI] [PubMed] [Google Scholar]
- 51.Hein DW, McQueen CA, Grant DM, Goodfellow GH, Kadlubar FF, Weber WW. Pharmacogenetics of the arylamine N-acetyltransferases: a symposium in honor of Wendell W. Weber. Drug Metab Dispos. 2000;28:1425–1432. [PubMed] [Google Scholar]
- 52.Jacobson A, Peltz SW. Interrelationships of the pathways of mRNA decay and translation in eukaryotic cells. Annu Rev Biochem. 1996;65:693–739. doi: 10.1146/annurev.bi.65.070196.003401. [DOI] [PubMed] [Google Scholar]
- 53.Wickens M, Anderson P, Jackson RJ. Life and death in the cytoplasm: messages from the 3′ end. Curr Opin Genet Dev. 1997;7:220–232. doi: 10.1016/s0959-437x(97)80132-3. [DOI] [PubMed] [Google Scholar]
- 54.Edmonds M. A history of poly A sequences: from formation to factors to function. Prog Nucleic Acid Res Mol Biol. 2002;71:285–389. doi: 10.1016/s0079-6603(02)71046-5. [DOI] [PubMed] [Google Scholar]
- 55.Butcher NJ, Tiang J, Minchin RF. Regulation of arylamine N-acetyltransferases. Curr Drug Metab. 2008;9:498–504. doi: 10.2174/138920008784892128. [DOI] [PubMed] [Google Scholar]
Associated Data
This section collects any data citations, data availability statements, or supplementary materials included in this article.