

Abstract
Background
Structural abnormalities in the callosal fibers connecting the heteromodal association areas of the prefrontal and temporoparietal cortices bilaterally have been suggested to play a role in the etiology of schizophrenia.
Aims
To investigate for geometric abnormalities in these callosal fibers in schizophrenia patients using a novel Diffusion-Tensor Imaging (DTI) metric of fiber geometry named Shape-Normalized Dispersion (SHD).
Methods
DTIs (3T, 51 gradient directions, 1.7 mm isotropic voxels) were acquired from 26 schizophrenia patients and 23 matched healthy controls. The prefrontal and temporoparietal fibers of the corpus callosum were extracted by means of whole-brain tractography, and their mean SHD calculated.
Results
The schizophrenia patients exhibited subnormal levels of SHD in the prefrontal callosal fibers when controlling for between-group differences in Fractional Anisotropy. Reduced SHD could reflect either irregularly turbulent or inhomogeneously distributed fiber trajectories in the corpus callosum.
Conclusions
The results suggest that the transcallosal misconnectivity believed to be associated with schizophrenia could arise from abnormalities in fiber geometry. These abnormalities in fiber geometry could potentially be underpinned by irregularities in the normative processes of neurodevelopment.
Keywords: callosal, Diffusion-Tensor Imaging, neurodevelopment, morphometry, white-matter, genu
1. Introduction
Abnormalities in transcallosal connectivity have been suggested to play an etiological role in the development of schizophrenia (Crow, 1998; Crow, 1997; Crow et al., 1989; DeLisi, 2001; Highley et al., 1999). The callosal fibers connecting the language centers of the prefrontal and temporoparietal cortices bilaterally have been specifically implicated (Crow, 2000; DeLisi, 2001), which is consistent with theories that emphasize the role of pathology in the heteromodal association cortex in the etiology of schizophrenia (Pearlson et al., 1996; Ross and Pearlson, 1996). In support of this hypothesis, several studies have inferred the existence of structural abnormalities in the corpus callosum in schizophrenia patients, in vivo, with Diffusion-Tensor Imaging (DTI) (Bora et al., 2011; Kanaan et al., 2005; Kubicki et al., 2007). However, while the physiological bases of these white matter abnormalities are unclear and likely reflect a combination of factors, including myelin damage, damage to the axon membrane and abnormal axonal packing density (Beaulieu, 2002; Kubicki et al., 2007; Whitford et al., 2011b), abnormalities in fiber geometry may also be a factor (Buchsbaum et al., 2006; Savadjiev et al., 2010). In order to test, in vivo with DTI, whether patients with schizophrenia have abnormalities in callosal fiber geometry, it is necessary to use an index that is sensitive to geometric variations in the patterns of diffusion exhibited by a neighborhood of voxels, as opposed to an index that is sensitive only to the diffusion properties exhibited by a given voxel. However, while several studies have used such voxel-based indices as Fractional Anisotropy (FA) and Mean Diffusivity to identify abnormalities in the corpus callosum in patients with schizophrenia (Gasparotti et al., 2009; Mitelman et al., 2007; Rotarska-Jagiela et al., 2008; Shergill et al., 2007; Whitford et al., 2010b), very few studies have used neighborhood-based DTI indices to investigate for abnormalities in fiber geometry in these patients. Furthermore, the few neighborhood-based DTI indices that do exist, such Inter-Voxel Coherence (Pierpaoli and Basser, 1996), are limited in the degree to which they can distinguish between alternative geometric patterns. Inter-Voxel Coherence cannot, for example, distinguish between the two markedly different geometric scenarios presented in Figures 1a and 1b, as it calculates the average degree of collinearity between the diffusion tensor of a reference voxel (i.e., the central voxel) and the adjacent voxels, which is the same in both cases given that the peripheral tensors in Fig. 1b are simply shuffled from the peripheral tensors in Figure 1a.
Figure 1.
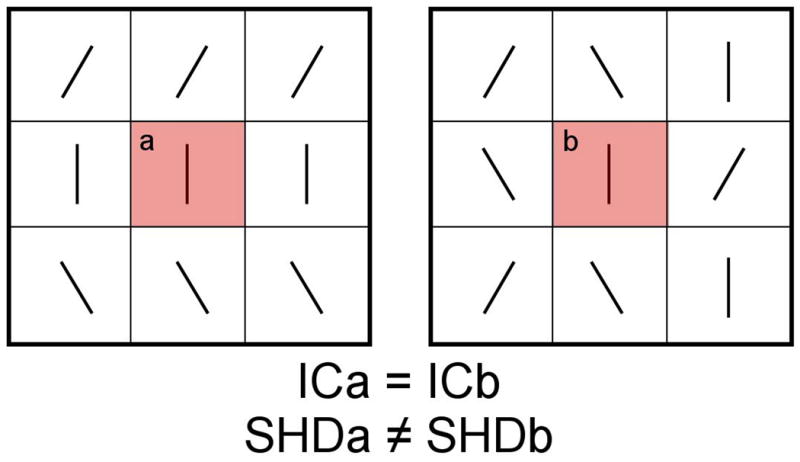
An illustration of the relative sensitivities of SHD and Inter-Voxel Coherence (IC) in detecting geometric variations in a neighborhood of voxels. As IC is calculated as the average angle between the central tensor (in red) and that of its neighbors, it follows that the IC of voxel (a) is equal to the IC of voxel (b), despite the vastly different geometries of the surrounding neighborhoods. In contrast, the SHD of voxel (a) differs from the SHD of voxel (b), which illustrates the fact that SHD is more sensitive than IC in detecting variations in tensor orientations within a voxel neighborhood.
In light of the shortcomings of the existing indices of fiber geometry, the present study used a new index of fiber geometry dubbed Shape Normalized Dispersion (SHD). As has been discussed previously (Savadjiev et al., 2010), SHD is more sensitive to variations in fiber geometry, and more specific as to their ontology, than previously used metrics such as Inter-Voxel Coherence. SHD is a scalar measure of local white matter geometry that is based on a mathematical framework that computes local variation in tensor orientation. Grossly speaking, SHD is a measure of the degree to which fibers locally deviate from being parallel. As SHD is based on diffusion tensor field derivatives, it incorporates information from the local voxel neighborhood, and is sensitive to geometric differences between patterns of tensor orientations within a voxel neighborhood, such as between the patterns illustrated in Figure 1.
In summary, the present study aimed to use the novel diffusion metric of SHD to test whether schizophrenia patients exhibited geometric abnormalities in the callosal fibers connecting the heteromodal association areas of the prefrontal and temporoparietal cortices bilaterally.
2. Materials and Methods
2.1. Participants
Twenty-six male patients with chronic schizophrenia were recruited from out-patient, in-patient, day treatment, and foster care programs at the VA Boston Healthcare System, Brockton, MA. Diagnosis of schizophrenia was made in accordance with DSM-IV criteria on the basis of the Structured Clinical Interview for DSM-IV, conducted by a clinically and research-trained psychologist, together with a review of the medical record. At the time of scanning, 23 of the 26 patients were taking neuroleptic medications (see Table 1). Patients' medication dosages were converted into a common chlorpromazine-equivalent based scale for the purposes of comparison (Woods, 2003). The severity of patients' clinical symptoms was quantified with the Positive and Negative Symptom Scale (PANSS) (Kay et al., 1987), which was administered by a trained clinical psychologist (PN).
Table 1.
Demographic details of the 26 schizophrenia patients and 23 matched healthy controls who participated in the study.
| Variable | Healthy Controls (n=23) | Schizophrenia Patients (n=26) | HC vs. SZ | ||||
|---|---|---|---|---|---|---|---|
| Mean | SD | Range | Mean | SD | Range | p-value | |
| Age | 42.46 | 10.3 | 22-55 | 44 | 9.7 | 22-55 | p=.59 |
| Handedness1 | 0.75 | 0.19 | (.41-1.00) | 0.73 | 0.25 | (.25-1.00) | p=.76 |
| Gender | 100% male | 100% male | - | ||||
| Education (years) | 14.89 | 1.9 | (12-19) | 13.13 | 1.8 | (9-18) | p<0.01 |
| Parental SES2 | 2.39 | 1.2 | (1-5) | 2.54 | 1.1 | (1-4) | p=.68 |
| Premorbid IQ3 | 104 | 11 | (77-117) | 99 | 12 | (81-118) | p=.18 |
| PANSS-Positive | - | 20.75 | 9.17 | (7-41) | - | ||
| PANSS-Negative | - | 20.13 | 10.14 | (7-43) | - | ||
| Neuroleptic dosage4 | - | 343 | 269 | (0-900) | - | ||
| Duration of illness (years) | - | 20.08 | 10.35 | (3-34) | - | ||
| Neuroleptic Class | - | Typical n=21; Atypical n=19 Both Typical and Atypical n=2; Unmedicated: n=3 |
- | ||||
Edinburgh Handedness Inventory;
Two Factor Index of Social Position;
WRAT-3 Reading Scale;
CPZ-Equivalent (mg/day).
The exclusion criteria were: a history of neurological illness including epilepsy, a lifetime history of substance dependence or a history of substance abuse within the past 5 years, a history of steroid use, a history of electroconvulsive shock therapy, and estimated premorbid IQ below 75.
Furthermore, control participants were screened for the presence of an Axis-I disorder using the SCID-Non-Patient edition, and were also excluded if they reported having a first-degree relative with an Axis I disorder.
Twenty-three male healthy control participants were recruited from the general community. The control participants were group matched to the patients on age, handedness (Oldfield, 1971), parental socioeconomic status (Hollingshead, 1965), and estimated premorbid IQ, as assessed by performance on the Reading scale of Wide Range Achievement Test (WRAT-3) (Wilkinson, 1993). The demographic details and exclusion criteria for all participants are summarized in Table 1. After a detailed description of the study, each participant gave written informed consent to participate. This study was approved by the VA Boston Healthcare System, the Harvard Medical School Internal Review Board Committee, and the Brigham and Women's Hospital Human Participants Committee.
2.2. Image Acquisition
Diffusion data were acquired on a 3 Tesla GE Echospeed system (General Electric Medical Systems, Milwaukee, WI). Diffusion-weighted images were acquired using an echo planar imaging sequence, with the following parameters: TR 17000 ms, TE 78 ms, FOV 24 cm, 144×144 matrix, 1.7 mm slice thickness, approximate scan time = 17 minutes. A double echo option was used to reduce eddy-current related distortions. To reduce the impact of EPI spatial distortion, an 8-channel coil and ASSET (Array Spatial Sensitivity Encoding techniques, GE) with a SENSE-factor (speed-up) of 2 was used. Eighty-five axial slices parallel to the AC-PC line covering the whole brain were acquired in 51 gradient directions with b=900 s/mm2. Eight baseline scans with b=0 s/mm2 were also acquired. Diffusion-Tensor Images (DTIs) were estimated from the Diffusion-Weighted Images on the basis of a Least-Squares Estimation.
2.3. Whole-Brain Tractography
The tractography protocol used in this study has been described in detail elsewhere (Whitford et al., 2010b). Deterministic (streamline) tractography was performed via a Runge-Kutta second order protocol. Seedpoints were placed at every point for which Westin's Linear Anisotropy measure (CL; Westin et al., 2002) was greater than 0.3 (the seeding criterion), with a stopping criterion of CL = 0.15, a step size of 0.5mm and a length criterion of 20mm.
2.4. Fiber Clustering and Extraction of the Prefrontal and Temporoparietal Callosal Fibers
The whole-brain tractography procedure (see Figure 2a) generated an estimated twenty thousand fibers per participant. As described in detail elsewhere (O'Donnell and Westin, 2007; Whitford et al., 2010b), these fibers were then clustered into 200 fiber-clusters (FCs) (Figure 2b), each consisting of a spatially and morphometrically similar subset of the fibers generated from the whole-brain tractography (Figure 2a). Tractography and fiber clustering were performed using Matlab 7.0 (www.mathworks.com) and 3D-Slicer (www.slicer.org).
Figure 2.
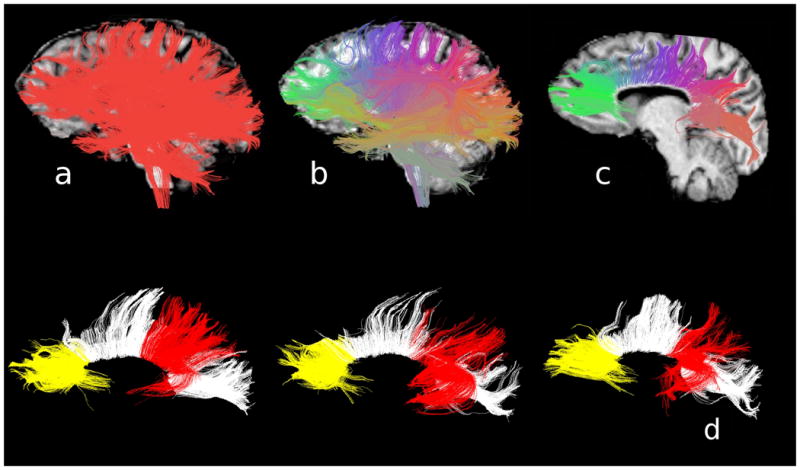
A summary of the protocol for DTI pre-processing. Whole-brain tractography was performed on each participant's DTI (Panel A), and the resultant fibers combined. Fibers with similar shapes and spatial positions were clustered together into 200 clusters (Panel B). The 37 clusters constituting the corpus callosum were extracted (Panel C), and, of these, 11 clusters constituting the prefrontal callosal fibers (in yellow) and the 10 clusters constituting the temporoparietal callosal fibers (in red) were identified and automatically extracted from each participant's whole-brain tractography image. The prefrontal and temporoparietal fibers of three representative representative participants are illustrated in Panel D.
Thirty-seven of these 200 FCs were identified as the corpus callosum (Figure 2c). The prefrontal callosal FCs were defined as the 11 corpus callosum FCs that lay anterior to the premotor cortex (see Figure 2d), based on the consensus of two independent raters (TW and DT, inter-rater reliability = .907), and confirmation from a third rater (MK). The temporoparietal callosal FCs were defined as the 10 callosal FCs that lay posterior to the somatosensory cortex and which either a) projected superiorly to the parietal cortex but not posteriorly to the visual cortex, or b) projected inferiorly to the temporal cortex (see Figure 2d). The temporoparietal FCs were also defined on the consensus of TW and DT (inter-rater reliability = .930), and confirmation from MK. Following their definition, the prefrontal and temporoparietal fibers of the corpus callosum were automatically extracted for all participants as per the protocol of O'Donnell and Westin (2007).
2.5. Diffusion Indices
Shape Normalized Dispersion (SHD) was calculated at every voxel in every participant's DTI, as per the protocol of Savadjiev et al. (2010). Each participant's mean SHD in the prefrontal callosal fibers was calculated by averaging the SHD values of all voxels through which any of the prefrontal FCs passed. Similarly, average SHD in the temporoparietal callosal fibers was calculated by averaging the SHD of all voxels through which any of the temporoparietal FCs passed.
Fractional Anisotropy (FA) was also calculated at every voxel in every participant's DTI (Basser and Pierpaoli, 1996), and average FA was calculated for the prefrontal and temporoparietal callosal fibers. FA was entered as a covariate in the between-group analysis of SHD. While FA is mathematically independent of SHD (Savadjiev et al., 2010), it was included as a covariate to control for the possibility of any observed group differences in SHD ultimately being driven by group differences in FA. Such a scenario could arise, for example, if FA measures were dependent to some extent on fiber geometry, or if FA and SHD had a common dependence on noise in the data, or other factors in the imaging process.
2.6. Statistical Analysis
Statistical analyses were performed using SPSS v11 (www.spss.com). Analysis-of-Variance (ANOVA) was used to investigate for between-group differences in SHD and FA in the prefrontal and temporoparietal fibers of the corpus callosum. Spearman's correlations were used to investigate the relationship between patients' SHD in the prefrontal and temporoparietal fibers and their chlorpromazine-equivalent medication dosage. Partial correlations, controlling for chlorpromazine-equivalent medication dosage, were used to investigate the relationship between patients' SHD in the prefrontal and temporoparietal fibers and their scores on the seven positive and seven negative subscales of the PANSS. Given the number of correlations this entailed, α was set to 0.01 for these analyses to control for multiple comparisons.
In a supplementary exploratory analysis, Tract-Based Spatial Statistics (TBSS; Smith et al., 2006) was used to investigate for voxelwise differences in SHD between the SZ and control groups across all major white matter fasciculi. Firstly, all subjects' FA and SHD images were aligned into a common space using the nonlinear registration tool FNIRT (FMRIB Centre, University of Oxford; www.fmrib.ox.ac.uk/analysis/techrep). The aligned FA images were averaged to create a mean FA image, which was then thinned to create a mean FA skeleton. The skeleton represented the centers of all white matter tracts that were common to all subjects. Each subject's aligned SHD data was then projected onto the skeleton, and the resulting data was used to perform voxelwise statistics between subjects. The statistics were performed using the ‘randomize’ tool for permutation testing (Nichols and Holmes, 2001), which is part of the FSL software library (FMRIB Centre, University of Oxford; http://www.fmrib.ox.ac.uk/fsl/).
3. Results
The SZ patients exhibited reduced levels of SHD in the prefrontal fibers of the corpus callosum, relative to HC (mean±SD) (SZ: 0.04090±0.00132; HC: 0.04191±0.00123; t(47)=2.752, p=0.008 – see Figure 3a). This between-group difference in prefrontal SHD remained significant when controlling for between-group differences in FA (F1,49 = 4.294, p=0.044, partial eta2=0.085), and when the three unmedicated patients were removed from the analysis (F1,46 = 4.939, p=0.032, partial eta2=0.103).
Figure 3.

Scatterplots illustrating the groupwise differences in Shape Normalized Dispersion (SHD) in the prefrontal callosal fibers (Panel A) and the temporoparietal callosal fibers (Panel B) in the 26 patients with schizophrenia and 23 matched healthy controls. The dotted black line represents the mean SHD. The asterisk signifies a significant between-group difference in SHD (p<0.05).
There was no significant difference between the SZ patients and HC participants in the SHD of the temporoparietal fibers (SZ: 0.04417±0.00204; HC: 0.04427±0.00209, t(47)=0.163, p=0.871 – see Figure 3b). This comparison remained non-significant when controlling for between-group differences in FA (F1,49 = 0.014, p=0.907, partial eta2<0.001), and when the three unmedicated patients were removed from the analysis (F1,46 = 0.029, p=0.865, partial eta2=0.001).
There was a significant between-group difference in the FA of the prefrontal callosal fibers (SZ: 0.46799±0.02531; HC: 0.48241±0.01881, t(47)=2.237, p=0.030). However, this difference did not remain significant when controlling for between-group differences in SHD (F1,49 = 1.872, p=0.178, partial eta2=0.093), or when the three unmedicated patients were removed from the analysis (F1,49 = 1.200, p=0.279, partial eta2=0.027). There was no between-group difference in the FA of the temporoparietal fibers (SZ: 0.4992±0.02508; HC: 0.5091±0.02489, t(47)=1.388, p=0.172). This contrast remained non-significant when controlling for between-group differences in SHD (F1,49 = 1.872, p=0.178, partial eta2=0.039), and when the three unmedicated patients were removed from the analysis (F1,46 = 1.714, p=0.197, partial eta2=0.038).
There were no significant correlations between patients' chlorpromazine-equivalent medication dosage and their SHD in either the prefrontal (rho(24) = .238, p=0.263) or temporoparietal (rho(24) = .129, p=.549) fibers. Similarly, there were no significant correlations between chlorpromazine-equivalent dosage and patients' FA in the prefrontal (rho(24)=-.103, p=.632) or temporoparietal (rho(24)=-.248, p=0.243) fibers. There were no significant correlations between either patients' SHD or FA in either the prefrontal or temporoparietal callosal fibers and their scores on any of the seven positive and seven negative subscales of the PANSS (p>0.01 for all correlations).
In the exploratory TBSS analysis, there were no voxels that differed between the schizophrenia and control groups in terms of their SHD, after correction for familywise error.
4. Discussion
The aim of the present study was to use a novel measure of fiber geometry, SHD (Savadjiev et al., 2010), to investigate whether the fibers connecting the heteromodal association areas of the prefrontal and temporoparietal cortices were morphometrically abnormal in patients with schizophrenia. This is the first study (to our knowledge) that has used a morphometry-specific DTI measure to investigate the structural basis of the transcallosal misconnectivity that has been implicated in the etiology of schizophrenia. The results revealed that while the schizophrenia group exhibited abnormal fiber geometry in the prefrontal callosal fibers, they did not exhibit abnormalities in the temporoparietal callosal fibers, relative to matched healthy controls.
While a number of studies have identified abnormalities in the size, shape, asymmetry and diffusivity of the corpus callosum in patients with schizophrenia (Brambilla et al., 2005; DeLisi et al., 1997; Walterfang et al., 2008; Woodruff et al., 1995) – although negative findings have also been reported (Price et al., 2005; Rossell et al., 2001) – there has been, to the best of our knowledge, only one previous study that has used a neighborhood-based DTI metric of fiber geometry to investigate for abnormalities in the corpus callosum in patients with schizophrenia. Specifically, Federspiel et al. (2006) used a voxel-based analysis to compare Inter-Voxel Coherence between 12 FES patients and 12 healthy controls and found evidence of coherence reductions in several fasciculi including the corpus callosum. Notwithstanding the aforementioned limitations of Inter-Voxel Coherence as a diffusion metric, the results of Federspiel et al. (2006) are consistent with the results of the current study insofar as that they suggest that schizophrenia may be associated with geometric abnormalities in WM fasciculi. The question remains open, however, as to what geometric scenarios could give rise to the SHD reductions observed in the present study. In contrast to the ‘normal’ callosal fiber structure illustrated in Figure 3a, there are at least two geometric scenarios that would lead to reductions in SHD and which could thus potentially underpin the SHD reductions exhibited by the schizophrenia patients in the present study. The first possibility is that the fibers did not follow a smooth trajectory in their projection to the cortex, but instead followed a variable, ‘wiggly’ trajectory, as illustrated in Figure 3b. The second possibility is that the fibers had a smooth trajectory but were inhomogeneously distributed, or ‘clumped’ within the fasciculus, as illustrated in Figure 3c. Both of these scenarios would lead to a reduction in SHD, and thus either (or both) could potentially underlie the SHD reductions exhibited by the schizophrenia patients in the present study.
If the subnormal levels of SHD exhibited by the schizophrenia patients reflected an abnormality in the morphometry of the prefrontal callosal fibers, the question arises as to what were the biological underpinnings of these morphometric abnormalities. One prima facie, albeit speculative, possibility is that the irregular fiber structure was underpinned by abnormalities in the normative processes of neurodevelopment. This possibility is consistent with models of schizophrenia that emphasize neurodevelopmental abnormalities in the etiology of the disease (Akbarian et al., 1996; Kovalenko et al., 2003). Also consistent with this idea is the fact that a primary role of the DISC1 gene, which has consistently been implicated in the etiology of schizophrenia (Roberts, 2007), is in regulating neuronal migration in utero, including in the corpus callosum (Clapcote and Roder, 2006). It must, however, be emphasized that the proposed hypothesis is speculative, and that it is not possible to determine definitively the physiological underpinnings of the observed SHD abnormalities on the basis of these results. Furthermore, it should also be noted that while corpus callosum abnormalities have frequently been reported in patients with schizophrenia, structural abnormalities have also been observed in several other fasciculi (including the uncinate fasciculus (Kubicki et al., 2002), superior longitudinal fasciculus (Karlsgodt et al., 2008) and arcuate fasciculus (Whitford et al., 2011a), and that these abnormalities are consistent with the predictions of other white matter models of the disorder (e.g., Bartzokis, 2002; Whitford et al., 2010a). And finally, it is also important to note that the morphometric abnormalities in the prefrontal callosal fibers are not only consistent with theories of transcallosal misconnection, but are also consistent with other neurodevelopmental theories of schizophrenia, such as ‘hypofrontality’ models of the disorder (Weinberger et al., 1994). The results of the current study thus need to be considered in the context of the broader schizophrenia literature, and future studies are needed to ascertain the specificity and etiology of the SHD abnormalities that were observed in schizophrenia patients.
There were at least two limitations to the present study. The first limitation relates to the fact that all of the participants in the study were male. While this was advantageous in the sense that it increased the homogeneity of the sample, it obviously limits the extent to which the results can be generalized to females. The second limitation relates to the fact that all of the schizophrenia patients were chronically ill and thus had typically been exposed to a variety of neuroleptic medications over many years. While no significant or near-significant correlations were observed between patients' SHD and their chlorpromazine-equivalent medication dosage, the fact that neuroleptics have been shown to affect the structure of white matter fasciculi in and of themselves, such as by eliminating myelin-forming oligodendroglia (Konopaske et al., 2008), raises the possibility that they may also have an effect on fiber geometry. It should also be noted that the schizophrenia patients had typically been ill for many years, and consequently may have experienced longitudinal changes in brain structure over the course of their illness, irrespective of any pharmacological or psychological treatments they may have received.
In summary, the present study used a novel metric of fiber geometry, SHD, to identify morphometric abnormalities in the prefrontal fibers of the corpus callosum in patients with chronic schizophrenia. These morphometric abnormalities could potentially be underpinned by abnormalities in the normative processes of neurodevelopment. The results of the study provide support for the idea that schizophrenia is associated with aberrant inter-hemispheric communication between the frontal lobes.
Figure 4.

Schematic examples of normal (Panel A) and abnormal (Panels B and C) fiber structures. Panel A represents a smoothly fanning fiber structure such as might be expected in the corpus callosum in a healthy individual. Panels B and C represent abnormal fiber structures which would exhibit lower levels of SHD relative to Panel A and thus could potentially underpin the subnormal levels of SHD exhibited by the schizophrenia patients in the prefrontal callosal fibers in the present study. Panel B represents a fiber structure consisting of fibers that do not follow a smooth trajectory in their projection to the cortex, but instead follow a ‘wiggly’ trajectory. Panel C represents a ‘clumped’ fiber structure in which the fibers are inhomogeneously distributed within the fiber bundle.
Footnotes
Publisher's Disclaimer: This is a PDF file of an unedited manuscript that has been accepted for publication. As a service to our customers we are providing this early version of the manuscript. The manuscript will undergo copyediting, typesetting, and review of the resulting proof before it is published in its final citable form. Please note that during the production process errors may be discovered which could affect the content, and all legal disclaimers that apply to the journal pertain.
References
- Akbarian S, Kim JJ, Potkin SG, Hetrick WP, Bunney WE, Jr, Jones EG. Maldistribution of interstitial neurons in prefrontal white matter of the brains of schizophrenic patients. Arch Gen Psychiatry. 1996;53:425–436. doi: 10.1001/archpsyc.1996.01830050061010. [DOI] [PubMed] [Google Scholar]
- Bartzokis G. Schizophrenia: breakdown in the well-regulated lifelong process of brain development and maturation. Neuropsychopharmacology. 2002;27:672–683. doi: 10.1016/S0893-133X(02)00364-0. [DOI] [PubMed] [Google Scholar]
- Basser PJ, Pierpaoli C. Microstructural and physiological features of tissues elucidated by quantitative-diffusion-tensor MRI. J Magn Reson B. 1996;111:209–219. doi: 10.1006/jmrb.1996.0086. [DOI] [PubMed] [Google Scholar]
- Beaulieu C. The basis of anisotropic water diffusion in the nervous system - a technical review. NMR Biomed. 2002;15:435–455. doi: 10.1002/nbm.782. [DOI] [PubMed] [Google Scholar]
- Bora E, Fornito A, Radua J, Walterfang M, Seal M, Wood SJ, Yucel M, Velakoulis D, Pantelis C. Neuroanatomical abnormalities in schizophrenia: A multimodal voxelwise meta-analysis and meta-regression analysis. Schizophr Res. 2011 doi: 10.1016/j.schres.2010.12.020. [DOI] [PubMed] [Google Scholar]
- Brambilla P, Cerini R, Gasparini A, Versace A, Andreone N, Vittorini E, Barbui C, Pelizza L, Nosè M, Barlocco L, Marrella G, Gregis M, Tournikioti K, David A, Keshavan M, Tansella M. Investigation of corpus callosum in schizophrenia with diffusion imaging. Schizophr Res. 2005;79:201–210. doi: 10.1016/j.schres.2005.04.012. [DOI] [PubMed] [Google Scholar]
- Buchsbaum M, Schoenknecht P, Torosjan Y, Newmark R, Chu KW, Mitelman, Brickman A, Shihabuddin L, Haznedar M, Hazlett E, Ahmed S, Tang C. Diffusion tensor imaging of frontal lobe white matter tracts in schizophrenia. Annals of General Psychiatry. 2006;5:19–29. doi: 10.1186/1744-859X-5-19. [DOI] [PMC free article] [PubMed] [Google Scholar]
- Clapcote S, Roder J. Deletion polymorphism of Disc1 is common to all 129 mouse substrains: implications for gene-targeting studies of brain function. Genetics. 2006;173:2407–2410. doi: 10.1534/genetics.106.060749. [DOI] [PMC free article] [PubMed] [Google Scholar]
- Crow T. Schizophrenia as a transcallosal misconnection syndrome. Schizophr Res. 1998;30:111–114. doi: 10.1016/s0920-9964(97)00139-4. [DOI] [PubMed] [Google Scholar]
- Crow T. Schizophrenia as the price that homo sapiens pays for language: a resolution of the central paradox in the origin of the species. Brain Res Brain Res Rev. 2000;31:118–129. doi: 10.1016/s0165-0173(99)00029-6. [DOI] [PubMed] [Google Scholar]
- Crow TJ. Schizophrenia as failure of hemispheric dominance for language. Trends in Neurosciences. 1997;20:339–343. doi: 10.1016/s0166-2236(97)01071-0. [DOI] [PubMed] [Google Scholar]
- Crow TJ, Ball J, Bloom SR, Brown R, Bruton CJ, Colter N, Frith CD, Johnstone EC, Owens DG, Roberts GW. Schizophrenia as an anomaly of development of cerebral asymmetry. A postmortem study and a proposal concerning the genetic basis of the disease. Arch Gen Psychiatry. 1989;46:1145–1150. doi: 10.1001/archpsyc.1989.01810120087013. [DOI] [PubMed] [Google Scholar]
- DeLisi LE. Speech disorder in schizophrenia: review of the literature and exploration of its relation to the uniquely human capacity for language. Schizophr Bull. 2001;27:481–496. doi: 10.1093/oxfordjournals.schbul.a006889. [DOI] [PubMed] [Google Scholar]
- DeLisi LE, Sakuma M, Kushner M, Finer DL, Hoff AL, Crow TJ. Anomalous cerebral asymmetry and language processing in schizophrenia. Schizophr Bull. 1997;23:255–271. doi: 10.1093/schbul/23.2.255. [DOI] [PubMed] [Google Scholar]
- Federspiel A, Begré S, Kiefer C, Schroth G, Strik W, Dierks T. Alterations of white matter connectivity in first episode schizophrenia. Neurobiol Dis. 2006;22:702–709. doi: 10.1016/j.nbd.2006.01.015. [DOI] [PubMed] [Google Scholar]
- Gasparotti R, Valsecchi P, Carletti F, Galluzzo A, Liserre R, Cesana B, Sacchetti E. Reduced fractional anisotropy of corpus callosum in first-contact, antipsychotic drug-naive patients with schizophrenia. Schizophr Res. 2009;108:41–48. doi: 10.1016/j.schres.2008.11.015. [DOI] [PubMed] [Google Scholar]
- Highley JR, Esiri MM, McDonald B, Cortina-Borja M, Herron BM, Crow TJ. The size and fibre composition of the corpus callosum with respect to gender and schizophrenia: a post-mortem study. Brain. 1999;122(Pt 1):99–110. doi: 10.1093/brain/122.1.99. [DOI] [PubMed] [Google Scholar]
- Hollingshead A. Two factor of index of social position. Yale Station, New Haven: 1965. [Google Scholar]
- Kanaan R, Kim J, Kaufmann W, Pearlson G, Barker G, McGuire P. Diffusion tensor imaging in schizophrenia. Biol Psychiatry. 2005;58:921–929. doi: 10.1016/j.biopsych.2005.05.015. [DOI] [PubMed] [Google Scholar]
- Karlsgodt KH, van Erp TG, Poldrack RA, Bearden CE, Nuechterlein KH, Cannon TD. Diffusion tensor imaging of the superior longitudinal fasciculus and working memory in recent-onset schizophrenia. Biol Psychiatry. 2008;63:512–518. doi: 10.1016/j.biopsych.2007.06.017. [DOI] [PubMed] [Google Scholar]
- Kay SR, Fiszbein A, Opler LA. The positive and negative syndrome scale (PANSS) for schizophrenia. Schizophrenia Bulletin. 1987;13:261–276. doi: 10.1093/schbul/13.2.261. [DOI] [PubMed] [Google Scholar]
- Konopaske G, Dorph-Petersen K, Sweet R, Pierri J, Zhang W, Sampson A, Lewis D. Effect of chronic antipsychotic exposure on astrocyte and oligodendrocyte numbers in macaque monkeys. Biol Psychiatry. 2008;63:759–765. doi: 10.1016/j.biopsych.2007.08.018. [DOI] [PMC free article] [PubMed] [Google Scholar]
- Kovalenko S, Bergmann A, Schneider-Axmann T, Ovary I, Majtenyi K, Havas L, Honer WG, Bogerts B, Falkai P. Regio entorhinalis in schizophrenia: more evidence for migrational disturbances and suggestions for a new biological hypothesis. Pharmacopsychiatry. 2003;36 3:S158–161. doi: 10.1055/s-2003-45124. [DOI] [PubMed] [Google Scholar]
- Kubicki M, McCarley R, Westin CF, Park HJ, Maier S, Kikinis R, Jolesz FA, Shenton ME. A review of diffusion tensor imaging studies in schizophrenia. J Psychiatr Res. 2007;41:15–30. doi: 10.1016/j.jpsychires.2005.05.005. [DOI] [PMC free article] [PubMed] [Google Scholar]
- Kubicki M, Westin CF, Maier SE, Frumin M, Nestor PG, Salisbury DF, Kikinis R, Jolesz FA, McCarley RW, Shenton ME. Uncinate fasciculus findings in schizophrenia: a magnetic resonance diffusion tensor imaging study. Am J Psychiatry. 2002;159:813–820. doi: 10.1176/appi.ajp.159.5.813. [DOI] [PMC free article] [PubMed] [Google Scholar]
- Mitelman S, Torosjan Y, Newmark R, Schneiderman J, Chu K, Brickman A, Haznedar M, Hazlett E, Tang C, Shihabuddin L, Buchsbaum M. Internal capsule, corpus callosum and long associative fibers in good and poor outcome schizophrenia: a diffusion tensor imaging survey. Schizophr Res. 2007;92:211–224. doi: 10.1016/j.schres.2006.12.029. [DOI] [PubMed] [Google Scholar]
- Nichols TE, Holmes AP. Nonparametric Permutation Tests for Functional Neuroimaging: A Primer with Examples. Human Brain Mapping. 2001 doi: 10.1002/hbm.1058. accepted for publication. [DOI] [PMC free article] [PubMed] [Google Scholar]
- O'Donnell L, Westin C. Automatic tractography segmentation using a high-dimensional white matter atlas. IEEE Trans Med Imaging. 2007;26:1562–1575. doi: 10.1109/TMI.2007.906785. [DOI] [PubMed] [Google Scholar]
- Oldfield RC. The assessment and analysis of handedness: the Edinburgh inventory. Neuropsychologia. 1971;9:97–113. doi: 10.1016/0028-3932(71)90067-4. [DOI] [PubMed] [Google Scholar]
- Pearlson G, Petty R, Ross C, Tien A. Schizophrenia: a disease of heteromodal association cortex? Neuropsychopharmacology. 1996;14:1–17. doi: 10.1016/S0893-133X(96)80054-6. [DOI] [PubMed] [Google Scholar]
- Pierpaoli C, Basser P. Toward a quantitative assessment of diffusion anisotropy. Magn Reson Med. 1996;36:893–906. doi: 10.1002/mrm.1910360612. [DOI] [PubMed] [Google Scholar]
- Price G, Bagary MS, Cercignani M, Altmann DR, Ron MA. The corpus callosum in first episode schizophrenia: a diffusion tensor imaging study. J Neurol Neurosurg Psychiatry. 2005;76:585–587. doi: 10.1136/jnnp.2004.042952. [DOI] [PMC free article] [PubMed] [Google Scholar]
- Roberts R. Schizophrenia in translation: disrupted in schizophrenia (DISC1): integrating clinical and basic findings. Schizophr Bull. 2007;33:11–15. doi: 10.1093/schbul/sbl063. [DOI] [PMC free article] [PubMed] [Google Scholar]
- Ross C, Pearlson G. Schizophrenia, the heteromodal association neocortex and development: potential for a neurogenetic approach. Trends Neurosci. 1996;19:171–176. doi: 10.1016/s0166-2236(96)10022-9. [DOI] [PubMed] [Google Scholar]
- Rossell SL, Shapleske J, Fukuda R, Woodruff PW, Simmons A, David AS. Corpus callosum area and functioning in schizophrenic patients with auditory--verbal hallucinations. Schizophr Res. 2001;50:9–17. doi: 10.1016/s0920-9964(00)00070-0. [DOI] [PubMed] [Google Scholar]
- Rotarska-Jagiela A, Schönmeyer R, Oertel V, Haenschel C, Vogeley K, Linden D. The corpus callosum in schizophrenia-volume and connectivity changes affect specific regions. NeuroImage. 2008;39:1522–1532. doi: 10.1016/j.neuroimage.2007.10.063. [DOI] [PubMed] [Google Scholar]
- Savadjiev P, Kindlmann G, Bouix S, Shenton M, Westin C. Local white matter geometry from diffusion tensor gradients. Neuroimage. 2010;49:3175–3186. doi: 10.1016/j.neuroimage.2009.10.073. [DOI] [PMC free article] [PubMed] [Google Scholar]
- Shergill S, Kanaan R, Chitnis X, O'Daly O, Jones D, Frangou S, Williams S, Howard R, Barker G, Murray R, McGuire P. A diffusion tensor imaging study of fasciculi in schizophrenia. Am J Psychiatry. 2007;164:467–473. doi: 10.1176/ajp.2007.164.3.467. [DOI] [PubMed] [Google Scholar]
- Smith SM, Jenkinson M, Johansen-Berg H, Rueckert D, Nichols TE, Mackay CE, Watkins KE, Ciccarelli O, Cader MZ, Matthews PM, Behrens TE. Tract-based spatial statistics: voxelwise analysis of multi-subject diffusion data. NeuroImage. 2006;31:1487–1505. doi: 10.1016/j.neuroimage.2006.02.024. [DOI] [PubMed] [Google Scholar]
- Walterfang M, Wood A, Reutens D, Wood S, Chen J, Velakoulis D, McGorry P, Pantelis C. Morphology of the corpus callosum at different stages of schizophrenia: cross-sectional study in first-episode and chronic illness. Br J Psychiatry. 2008;192:429–434. doi: 10.1192/bjp.bp.107.041251. [DOI] [PubMed] [Google Scholar]
- Weinberger DR, Aloia MS, Goldberg TE, Berman KF. The frontal lobes and schizophrenia. J Neuropsychiatry Clin Neurosci. 1994;6:419–427. doi: 10.1176/jnp.6.4.419. [DOI] [PubMed] [Google Scholar]
- Westin CF, Maier SE, Mamata H, Nabavi A, Jolesz FA, Kikinis R. Processing and visualization for diffusion tensor MRI. Med Image Anal. 2002;6:93–108. doi: 10.1016/s1361-8415(02)00053-1. [DOI] [PubMed] [Google Scholar]
- Whitford T, Mathalon D, Shenton M, Roach B, Bammer R, Adcock R, Bouix S, Kubicki M, De Siebenthal J, Rausch A, Scheiderman J, F JM. Electrophysiological and Diffusion-Tensor Imaging Evidence of Delayed Corollary Discharges in Patients with Schizophrenia. Psychological Medicine. 2011a;41:959–969. doi: 10.1017/S0033291710001376. [DOI] [PMC free article] [PubMed] [Google Scholar]
- Whitford TJ, Ford JM, Mathalon DH, Kubicki M, Shenton ME. Schizophrenia, Myelination, and Delayed Corollary Discharges: A Hypothesis. Schizophr Bull. 2010a doi: 10.1093/schbul/sbq105. [DOI] [PMC free article] [PubMed] [Google Scholar]
- Whitford TJ, Kubicki M, Schneiderman JS, O'Donnell LJ, King R, Alvarado JL, Khan U, Markant D, Nestor PG, Niznikiewicz M, McCarley RW, Westin CF, Shenton ME. Corpus callosum abnormalities and their association with psychotic symptoms in patients with schizophrenia. Biological Psychiatry. 2010b;68:70–77. doi: 10.1016/j.biopsych.2010.03.025. [DOI] [PMC free article] [PubMed] [Google Scholar]
- Whitford TJ, Kubicki M, Shenton ME. Structural neuroimaging of schizophrenia. In: Shenton ME, Turetsky B, editors. Understanding Neuropsychiatric Disorders. Cambridge University Press; New York: 2011b. [Google Scholar]
- Wilkinson G. The Wide Range Achievement Test - Revision 3. Jastak Association; Wilmington, DE: 1993. [Google Scholar]
- Woodruff PW, McManus IC, David AS. Meta-analysis of corpus callosum size in schizophrenia. J Neurol Neurosurg Psychiatry. 1995;58:457–461. doi: 10.1136/jnnp.58.4.457. [DOI] [PMC free article] [PubMed] [Google Scholar]
- Woods S. Chlorpromazine equivalent doses for the newer atypical antipsychotics. J Clin Psychiatry. 2003;64:663–667. doi: 10.4088/jcp.v64n0607. [DOI] [PubMed] [Google Scholar]