Abstract
Late diagnosis of hepatocarcinoma (HCC) is one of the most primary factors for the poor survival of patients. Thereby, identification of sensitive and specific biomarkers for HCC early diagnosis is of great importance in biological medicine to date. In the present study, serum metabolites of the HCC patients and healthy controls were investigated using the improved liquid chromatography–mass spectrometry (LC/MS). A wavelet-based method was utilized to find and align peaks of LC–MS. The characteristic peaks were selected by performing a two-sample t test statistics (p value <0.05). Clustering analysis based on principal component analysis showed a clear separation between HCC patients and healthy individuals. The serum metabolite, namely 1-methyladenosine, was identified as the characteristic metabolite for HCC. Moreover, receiver–operator curves were calculated with 1-methyladenosine and/or alpha fetal protein (AFP). The higher area under curve value was achieved in 1-methyladenosine group than AFP group (0.802 vs. 0.592), and the diagnostic model combining 1-methyladenosine with AFP exhibited significant improved sensitivity, which could identify those patients who missed the diagnosis of HCC by determining serum AFP alone. Overall, these results suggested that LC/MS-based metabonomic study is a potent and promising strategy for identifying novel biomarkers of HCC.
Keywords: Biomarker, Liquid chromatography–mass spectrometry, Metabonomics, Hepatocarcinoma
Introduction
Metabonomics that was defined as a powerful quantitative tool and employed toward the understanding of global systems biology has become widespread in recent years [1]. It mainly focuses on the comprehensive and semi-quantitative study of metabolites in a biological system at a specified time in specific environmental conditions [2]. In contrast to genomics, transcriptomics, and proteomics, which address macromolecules with similar chemical properties, such as DNA, RNA, and proteins, metabonomics analysis deals with diverse properties of low molecular weight bio-compounds. It has been shown to be an effective tool for biomarker screening [3–6], disease diagnosis and prognosis [7–10], and characterization of metabolic network [11, 12]. As metabonomics is the downstream product of genomics and proteomics, it is also regarded as the complement of other “omics” for interpretation of gene functions (functional genomics) [11, 13].
Metabonomic studies generally employ such techniques as nuclear magnetic resonance spectroscopy, Fourier-transform infrared (FT/IR) spectroscopy, and gas chromatography/mass spectrometry (GC/MS) or liquid chromatography (LC)/MS [14]. Among them, LC/MS is regarded as the most powerful technology in drug metabolites analysis. Recently, it has been considered as an ideal tool for the screening of metabolites and biomarkers [15], for its distinguished advantages including reproducible quantitative analysis, and the ability to analyze biofluids with extreme molecular complexity. Some potential biomarkers in serum and urine of cancer patients have been successfully identified by applying LC/MS-based technology [16, 17].
Hepatocarcinoma (HCC) is among the leading causes of cancer death globally. Late diagnosis of HCC is the key factor for the poor survival of patients. To date, the vast majority of HCC patients are firstly identified by imaging or serological method. However, the resolution and accuracy of current imaging facility remain disappointingly low for HCC early diagnosis. The sensitivity of the most common used HCC biomarker, alpha fetal protein (AFP), is limited to ∼70% in clinic. The liver is the most important metabolic organ in the human body, and the metabolic profile variation was accepted to occur prior to the image diagnosis in HCC patients. Herein, we examined the serum metabolites patterns of HCC patients and normal controls by performing LC/MS methods, and identified some potential biomarkers which might be applied to distinguish HCC patients from healthy individuals at early stage.
Experiments and methods
Patient recruitment and sample collection
Informed consent and ethical committee approval was obtained from every participant. Thirty-eight healthy participants and 41 hospitalized patients with histopathologically confirmed HCC in First Affiliated Hospital of Zhejiang University were enrolled in this study. The average age is 55 years old in patients and 35 years old in healthy controls. In patients, ratio of male to female is approximately 2:1, and in healthy controls, the ratio is nearly 1.7:1. Serum samples were collected in the department of laboratory medicine of the hospital, and the levels of ALT, AFP, and HBV-DNA were determined. Olympus Au560 automatic biochemistry analyzer was applied to measure the level of serum alanine amino transferase (ALT). Serum AFP level was tested by enzyme-linked immunosorbent assay according to the manufacturer’s protocol (Bio-Rad, USA). HBV (hepatitis B virus)-DNA load in serum was quantified by real-time polymerase chain reaction (PCR) assays using ABI PRISM 7300 sequence detector (Applied Biosystems, USA).
Sera specimen pretreatment
Prior to LC/MS analysis, 200 μL of acetonitrile was added to 200 μL of the serum samples and vortex vigorously for 2 min. The sample mixture was allowed to stand for 5 min and centrifuged at 13,000 rpm for 10 min at 4 °C. The supernatant was then concentrated to complete dryness in a turbovap nitrogen evaporator (Zymax corp. USA). Sixty microliters of a mixture of acetonitrile–water (1:1, v/v) was added to each of the dried serum extracts, vortex-mixed for 1 min, and subsequently centrifuged at 13,000 rpm for 10 min at 4 °C. Fifty microliters supernatant was then subjected to LC/MS analysis.
Liquid chromatography separation
Chromatographic separation was performed on an Acquity UPLCTM system (Waters Corp., USA) equipped with a 2.1 × 50-mm symmetry C18 reversed-phase column with BEH (ethylene-bridged hybrid) particle size 1.7 μm (Milford, MA, USA). The mobile phase was a mixture of acetonitrile–water (1:1, v/v) buffer containing 0.1% formic acid. The column was equilibrated and eluted under isocratic conditions with a flow rate of 0.2 mL/min. The column was maintained at 4 °C, and the injection volume was 5 μL.
Mass spectrometric assay
A MS–MS mass spectrometer (Quattro Premier XE, Waters Corp., USA) was employed for analysis of metabolite ions. Ionization was achieved using electrospray in the positive mode with the spray voltage set at 3,000 V. Nitrogen was used as nebulizer gas, and nebulizer gas was delivered at a flow rate of 16 L/h with a source temperature of 120 °C. Desolvation gas (nitrogen) was heated to 250 °C and delivered at a flow rate of 400 L/h. Masses were acquired from m/z 200 to 2,000.
Data processing and pattern recognition
The experimental data of LC/MS were reformed into a matrix including time, ion mass (m/z), and intensity. Baseline correction and peak finding were carried out by using our matlab code (MATLAB 7.0, MathWorks, USA). Maximal spectrum of continuous wavelet transform (MSCWT) was employed to correct baseline and detect peak positions [18]. The peak alignment was carried out utilizing the method described in literature [19]. The MS analysis system was applied to identify the characteristic metabolite corresponding to the featured peak in database of Metlin (http://metlin.scripps.edu) [20] and HMDB (http://www.hmdb.ca/) [21]. The hit metabolites were verified by text mining techniques.
Principal component analysis (PCA) was performed to cluster the samples (MATLAB software, MathWorks, USA). The score plots allowed the visualization of data and compared samples between the test group and control group. Diagnostic model was constructed with the marker metabolites alone or combining AFP, using linear discrimination analysis method. The classification performance (specificity and sensitivity) was assessed by ACC value of the receiver operating characteristic (ROC) curves.
Results and discussion
Comparison of transaminase, AFP, and HBV-DNA load between HCC patients and healthy controls
The elevation of serum ALT and AST (aspartate aminotransferase) indicates the liver injury, which could be caused by hepatitis virus infection, drugs abuse, toxins intake, or hepatic ischemia–reperfusion. Serum ALT level of the control group was lower than that of HCC group (11.71 ± 6.26 vs. 69.84 ± 60.04, p < 0.01). Similar result was also achieved on the level of serum AST (18.13 ± 6.42 vs. 109.22 ± 99.28, p < 0.05). Elevation of ALT and AST might be due to the infection of HBV, whereas there was no significant difference on the HBV-DNA load between high and low ALT subgroups of HCC patients (p > 0.05, t test). Moreover, the serum levels of AFP were measured in HCC patients and healthy controls. The positive rate of AFP in the patients of HCC group was 75% with the cut-off value setting as 20 ng/mL [22], and none was positive in the patients of control group. It should be noted that 25% of the patients missed the diagnosis of HCC when AFP measurement was performed alone. Therefore, it is necessary to identify one or more biomarkers to improve the laboratory diagnosis of HCC. We expected that some serum metabolites, which were influenced by impaired hepatic function [23], might be developed as the diagnostic biomarker for HCC.
Distinct serum metabonomic profiles of HCC patients
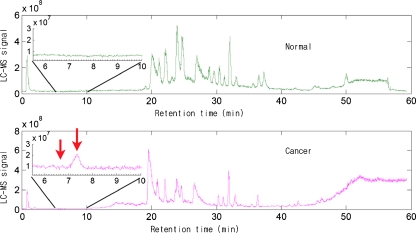
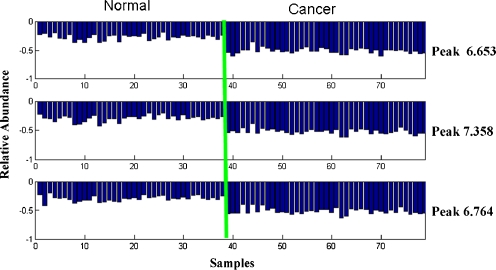
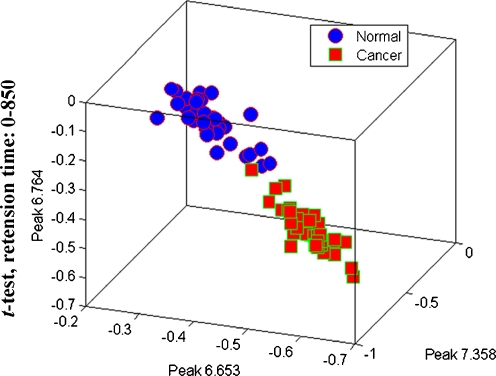
Representative chromatogram of a case from control group was shown in Fig. 1. Following baseline correction and peak alignment, metabolites signals were obtained in all. T-score method [24] was applied to identify the featured peaks that were different between HCC patients and the control individuals. All of the peaks were sorted with p value of t test. Top ten peaks that possess the least p value were considered as featured peaks (Table 1). For those featured peaks, the p values were far less than the significant difference level (p < 0.05). Intriguingly, each of the three metabolites represented by the fore three featured peaks (6.653, 7.358, and 6.764 min) displayed a significant elevated level in HCC patients compared with healthy controls (Fig. 2). SNR (ratio of signal to noise) analysis of the three peaks further confirmed that they were true signal (SNR ≥ 3) instead of noise (SNR ≈ 1) and were detectable by MS (SNR7.358 = 7.9, SNR6.653 = 3.4, SNR6.764 = 4.4) [25, 26]. More importantly, samples of HCC and control groups could be well separated using the three featured peaks together, which suggests that these metabolites might be potential HCC biomarkers in serum (Fig. 3).
Fig. 1.
Representative LC/MS total ion chromatograms of serum sample from a normal individual and a HCC patient
Table 1.
The characteristic peaks of HCC samples
| Peak retention time | p value (t test) | Distance (HCC and normal) |
|---|---|---|
| 2.78 | 4.11E − 24 | 0.13126995 |
| 2.947 | 2.01E − 20 | 0.028912113 |
| 6.412 | 1.04E − 16 | 0.007838236 |
| 6.542 | 3.70E − 18 | 0.138559594 |
| 6.579 | 5.98E − 18 | 0.004900794 |
| 6.653 | 2.57E − 18 | 0.072035253 |
| 6.672 | 3.11E − 19 | 0.088778169 |
| 6.764 | 2.60E − 19 | 0.009222483 |
| 7.246 | 2.06E − 19 | 0.16321364 |
| 7.358 | 1.71E − 19 | 0.016046921 |
Fig. 2.
Relative serum levels of the three characteristic peaks in HCC and normal samples
Fig. 3.
T-test scores plot discriminating HCC samples from normal controls based on the raw data of peaks 6.653, 6.764, and 7.358. Blue dot: normal sample; red dot: HCC samples
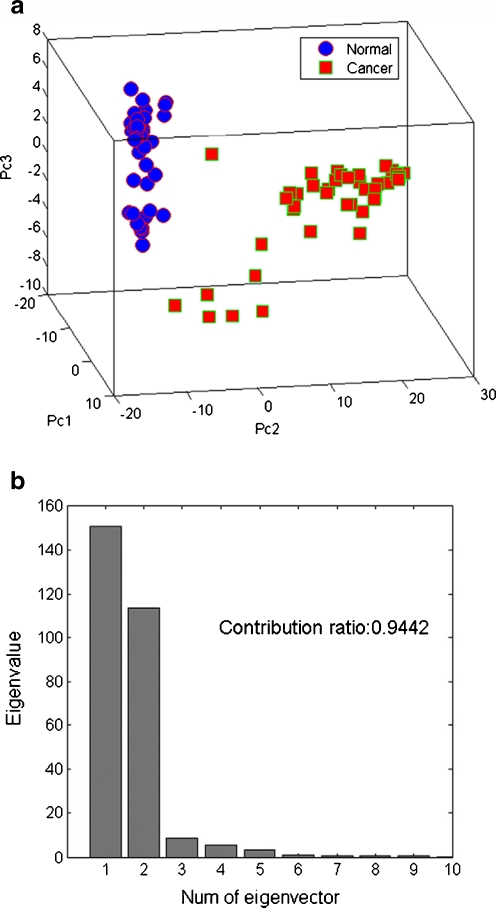
PCA is an unsupervised projection method usually used in clustering samples [27, 28]. In this work, PCA was also employed in clustering the LC/MS data, and the scores plot of the first three principal components that were in line with the peak 6.653, 7.358, and 6.764 was shown in Fig. 4a. HCC samples and the controls were well clustered in the score plot. The sum contribution ratio of the fore three peaks was more than 0.94 (Fig. 4b), which indicates that joint application of the three peaks is sufficient in differentiating HCC patients from healthy individuals.
Fig. 4.
(a) PC scores plot discriminating HCC samples from normal controls based on ten characteristic peaks. Blue dot: normal sample; red dot: HCC samples. (b) The first three principal components have a contribution ratio of 94.42%
Validation of 1-methyladenosine as potential biomarker of HCC
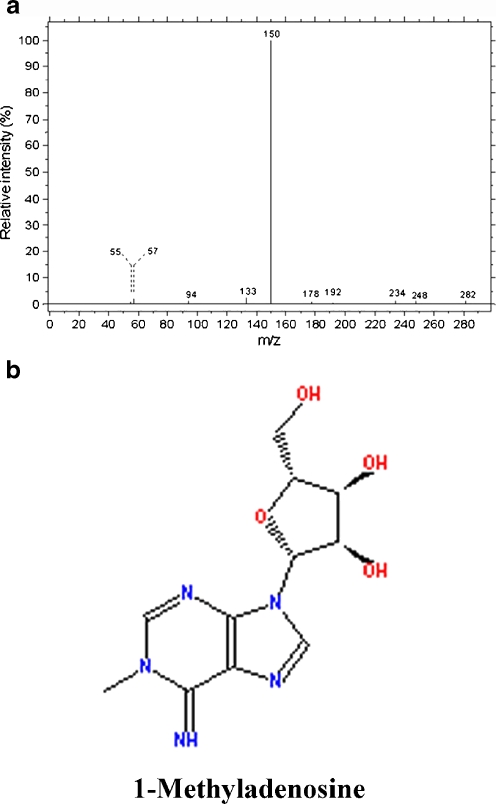
In metabonomic studies, identification of biomarkers that can differentiate patients from healthy individuals in clinical test is of great value. With this report, we combined database searching with literature mining in inferring the metabolites corresponding to the featured peaks. The inferred metabolites that were indicated by the first three featured peaks were shown in Table 2. There was no matched metabolite for peak 6.653 and 6.764 in databases of Metlin. As shown in Fig. 5, the molecular ion of the metabolite at 7.358 min peaked at 282 m/z and the intensity fraction peaked at 150 m/z, exhibiting a well match to the mass spectrum of 1-methyladenosine in HMDB (http://www.hmdb.ca/). The result of literature mining in PubMed suggested that 1-methyladenosine is associated with liver cancer (PMID: 19399767, 7562399, 1823269, 3711674, and 7139605). Collectively, our data indicated that 1-methyladenosine could be a potential serum biomarker for HCC.
Table 2.
Serum metabolites of characteristic peaks of HCC samples
| Peak | m/z | Metabolite |
|---|---|---|
| 6.653 | 249 | Unknown |
| 6.764 | 229 | Unknown |
| 7.358 | 281 | 1-Methyladenosine |
Fig. 5.
(a) Mass spectrum analysis of the metabolite corresponding to the peak at 7.358 min. (b) The molecular formula of 1-methyladenosine
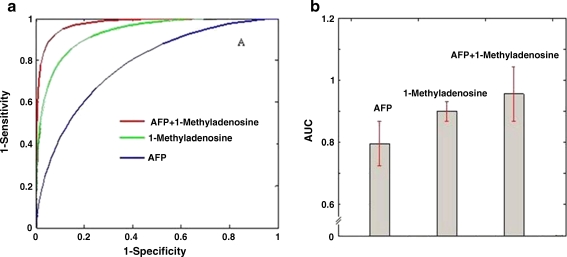
To validate the significance of 1-methyladenosine as a potential HCC biomarker, ROC curve is plotted assuming the levels of 1-methyladenosine follow a normal distribution in two groups. Area under the curve (AUC) is calculated using the trapezoidal rule. As shown in Fig. 6a, b, 1-methyladenosine displayed higher AUC value than that of AFP or HBV-DNA. Furthermore, combination of 1-methyladenosine and AFP achieved the highest AUC value of 0.95. These data implied that the new diagnostic model combining 1-methyladenosine with AFP possesses improved sensitivity and could identify those patients who missed the diagnosis of HCC by determining serum AFP alone.
Fig. 6.
(a) ROC analysis was performed using the values of 1-methyladenosine, AFP, HBV-DNA, or 1-methyladenosine plus AFP. The normal distribution functions of two groups (HCC and control) were established by estimating mean and variance, with which the receiver–operator characteristic (ROC) curve was plotted
Clinical correlation of 1-methyladenosine
1-Methyladenosine is a methylated nucleotide containing purine bases. The modifications are the results of the catalytic reaction triggered by the methylation-associated enzymes. The urine levels of 1-methyladenosine has been reported to be higher in preoperative patients with ovarian or breast cancer [29, 30]. However, no significant difference of 1-methyladenosine was found in urine between HCC patients and healthy controls [31]. In the present study, receiver–operator curves were calculated with serum 1-methyladenosine and/or AFP. The higher ACC value was achieved in 1-methyladenosine group than AFP group, and the diagnostic model combining 1-methyladenosine with AFP showed significant improved sensitivity, which could identify the patients missed the diagnosis of HCC by determining serum AFP alone. Thus, higher levels of serum methyladenosine should been regarded as the additional diagnostic marker for HCC, in particular, combined with the determination of serum AFP. Levels of methylated purines were found to be elevated in cancer patients due to the presences of hyperactive methyltransferases [32]. Therefore, the increase of 1-methyladenosine in HCC samples may be due to the hyperactivation of methyltransferases, which was followed by the nucleotides modification in response to inflammatory stress or oxidative DNA damage.
Conclusion
LC/MS method has been proven to be a powerful and reliable analytic platform for serum or plasma metabolites screening with relative high sensitivity. A LC/MS-based integrated analytical method was developed in this study to identify the characteristic metabolites which have the capability to distinguish HCC patients from healthy individuals. As a result, 1-methyladenosine achieved high AUC value of 0.90 and was characterized as the potential biomarker of HCC. Furthermore, the combination of 1-methyladenosine and AFP even achieved the AUC value up to 0.95. These data suggested that the metabolites may be identified as potential HCC biomarkers, and some of which could be applied in the screening of HCC high-risk population or the early diagnosis of patients in clinic.
Acknowledgements
The work was supported by The National Basic Research Program (2007CB512905), National Natural Science Fund (30571664), and The State S&T Projects of 11th Five Year (2008ZX10002-007). The authors also thank Hua-Zong Zeng at Sensichip Tech@infor Co. Ltd. for the assistance in bio-information analysis.
Open Access
This article is distributed under the terms of the Creative Commons Attribution Noncommercial License which permits any noncommercial use, distribution, and reproduction in any medium, provided the original author(s) and source are credited.
References
- 1.Rochfort S. J Nat Prod. 2005;68:1813. doi: 10.1021/np050255w. [DOI] [PubMed] [Google Scholar]
- 2.Fiehn O. Compar Funct Genom. 2001;2:155. doi: 10.1002/cfg.82. [DOI] [PMC free article] [PubMed] [Google Scholar]
- 3.Xue R, Lin Z, Deng C, Dong L, Liu T, Wang J, Shen X. Rapid Commun Mass Spectrom. 2008;22:3061. doi: 10.1002/rcm.3708. [DOI] [PubMed] [Google Scholar]
- 4.Bogdanov M, Matson WR, Wang L, Matson T, Saunders-Pullman R, Bressman SS, Flint Beal M. Brain. 2008;131:389. doi: 10.1093/brain/awm304. [DOI] [PubMed] [Google Scholar]
- 5.Chen J, Zhao X, Fritsche J, Yin P, Schmitt-Kopplin P, Wang W, Lu X, Haring HU, Schleicher ED, Lehmann R, Xu G. Anal Chem. 2008;80:1280. doi: 10.1021/ac702089h. [DOI] [PubMed] [Google Scholar]
- 6.Wu H, Xue R, Dong L, Liu T, Deng C, Zeng H, Shen X. Anal Chim Acta. 2009;648:98. doi: 10.1016/j.aca.2009.06.033. [DOI] [PubMed] [Google Scholar]
- 7.Claudino WM, Quattrone A, Biganzoli L, Pestrin M, Bertini I, Leo A. J Clin Oncol. 2007;25:2840. doi: 10.1200/JCO.2006.09.7550. [DOI] [PubMed] [Google Scholar]
- 8.Wikoff WR, Gangoiti JA, Barshop BA, Siuzdak G. Clin Chem. 2007;53:2169. doi: 10.1373/clinchem.2007.089011. [DOI] [PubMed] [Google Scholar]
- 9.Yang J, Xu G, Hong Q, Liebich HM, Lutz K, Schmulling RM, Wahl HG, Chromatogr J. B Analyt Technol Biomed Life Sci. 2004;813:53. doi: 10.1016/j.jchromb.2004.09.023. [DOI] [PubMed] [Google Scholar]
- 10.Wua H, Xuea R, Lub C, Deng C, Liua T, Zeng H, Wang Q, Shen X. J Chromatography B. 2009;877:3111. doi: 10.1016/j.jchromb.2009.07.039. [DOI] [PubMed] [Google Scholar]
- 11.Raamsdonk LM, Teusink B, Broadhurst D, Zhang NS, Hayes A, Walsh MC, Berden JA, Brindle KM, Kell DB, Rowland JJ, Westerhoff HV, van Dam K, Oliver SG. Nat Biotechnol. 2001;19:45. doi: 10.1038/83496. [DOI] [PubMed] [Google Scholar]
- 12.Soga T, Ohashi Y, Ueno Y, Naraoka H, Tomita M, Nishioka T. J Proteome Res. 2003;2:488. doi: 10.1021/pr034020m. [DOI] [PubMed] [Google Scholar]
- 13.Fiehn O, Kopka J, Dormann P, Altmann T, Trethewey RN, Willmitzer L. Nat Biotechnol. 2000;18:1157. doi: 10.1038/81137. [DOI] [PubMed] [Google Scholar]
- 14.Dunn WB, Bailey NJ, Johnson HE. Analyst. 2005;130:606. doi: 10.1039/b418288j. [DOI] [PubMed] [Google Scholar]
- 15.Wilson ID, Plumb R, Granger J, Major H, Williams R, Lenz EA. J Chromatogr B. 2005;817:67. doi: 10.1016/j.jchromb.2004.07.045. [DOI] [PubMed] [Google Scholar]
- 16.Yin PY, Zhao XJ, Li QR, Wang JS, Li JS, Xu GW. J Proteome Res. 2006;5:2135. doi: 10.1021/pr060256p. [DOI] [PubMed] [Google Scholar]
- 17.Zhao XJ, Wang WZ, Wang JS, Yang J, Xu GW. J Sep Sci. 2006;29:2444. doi: 10.1002/jssc.200600157. [DOI] [PubMed] [Google Scholar]
- 18.Trygg J, Holmes E, Lundstedt T. J Proteome Res. 2007;6:469. doi: 10.1021/pr060594q. [DOI] [PubMed] [Google Scholar]
- 19.Smith CA, Want EJ, O’Maille G, Abagyan R, Siuzdak G. XCMS: processing mass spectrometry data for metabolite profiling using nonlinear peak alignment, matching, and identification. Anal Chem. 2006;78(3):779. doi: 10.1021/ac051437y. [DOI] [PubMed] [Google Scholar]
- 20.Smith CA, O’Maille G, Want EJ, Qin C, Trauger SA, Brandon TR, Custodio DE, Abagyan R, Siuzdak G. METLIN: a metabolite mass spectral database. Ther Drug Monit. 2005;27:747. doi: 10.1097/01.ftd.0000179845.53213.39. [DOI] [PubMed] [Google Scholar]
- 21.Wishart DS, Tzur D, Knox C, Eisner R, Guo AC, Young N, Cheng D, Jewell K, Arndt D, Sawhney S, Fung C, Nikolai L, Lewis M, Coutouly MA, Forsythe I, Tang P, Shrivastava S, Jeroncic K, Stothard P, Amegbey G, Block D, Hau DD, Wagner J, Miniaci J, Clements M, Gebremedhin M, Guo N, Zhang Y, Duggan GE, Macinnis GD, Weljie AM, Dowlatabadi R, Bamforth F, Clive D, Greiner R, Li L, Marrie T, Sykes BD, Vogel HJ, Querengesser L. HMDB: the Human Metabolome Database. Nucleic Acids Res. 2007;35(Database issue):521. doi: 10.1093/nar/gkl923. [DOI] [PMC free article] [PubMed] [Google Scholar]
- 22.Yu K, Sheng G, Sheng J, Chen Y, Xu W, Liu X, Cao H, Qu H, Cheng Y, Li L. J Proteome Res. 2007;6:2413. doi: 10.1021/pr060591d. [DOI] [PubMed] [Google Scholar]
- 23.Robertson DG, Reily MD, Baker JD. J Proteome Res. 2007;6:526. doi: 10.1021/pr060535c. [DOI] [PubMed] [Google Scholar]
- 24.Tibshirani R, Hastie T, Narashiman B, Chu G. Diagnosis of multiple cancer types by shrunken centroids of gene expression. Proc. Natl Acad Sci USA. 2002;99:6567. doi: 10.1073/pnas.082099299. [DOI] [PMC free article] [PubMed] [Google Scholar]
- 25.James EB, Gordon AA, Jenny W, Richard H, Richard DS. Anal Chem. 1999;71:2595. doi: 10.1021/ac990231s. [DOI] [PubMed] [Google Scholar]
- 26.Kim KH, Kim SJ. IEEE Trans Biomed Eng. 2003;50:999. doi: 10.1109/TBME.2003.814523. [DOI] [PubMed] [Google Scholar]
- 27.Anthony ML, Rose VS, Nicholson JK, Lindon JC. J Pharm Biomed. 1995;13:205. doi: 10.1016/0731-7085(95)01278-S. [DOI] [PubMed] [Google Scholar]
- 28.Beckonert O, Bollard ME, Ebbels TMD, Keun HC, Antti H, Holmes E, Lindon JC, Nicholson JK. Anal Chim Acta. 2003;490:3. doi: 10.1016/S0003-2670(03)00060-6. [DOI] [Google Scholar]
- 29.Cho SH, Choi MH, Lee WY, Chung BC. Clin Biochem. 2009;42:540. doi: 10.1016/j.clinbiochem.2008.12.026. [DOI] [PubMed] [Google Scholar]
- 30.Woo HM, Kim KM, Choi MH, Jung BH, Lee J, Kong G, Nam SJ, Kim S, Bai SW, Chung BC. Clin Chim Acta. 2009;400:63. doi: 10.1016/j.cca.2008.10.014. [DOI] [PubMed] [Google Scholar]
- 31.Jeng LB, Lo WY, Hsu WY, Lin WD, Lin CT, Lai CC, Tsai FJ. Rapid Commun Mass Spectrom. 2009;23:1543. doi: 10.1002/rcm.4034. [DOI] [PubMed] [Google Scholar]
- 32.Park RW, Holland JF, Jenkins R. Cancer Res. 1962;22:469. [PubMed] [Google Scholar]


