

Abstract
Aim
The Framework Programmes for Research and Technological Development (FP) are the European Union’s funding programmes for research in Europe. The study analyses the features of external experts involved in evaluating the research proposals in FP6 (years 2003–2006) in the area of Life Sciences.
Subjects and methods
Experts were analysed with respect to nationality, gender, organisational affiliation and rotation. The correlations between the number of experts by nationality and scientific research indicators were also explored.
Result
Experts from 70 countries participated, with 70% coming from 10 countries. The gender composition was relatively stable, with approximately 30% of female experts. The majority of experts came from higher education establishments (51%) and 12% from industry. About 40% of experts participated in the evaluation process two or more times. The number of experts by nationality was linearly correlated with gross national income (r = 0.95, p < 0.0001), population (r = 0.91, p < 0.0001), and number of research publications in health sciences (r = 0.93, p < 0.0001). However, using multiple linear regression analysis, only gross national income had partial regression coefficients significantly different from zero (p = 0.017). The observed value of experts for Italy (312) and Belgium (155) were higher than predicted by this regression model (231 and 71 respectively).
Conclusion
The expert panels involved were balanced with respect to nationalities, whereas the gender distribution was lower than the target. There was a satisfactory degree of rotation of experts between evaluation rounds. The percentage of experts from industry was lower than expected.
Keywords: Framework programs, Evaluators, European commission, Health research, Peer review
Introduction
The Framework Programmes for Research and Technological Development (FP) are European Union (EU) funding programmes designed to address major basic and applied research projects in Europe. The budgets of the FPs have increased steadily since the first FP was introduced in 1984, and the current seventh FP (FP7, 2007–2013) has an average annual budget of more than 7 billion € (Andrè 2006; European Commission 2007).
The specific objectives and funding instruments have changed between the consecutive FPs, but continue to keep a strong emphasis on supporting collaborative, multidisciplinary research between research teams in different countries. The FPs are open to all types of research organisations, promoting scientific collaboration between researchers in universities, industry, small and medium enterprises (SMEs), research centres and public authorities (European Commission 2007).
Research grants from the FPs are awarded on the basis of applications submitted to specific calls for proposals. The eligible applications undergo a rigorous peer review process in order to select the best proposals for potential funding by the European Commission (EC). The final funding decisions are made using a range of criteria, including excellent scientific quality, potential scientific and societal impact, quality of the management team, portfolio balance, and relevance to the overall objectives of the FP. As a consequence, the most important factor for the funding decision is the result of the peer review by independent experts (European Commission 2008a). In the thematic area of health, proposals undergo a first review in a remote step, where a number of experts are individually evaluating and scoring the proposals. In a second phase, the experts meet in consensus groups to reach agreement regarding the scoring and ranking of submitted research proposals. This results in a prioritised ranking list of the submitted proposals, and a recommendation to the EC for funding.
The peer review of proposals by external experts is a crucial step in the funding decision process of the EC. It is therefore critical that the evaluation process is carried out according to the highest possible standards with respect to scientific competence, fairness, and integrity. The roles and actions of independent experts are put forward by EU guidelines (European Commission 2008a, 2005, 2006a, 2002a). The EC maintains the database of potential experts who can be called upon to assist with peer reviews. The database is open to auto-registration, with no formal assessment or validation (CORDIS 2007). The EC encourages research institutions to submit lists of proposed experts who could be called to assist the Commission in the proposal evaluation process (European Commission 2006a), and world-class experts to register as experts. In any case, experts participate in their own personal capacity, rather than representing the organisation with which they are affiliated (European Commission 2006a).
The information required for registration of candidate experts is structured in order to have an easily searchable database, where information is selected predominantly from pre-defined lists (“closed” questions). Every time a round of reviews is scheduled, experts are drawn from the database using a variety of search criteria such as keywords related to the research area concerned. Experts are then analysed individually, and the EC draws up a list of appropriate independent experts, using the following selection criteria: (1) a lack of conflict of interest; (2) an appropriate range of competencies, expertise and experience; (3) a reasonable balance between academic and industrial expertise; (4) a distribution of geographical origins; and (5) a reasonable gender balance (European Commission 2008a; European Commission 2006a; European Commission 2002a). Furthermore, a principle of “regular rotation” is applied to the selection of experts in order to avoid that the same individuals bring the same views, expertise and arguments within evaluations. The whole process is monitored externally and reviewed for all calls for proposals by independent observers (Catenhusen, Grimaud and Horvat 2007; Cahill and Horvat 2008).
The aim of this paper is to review and assess the pool of external evaluators with respect to their country of origin, type of affiliation, gender and renewal of experts called to participate to panels (rotation). In addition, we examined as to whether the geographical distribution of experts could be correlated with national indicators such as national size, wealth and breadth of scientific research. The analysis has been limited to the activity area 1 “Life sciences, genomics and biotechnology for health” for FP6 (European Commission 2002b).
Methods
Preparation of experts’ data
Lists of experts that participated in the evaluation of proposals were downloaded from the CORDIS website, where they are posted yearly (CORDIS 2006). All lists for the activity area 1 “Life sciences, genomics and biotechnology for health” of FP6 (years 2003–2006) were downloaded and analysed. Evaluations for FP6 calls from year 2002 were held in 2003. For each expert, the following basic information was available in the published lists: name, gender, nationality, organisation and organisation type. Data were reviewed to ensure consistency from one year to the next, and for possible errors, including screening of the names and affiliations of experts for variants of the same name. An extensive effort was also made to review and validate the type of organisation which the experts were affiliated to. All organisations where the word “university” appeared in the organisation name were, for example, classified as “higher education establishment”.
National research indicators and statistical analyses
The possible correlation between the number of experts by nationality, scientific research indicators or other features of nations was explored. The indicators included: (1) population; (2) gross national income (GNI) (World Bank 2010; King 2004); and (3) numbers of published articles (years 2000–2004) in fields pertaining to health sciences—biology, biochemistry, clinical medicine, immunology, microbiology, molecular biology, genetics, neurosciences and behaviour, pharmacology, psychology and psychiatry (Thomson Reuters 2010).
Descriptive statistics were presented as medians with inter-quartile ranges (IQR). Where indicated, statistical significance was tested with chi-square test on frequency tables (Analyse-it for Microsoft Excel, Version 2.11, Analyse-it Software Ltd., 2008). Pearson’s correlation coefficient r and bivariate or multiple linear regression were computed using SPSS Statistics 17.0 (SPSS Inc., USA).
Results
Nationalities and gender of experts
During the 4-year period of FP6, the EC used a total of 3,057 expert evaluations to assess research proposals submitted for funding in the area of Life Sciences. In 2003, 799 expert evaluations were used, 983 in 2004, 672 in 2005 and 603 in 2006. Experts came from 70 different nations but 70% of all experts came from just 10 countries, and 22 nations contributed comprising 90% of the experts (Table 1). During the course of FP6, 12 new countries (EU-12 new) joined the EU. We therefore examined whether the proportion of experts from the new Member States increased during the period, but no clear evidence of this was found (Fig. 1).
Table 1.
Experts divided by nationality and gender
| Nationality of Expert | Male | Female | Total | |||
|---|---|---|---|---|---|---|
| n | (%) | n | (%) | n | (% total) | |
| Germany | 275 | (84) | 51 | (16) | 326 | (10.7) |
| Italy | 208 | (67) | 104 | (33) | 312 | (10.2) |
| United Kingdom | 225 | (73) | 84 | (27) | 309 | (10.1) |
| United States | 231 | (79) | 62 | (21) | 293 | (9.6) |
| France | 182 | (69) | 80 | (31) | 262 | (8.6) |
| Spain | 116 | (66) | 60 | (34) | 176 | (5.8) |
| Belgium | 117 | (75) | 38 | (25) | 155 | (5.1) |
| Netherlands | 120 | (90) | 14 | (10) | 134 | (4.4) |
| Sweden | 74 | (81) | 17 | (19) | 91 | (3.0) |
| Finland | 47 | (62) | 29 | (38) | 76 | (2.5) |
| Greece | 48 | (64) | 27 | (36) | 75 | (2.5) |
| Austria | 48 | (75) | 16 | (25) | 64 | (2.1) |
| Hungary | 34 | (59) | 24 | (41) | 58 | (1.9) |
| Israel | 37 | (67) | 18 | (33) | 55 | (1.8) |
| Ireland | 34 | (65) | 18 | (35) | 52 | (1.7) |
| Poland | 29 | (56) | 23 | (44) | 52 | (1.7) |
| Switzerland | 39 | (75) | 13 | (25) | 52 | (1.7) |
| Denmark | 35 | (69) | 16 | (31) | 51 | (1.7) |
| Canada | 39 | (89) | 5 | (11) | 44 | (1.4) |
| Australia | 34 | (81) | 8 | (19) | 42 | (1.4) |
| Portugal | 19 | (54) | 16 | (46) | 35 | (1.1) |
| Czech Republic | 26 | (76) | 8 | (24) | 34 | (1.1) |
| Slovenia | 17 | (57) | 13 | (43) | 30 | (1.0) |
| Japan | 22 | (88) | 3 | (12) | 25 | (0.8) |
| Norway | 21 | (95) | 1 | (5) | 22 | (0.7) |
| Estonia | 16 | (80) | 4 | (20) | 20 | (0.7) |
| Slovakia | 14 | (70) | 6 | (30) | 20 | (0.7) |
| Romania | 8 | (50) | 8 | (50) | 16 | (0.5) |
| Lithuania | 6 | (46) | 7 | (54) | 13 | (0.4) |
| Luxembourg | 6 | (50) | 6 | (50) | 12 | (0.4) |
| Malta | 1 | (9) | 10 | (91) | 11 | (0.4) |
| Argentina | 6 | (60) | 4 | (40) | 10 | (0.3) |
| Iceland | 9 | (90) | 1 | (10) | 10 | (0.3) |
| Russian Federation | 5 | (50) | 5 | (50) | 10 | (0.3) |
| Other 36 countriesa | 76 | (69) | 34 | (31) | 110 | (3.6) |
| Total | 2,224 | (73) | 833 | (27) | 3,057 | (100.0) |
| EU-15b | 1,554 | (73) | 576 | (27) | 2,130 | (69.7) |
| EU-12 newc | 161 | (61) | 104 | (39) | 265 | (8.6) |
| Non-EUd | 509 | (77) | 153 | (23) | 662 | (21.7) |
aThe experts from other nationalities were from: Latvia (8); Croatia, India, Turkey (7); British Indian Ocean Territory, China (6); Cameroon, Nigeria, Serbia, Uganda (5); Brazil, Colombia, Cyprus, Kenya, Singapore, South Africa, Ukraine, Venezuela (3); Algeria, Hong Kong, Malaysia, New Zealand, Pakistan, Sierra Leone, Zambia (2); Afghanistan, Chile, Costa Rica, Gabon, Lebanon, Nepal, Rwanda, Senegal, Thailand, Uruguay, Zimbabwe (1)
bEU-15: Austria, Belgium, Denmark, Finland, France, Germany, Greece, Ireland, Italy, Luxembourg, Netherlands, Portugal, Spain, Sweden, United Kingdom
cEU-12 new: in 2004 Cyprus, Czech Republic, Estonia, Hungary, Latvia, Lithuania, Malta, Poland, Slovakia, Slovenia; in 2007 Romania and Bulgaria
dNon-EU: all other nationalities
Fig. 1.

Percentages of experts from EU-15 (diamonds), EU-12 new Member States (triangles) and non-EU countries (squares), per year EU-15: Austria, Belgium, Denmark, Finland, France, Germany, Greece, Ireland, Italy, Luxembourg, Netherlands, Portugal, Spain, Sweden, United Kingdom; EU-12 new: countries that joined EU in 2004 (Cyprus, Czech Republic, Estonia, Hungary, Latvia, Lithuania, Malta, Poland, Slovakia, Slovenia) or 2007 (Romania and Bulgaria); non-EU: all other nationalities
The overall percentage of females among experts was 27%, and the gender distribution was stable throughout FP6. Participation of female evaluators was 24, 28, 29 and 28% respectively, for each year from 2003 to 2006. The gender proportion was more varied when analysing data by groups of countries. The percentage of females among experts from the EU-12 new countries was significantly higher than among experts from EU-15 (39% vs. 27%, p < 0.0001). For nations with at least 10 expert evaluators (the 34 nationalities listed in Table 1), the percentages of female experts ranged between 5 and 91%, with a median value 31% (IQR = 22%). Thirty-one per cent is also the value for all 70 nationalities (IQR = 40%).
Type of organisation
Table 2 summarises the affiliations of the recruited experts. More than half of all experts (50.6%) came from higher education establishments, while a quarter (25.5%) came from a variety of public research institutions. Experts from the private for-profit sector, including large companies, SMEs, consultancy firms and service providers, represent 11.9% of all evaluators.
Table 2.
Counts of evaluators by type of organization
| Type of organisation | n (%) |
|---|---|
| Higher education establishment | 1,547 (50.6) |
| Public | 769 (25.2) |
| Public research centre | 638 (20.9) |
| Non-research public sector | 75 (2.5) |
| International research centre | 34 (1.1) |
| Non-research international organisation | 22 (0.7) |
| Private non-profit | 216 (7.1) |
| Private non-profit research centre | 201 (6.6) |
| Non-research private non-profit | 15 (0.5) |
| Private for-profit | 365 (11.9) |
| Private/commercial research centre | 241 (7.9) |
| Consultancy firms | 74 (2.4) |
| Non-research commercial sector including SMEs | 50 (1.6) |
| Other | 160 (5.2) |
| Total | 3,057 (100) |
Table 3 shows the nationality of experts coming from different types of organisations in the EU countries (United Nations Statistics Division 2010). The highest percentage of university affiliations was found among the experts from northern EU (57%), whereas this group had the lowest percentage of experts from other areas of the public research sector (19%). Southern EU provided the highest percentage of experts from public (29%) and private non-profit organisations (12%). The highest percentages of experts from private for-profit organisations were among experts from northern (13%) and western EU (15%), whereas 9% of experts from southern and eastern EU came from this sector.
Table 3.
Types of organisations and geographical location of EU organisations
| Geographical division | Higher educ. establishments | Public | Private non-profit | Private for-profit | Other | Total | ||||||
|---|---|---|---|---|---|---|---|---|---|---|---|---|
| n | (%) | n | (%) | n | (%) | n | (%) | n | (%) | n | (%) | |
| North EUa | 321 | (57) | 110 | (19) | 25 | (4) | 72 | (13) | 41 | (7) | 569 | (100) |
| West EUb | 465 | (46) | 271 | (27) | 64 | (7) | 153 | (15) | 51 | (5) | 1,004 | (100) |
| East EUc | 111 | (53) | 54 | (26) | 8 | (4) | 20 | (9) | 17 | (8) | 210 | (100) |
| South EUd | 286 | (47) | 177 | (29) | 74 | (12) | 55 | (9) | 20 | (3) | 612 | (100) |
| Non EU countries | 364 | (55) | 157 | (23) | 45 | (7) | 65 | (10) | 31 | (5) | 662 | (100) |
| Total | 1,547 | (51) | 769 | (25) | 216 | (7) | 365 | (12) | 160 | (5) | 3,057 | (100) |
aNorth EU: United Kingdom, Sweden, Finland, Ireland, Estonia, Lithuania, Latvia
bWest EU: Germany, France, Belgium, Netherlands, Austria, Denmark, Luxembourg
cEast EU: Hungary, Poland, Czech Republic, Slovenia, Slovakia, Romania, Bulgaria
dSouth EU: Italy, Spain, Greece, Portugal, Malta, Cyprus
Rotation
The total number of expert evaluations used in FP6 was 3,057. However, the number of different experts was smaller as many individuals took part in more than one round of evaluations. When data was corrected for repeated participation, the number of different experts involved in FP6 for the area Life Sciences was 1,982. About 40% of experts were involved two or more times, while a large majority (1,192 experts, 60.1%) participating only once; 540 experts (27%) twice, 215 experts (11%) three times, and 35 experts (2%) appeared in all 4 years.
Correlation with national indicators
We performed a bivariate correlation analysis for a set of research and wealth indicators, and found that the number of experts by nationality was linearly correlated with gross national income (GNI: r = 0.95, p < 0.0001), population (r = 0.91, p < 0.0001), and number of research publications in health sciences (r = 0.93, p < 0.0001) in the EU countries.
However, using multiple linear regression to investigate the independent effects of individual factors, only GNI had partial regression coefficients significantly different from zero (Table 4). Analysis of standardised residuals, applied after multiple regression, showed that the observed value of experts for Italy (312) and Belgium (155) were significantly higher than predicted by this regression model (231 and 71 respectively). A bivariate linear regression of the number of experts versus GNI is depicted in Fig. 2 for illustrative purposes.
Table 4.
Multiple linear regression analysis of experts vs. national indicators
| Terma | Coefficient | 95% CI | t statistic | p |
|---|---|---|---|---|
| GNI (billions PPP $) | 0.14 | 0.03 to 0.25 | 2.54 | 0.017 |
| Population (millions) | –1.03 | –3.56 to 1.51 | –0.83 | 0.413 |
| Articles (thousands) | 0.45 | –0.33 to 1.22 | 1.18 | 0.248 |
aIntercept 20.9 (CI 7.1–34.8); CI confidence intervals; F statistic for multiple regression: 105.62 (p < 0.0001)
Fig. 2.
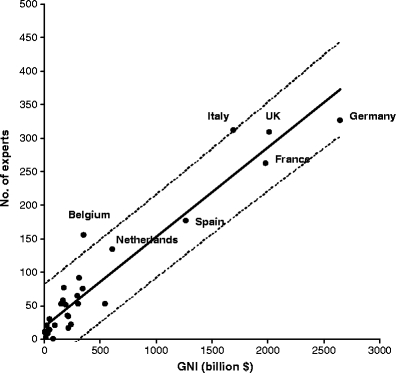
Linear regression analysis of number of experts vs. Gross National Income. Solid line: linear model fit; Dashed lines: prediction interval at 95% confidence level. Only data points corresponding to the first seven EU nations of Table 1 are labelled
Discussion
Peer-review evaluations are a core element of funding decisions by most major research funding agencies. The overall approach of the evaluation process for the FP has been favourably reviewed by independent observers on recurring occasions (Catenhusen, Grimaud and Horvat 2007; Cahill and Horvat 2008). However, little statistical information about the pool of experts involved in the evaluations has been available until now. There are very few quantitative comparisons in the evaluation process between different agencies, national and international. The quantitative information that is available is generally part of larger studies in which the evaluation process is not the core focus. Comparison of different evaluation systems is difficult, if not impossible, because they are established according to varying approaches and objectives. The present study sought to provide quantitative information about the evaluation system and, in particular, the characteristics of the evaluators involved in the EC peer-review process.
It is a stated goal of the EC to increase the number of women participating as experts for the FP evaluations towards a suggested target of at least 40% (European Commission 2008b). The hypothesis was that this would potentially lead to an increased number of female participants in FP7 proposals. The present analysis found that the overall percentage of female evaluators was 27%. This reflects an evident gender imbalance as a whole in science and research where women are clearly under-employed (Klinge 2008). Across the EU, 29% of researchers are women, although the proportion of female researchers in medical sciences in the higher education sector of the EU-25 is 40% (European Commission 2006a). In 2006, the percentage of female evaluators of all evaluation panels of other themes of FP6 was 34% (European Commission 2008b). The gender disproportion which was shown in the present analysis had been repeatedly noted in other evaluations of proposals (Neugebauer 2006; Wenneras and Wold 1997). As a comparison, the overall percentage of women among the core reviewers in the US National Institute of Health (NIH) in the years 2003–2006 (corresponding to FP6) was 27.4% (Dumais, Lindquist and Malik 2004).
The shortage of women in the EC’s expert database forms a major obstacle for ensuring the gender balance of expert evaluation panels, although this situation has been significantly improved in recent years. In 2000, women accounted for only 16% of the experts registered in the EC’s expert database, whereas 26% of the experts in the database were women in 2006 (Laurila and Young 2001). It has been noted that in some cases when an expert’s evaluation experience is necessary, a preference was given to previously selected candidates; this may have formed a barrier against the inclusion of women as newcomers (Laurila and Young 2001). Furthermore, while gender balance is one of the criteria for evaluator selection, it is applied after the criteria of knowledge and geographical origin (Information 2001).
An important feature of the evaluation process is the type of organizations to which the expert evaluators are affiliated. Experts are recruited as individuals, but their affiliation may, nevertheless, indicate the type of experience and background they bring into the evaluation. Experts from higher education establishments comprised more than half of all experts, while an additional 25% came from various types of public research institutions. As a comparison, the percentage of reviewers from universities in the NIH panels (2003–2006, standing and non-standing reviewers) was 81.7% (Dumais et al. 2004). The overall percentage of experts coming from the private for-profit sector (“industry”) was 12% in FP6, but interestingly it increased from 10% in 2003 to 17% in 2006. This should be seen in the light of the stated target of the EC to involve industry, and particularly SMEs, in research activities funded under FP6. The increased number of experts with industry background could be a consequence of more research proposals with industry involvement, and thus requiring industry expertise for the evaluation. Independent observers stated that the contribution of industrial experts to the evaluation process was positive, increasing the diversity and perspectives of the evaluators especially with regard to the potential impact of the proposals (Cahill and Horvat 2008).
Use of the same experts in two or several rounds of proposal evaluations is considered a strength as well as a weakness. On one hand, it secures a certain degree of stability and consistency between separate evaluations; while on the other hand, the same scientific judgments may prevail in several evaluations to the detriment of new approaches. Funding agencies approach this issue differently. The NIH review system includes a core group of reviewers (roughly 20% of the total) and non-standing temporary reviewers who provide additional expertise needed to enhance the review of applications received in any given review round. There is no rotation schedule for non-standing reviewers, who are contacted to serve on an “as needed” basis (Dumais et al. 2004). In the EC system, a principle of “regular rotation” is applied, and a high turnover rate was consequently observed over the years in FP6. However, given the wide range of topics, it may not always be possible to find new evaluators with sufficient and specific expertise in a niche area. Experts with specific knowledge in a niche area, as well as broad expertise of their field, are therefore sometimes invited several times. However, only 2% of experts, corresponding to a total of 35 individuals, participated in evaluations in all 4 years of FP6. A more detailed analysis revealed that these experts were well-recognized experts in their field, having an average publication track of more than 40 publications in peer-reviewed journals during the last 10 years. Many of them had a highly specialized knowledge in a niche such as intellectual property right or vaccine manufacturing, whereas others displayed an uncommon combination of personal and professional background such as female scientists in industry or senior scientists from the new EU Member States.
The number of experts called from the different EU nations appeared to be correlated to country size (population), wealth (GNI) and scientific production (research articles). Multivariate analysis showed only a statistically significant correlation with wealth of the EU nations, meaning that the number of experts from a given EU country could be predicted by the GNI of the country. Only two countries, Belgium and Italy, contributed with a slightly larger number of experts than predicted by the GNI, whereas all other EU countries fell within the 95% confidence level. Geographical proximity and budget considerations could explain the somewhat larger representation of experts from Belgium, whereas a larger share of experts from Italy could be due to do a larger share of Italian candidacies in the expert database.
Conclusion
In conclusion, we found that over two thirds of the experts used for the evaluation of research proposals in the thematic area of “Life sciences, genomics and biotechnology for health” of FP6 came from 10 countries, and the number of experts from a given EU country seems proportional to the GNI of the country, except for Belgium and Italy. The majority of the experts came from higher education establishments, whereas 12% came from industry. The group of experts had a relatively constant and low percentage of women (27%), with the percentage comparable to other large research funders. The role and level of expert rotation was difficult to analyse due to the limited study period, but only a small percentage of experts were called on multiple occasions. It should be kept in mind that the present study was limited to a single thematic area, and the results can, therefore, not be considered representative for the EC research evaluation system for FP6 as a whole; however, some indications might be of use in future selections, especially in terms of gender proportion and the contribution of academic versus industrial expertise.
Evaluations can and should be studied quantitatively. This approach can be an important support tool to the extensive qualitative assessment and external auditing of evaluations already used by the EC, and can help highlight merits and weaknesses. Further study on quantitative aspects of the research evaluation process such as more accurate comparisons between different evaluation systems carried out by various research agencies, is necessary.
Acknowledgements
We gratefully acknowledge the observations and help of Dr A. Kopstein, Director of Planning, Analysis, and Evaluation, National Institutes of Health Center for Scientific Review, Bethesda, USA; Dr. R. F. Moore, Consultant, Office of Extramural Research, National Institutes of Health Center for Scientific Review, Bethesda, USA; and Dr. J. Yudenfreund Kravitz, Office of Research on Women’s Health, National Institutes of Health, Bethesda, USA, who made the present manuscript more detailed and thorough.
We are indebted to A. Cross, Directorate General for Research, European Commission, for his generous support and suggestions throughout the preparation of this paper.
Conflict of interest
None declared.
Open Access
This article is distributed under the terms of the Creative Commons Attribution Noncommercial License which permits any noncommercial use, distribution, and reproduction in any medium, provided the original author(s) and source are credited.
Footnotes
GianLuca Quaglio and Vincenzo Guardabasso contributed equally to the paper.
References
- Andrè M. L’Espace européen de la recherche: histoire d’une idée. J Eur Integr Hist. 2006;12:131–150. [Google Scholar]
- Cahill DJ, Horvat M (2008) Independent observers’ report. FP7 Cooperation Health. Evaluation FP7. Health 2007-B. ftp://ftp.cordis.europa.eu/pub/fp7/docs/independent-observers-report-healthb-20080211.pdf. Cited 10 September 2010
- Catenhusen WM, Grimaud JA, Horvat M (2007) Independent observers’ report. FP7 Cooperation Health. Evaluation FP7. Health 2007-A. http://cordis.europa.eu/fp7/health/library_en.html. Cited 10 September 2010
- CORDIS (Community Research and Development Information Service) (2006) Sixth Framework Programme. Lists of FP6 expert evaluators. http://cordis.europa.eu/fp6/experts.htm. Cited 10 September 2010
- CORDIS (Community Research and Development Information Service) (2007) Registration of experts for research activities. https://cordis.europa.eu/emmfp7/. Cited 10 September 2010
- Dumais C, Lindquist T, Malik KF (2004) CSR data book: basic data relating to the center for scientific review. CSR, National Institutes of Health, Bethesda, MD
- European Commission (2002a) The Sixth Framework Programme covers Community activities in the field of research, technological development and demonstration (RTD) for the period 2002 to 2006: guidelines on Proposal Evaluation and Selection Procedures. EC, Brussels. http://cordis.europa.eu/documents/documentlibrary/66623291EN6.pdf. Cited 10 September 2010
- European Commission (2002b) What is FP6? EC, Brussels. http://cordis.europa.eu/fp6/whatisfp6.htm. Cited 10 September 2010
- European Commission (2005) Regulation of the European Parliament and of the Council laying down the rules for the participation of undertakings, research centres and universities in actions under the Seventh Framework Programme and for the dissemination of research results (2007–2013). http://www.europarl.europa.eu/meetdocs/2004_2009/documents/com/com_com(2005)0705_/com_com(2005)0705_en.pdf. Cited 10 September 2010
- European Commission (2006a) Call addressed to individuals for the establishment of a database of prospective independent experts to assist the Commission’s services for tasks in connection with the Seventh RTD Framework Programme. OFF J EU 2006/C 305/16. http://www.nsfb.net/system/storage/c_30520061214en00520053.pdf. Cited 10 September 2010
- European Commission (2006b) She figures: women and science statistics and indicators. EC, Brussels. http://ec.europa.eu/research/science-society/pdf/she_figures_2006_en.pdf. Cited 10 September 2010
- European Commission (2007) Seventh Framework Programme (FP7). EC, Brussels. http://cordis.europa.eu/fp7/home_en.html. Cited 10 September 2010
- European Commission (2008a) Rules for submission of proposals, and the related evaluation, selection and award procedures. EC, Brussels. ftp://ftp.cordis.europa.eu/pub/fp7/docs/fp7-evrules_en.pdf. Cited 10 September 2010
- European Commission (2008b) Gender equality report: 6th Framework Programme. Research Directorate-General. Directorate L. Scientific Culture and Gender Issues Unit. http://ec.europa.eu/research/evaluations/pdf/archive/fp6-evidence-base/evaluation_studies_and_reports/evaluation_studies_and_reports_2008/fp6_gender_equality_report.pdf. Cited 10 September 2010
- Information Society (2001) Gender impact: assessment of the specific programmes of FP5. User-friendly Information Society. Directorate General for Research, EC, Brussels. ftp://ftp.cordis.europa.eu/pub/science-society/docs/genfp5_ist.pdf. Cited 10 September 2010
- King DA. The scientific impact of nations. Nature. 2004;430:311–316. doi: 10.1038/430311a. [DOI] [PubMed] [Google Scholar]
- Klinge I. Gender perspectives in European research. Pharmacol Res. 2008;58:183–189. doi: 10.1016/j.phrs.2008.07.011. [DOI] [PubMed] [Google Scholar]
- Laurila P, Young K (2001) Gender in research: gender impact: assessment of the specific programmes of the Fifth Framework Programme: an overview. Directorate General for Research, EC, Brussels. http://www.bmwf.gv.at/fileadmin/user_upload/wissenschaft/frauen/women_gender_impact_fp5_en.pdf. Cited 10 September 2010
- Neugebauer KM. Keeping tabs on the women: life scientists in Europe. PLoS Biol. 2006;4:e97. doi: 10.1371/journal.pbio.0040097. [DOI] [PMC free article] [PubMed] [Google Scholar]
- Thomson Reuters (2010) National science indicators. http://thomsonreuters.com/products_services/science/science_products/scholarly_research_analysis/research_evaluation/national_science_indicators. Cited 10 September 2010
- United Nations Statistics Division (2010) Composition of macro geographical (continental) regions, geographical sub-regions, and selected economic and other groupings. UNSD, New York. http://unstats.un.org/unsd/methods/m49/m49regin.htm. Cited 10 September 2010
- Wenneras C, Wold A. Nepotism and sexism in peer review. Nature. 1997;387:341–343. doi: 10.1038/387341a0. [DOI] [PubMed] [Google Scholar]
- World Bank (2010) World Development Indicators Quick Query database. World Bank, New York. http://data.worldbank.org/indicator. Cited 10 September 2010