Abstract
The liver regenerates upon partial hepatectomy (PH) as terminally differentiated hepatocytes undergo a tremendous proliferative process. CREM gene expression is powerfully induced during liver regeneration. We show that cell proliferation is significantly reduced upon PH in CREM−/− mice. There is a reduction in DNA synthesis, in the number of mitosis and of phosphorylated histone H3-positive cells. The post-PH proliferation peak is delayed by 10 hr, indicating an altered hepatocyte cell cycle. Expression of cyclins A, B, D1, E, and cdc2, of c-fos and tyrosine aminotransferase is deregulated. CREM mutation results in delayed S-phase entry, impairing the synchronization of proliferation.
The liver is one of the most important organs for homeostasis in mammals. Among its properties is the remarkable ability to regenerate following partial hepatectomy (Michalopoulos 1990; Fausto 1994). As much as 70% of the liver can be surgically removed and hepatocytes will proliferate to fully regenerate the original cell mass. The initial rounds of cell division are synchronous, and the first DNA replication occurs within 24 hr of surgery in the rat. The regeneration process is completed within 10–15 days (Bucher 1963).
A number of hormones, growth factors, and cytokines and their coupled signal transduction pathways have been implicated in governing hepatocyte proliferation, but the precise orchestration of these factors is poorly understood (Diehl and Rai 1996; Michalopoulos and De Frances 1997). In particular, cytokines IL-6 and TNF have been implicated in initiating hepatocyte DNA synthesis during regeneration (Fausto et al. 1995; Cressman et al. 1996; Yamada et al. 1997), whereas the DNA-binding activity of the downstream transcription factors Stat3 and NF-κB increases during the first hours following hepatectomy (Taub 1996).
A characteristic feature of liver regeneration is the dramatic increase in intracellular cAMP levels during the hepatocyte proliferation process, although its significance has remained elusive (Diehl et al. 1992). cAMP peaks during the first hours following partial hepatectomy, whereas elevated levels of cAMP also correlate with the proliferation of liver cell at birth (Diehl and Rai 1996). These notions underscore the critical role that must be played by cAMP-responsive transcription factors in liver regeneration.
Transcription factors coupled to cAMP signaling constitute a family of closely related bZIP proteins, either activators or repressors, binding to cAMP-responsive promoter elements (CREs) located within the regulatory regions of cAMP-inducible genes (Sassone-Corsi 1995; Montminy 1997). The factors CREB (CRE-binding protein), CREM (CRE modulator), and ATF-1 (activator transcription factor 1) are turned into activators by phosphorylation at a serine residue (Ser-133 in CREB; Ser-117 in CREM) (Gonzalez and Montminy 1989; De Groot et al. 1993) elicited by PKA and other kinases (Sassone-Corsi 1995; Montminy 1997). Interestingly, a CREB-like activity has been implicated in the transcriptional regulation of several liver-specific genes, such as tyrosine aminotransferase (TAT) (Nichols et al. 1992).
The CREM gene encodes both activators and repressors of cAMP-induced transcription (Foulkes et al. 1991a; Sassone-Corsi 1995). The repressor ICER (inducible cAMP early repressor) is generated by an intronic, cAMP-inducible promoter with kinetics of an early response gene (Molina et al. 1993; Stehle et al. 1993). Elevated ICER expression is characteristic of many neuroendocrine tissues (Stehle et al. 1993; Lalli and Sassone-Corsi 1995; Monaco et al. 1995).
We have recently documented a powerful induction of ICER expression immediately following partial hepatectomy (Della Fazia et al. 1997; Servillo et al. 1997), which suggested that CREM gene products may play a role in the modulation of gene expression by cAMP during liver regeneration. To address the precise function of CREM in the liver, we chose to study mice that we have generated carrying a targeted mutation in the CREM locus (Nantel et al. 1996). Here we report that lack of CREM causes a 10-hr delay in the post-PH (partial hepatectomy) proliferation wave and deregulation in the expression of cyclins A, B, D1, E, and cdc2, as well as of c-fos and tyrosine aminotransferase (TAT). Thus, CREM appears to coordinate the timing of hepatocyte proliferation during the process of liver regeneration.
Results and Discussion
Delayed hepatocyte proliferation in CREM-deficient mice
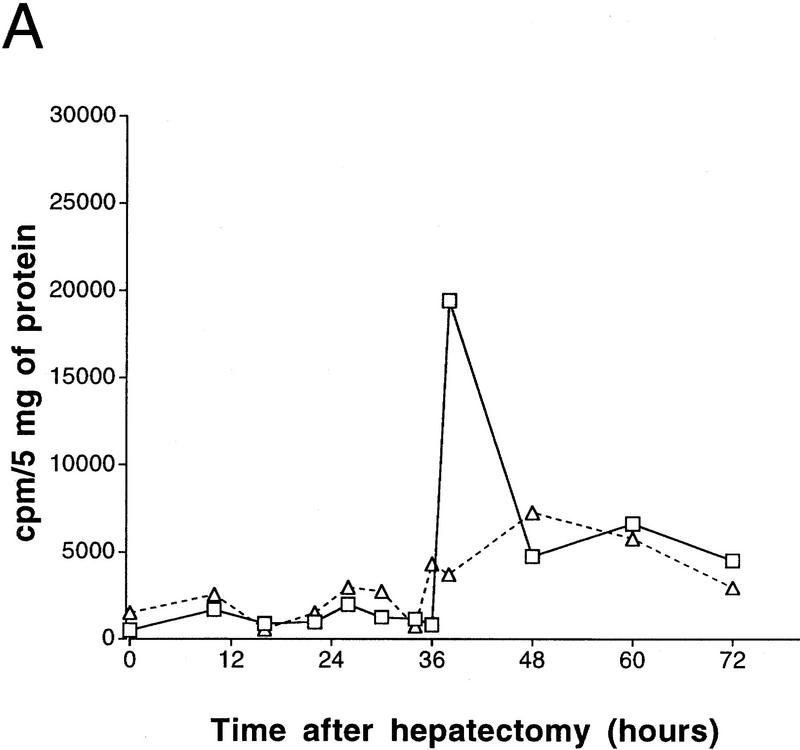
To address the precise function of CREM in the liver, we have generated mice that carry a targeted mutation in the CREM locus (Nantel et al. 1996). We performed PH on CREM mutants and wild-type littermates to compare subsequent liver regeneration. The first round of DNA synthesis in the regenerating liver was analyzed by measuring [3H]thymidine incorporation (Fig. 1A). Until 34-hr after PH, both wild-type and CREM−/− animals showed comparable, low levels of incorporation, equivalent to control animals. DNA synthesis peaks in wild-type animals at 38 hr after PH, as reported previously (Yamada et al. 1997). Strikingly, the 38-hr peak is absent in CREM-deficient mice (Fig. 1A). Incorporation in wild-type animals decreases progressively after the 38-hr peak. The profile in CREM−/− mice is remarkably different. A modest rise in incorporation is seen at 48 hr following PH, with a 10-hr delay compared to the peak in wild-type littermates (Fig. 1A).
Figure 1.
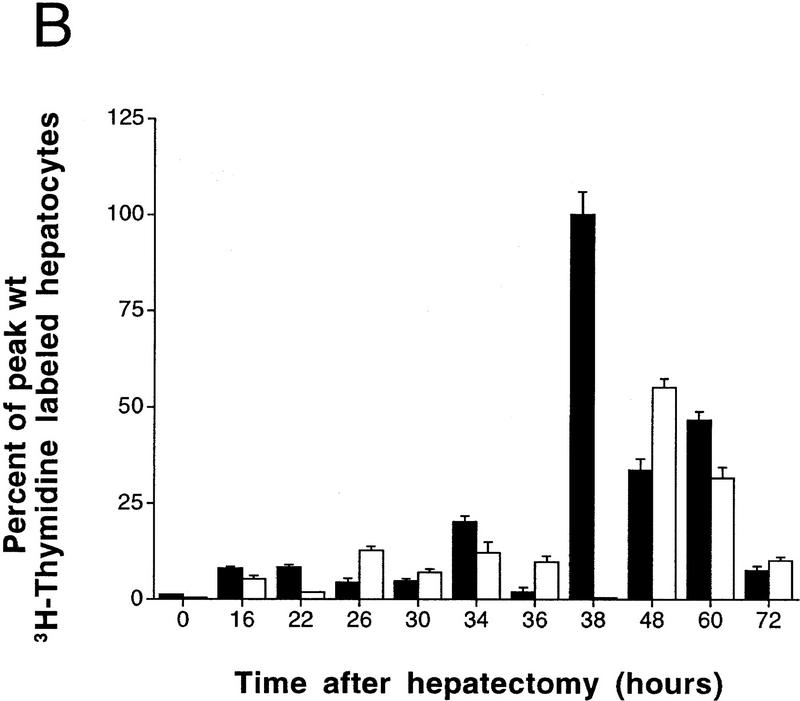
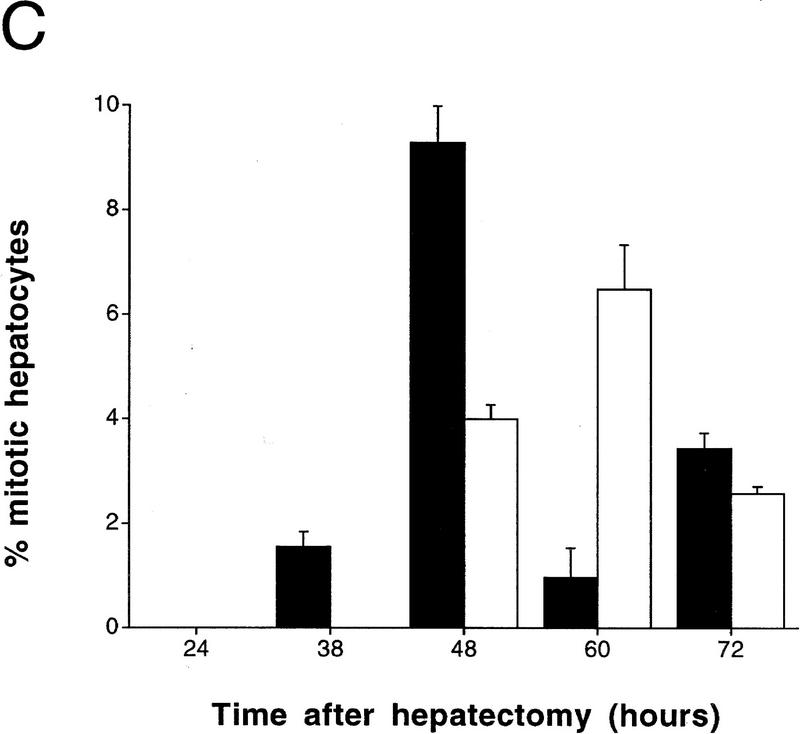
Delayed peak of hepatocyte proliferation in CREM-deficient mice. (A) Kinetics of [3H]thymidine incorporation into DNA during wild-type (□) and CREM−/− (▵) liver regeneration (0–72 hr after PH). [3H]Thymidine incorporation was determined using scintillation counting and expressed as counts/min/5 mg of protein. (B) Percentage of positive dark-stained hepatocyte nuclei during [3H]thymidine incorporation. The time point with highest incorporation (38 hr in wild type) was considered 100% with respect to the other time points. (C) Mitotic figures in hepatocytes were counted and quantitated as a percentage of the total number of hepatocytes in 10 high-power fields by two investigators at the indicated times after PH. (B,C) (█ Wild type; □ CREM−/−) s.e.m. is shown.
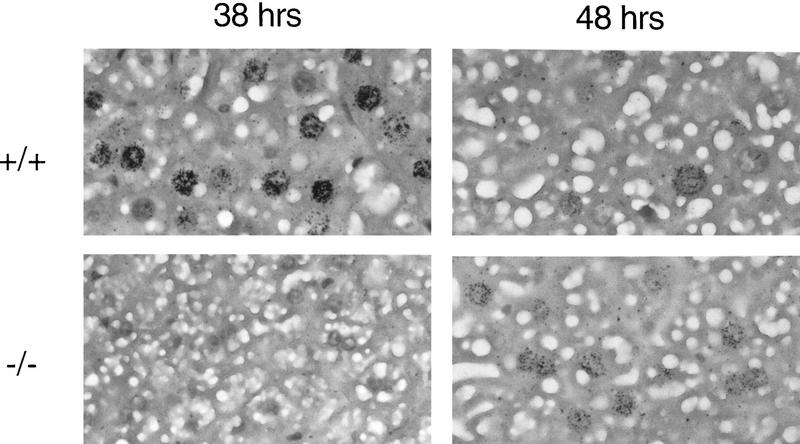
Autoradiographic analysis of histological liver sections from operated animals revealed significant differences between wild-type and CREM mutant mice (Figs. 1B and 2). Variations in the number of labeled hepatocyte nuclei parallel the kinetics of [3H]thymidine incorporation. In wild-type mice, values peak at 38 hr after PH, to return at pre-PH levels by 72 hr. In sharp contrast, very few labeled nuclei are detected at 38 hr in CREM−/− mice, where a 10-hr-delayed, reduced peak is observed at 48 hr (Fig. 1B). A comparison of the nuclei at peak times reveals that the labeling is much stronger in wild-type mice than in mutants (Fig. 2). Histological inspection of mitotic figures during liver regeneration (Fig. 1C) is consistent with the timing of DNA synthesis.
Figure 2.
Histological analysis of labeled nuclei during liver regeneration. Autoradiography shows positive hepatocyte nuclei in wild-type (+/+) and mutant (−/−) animals. Intensity is proportional to the relative levels of [3H]thymidine incorporation.
Changes in gene expression
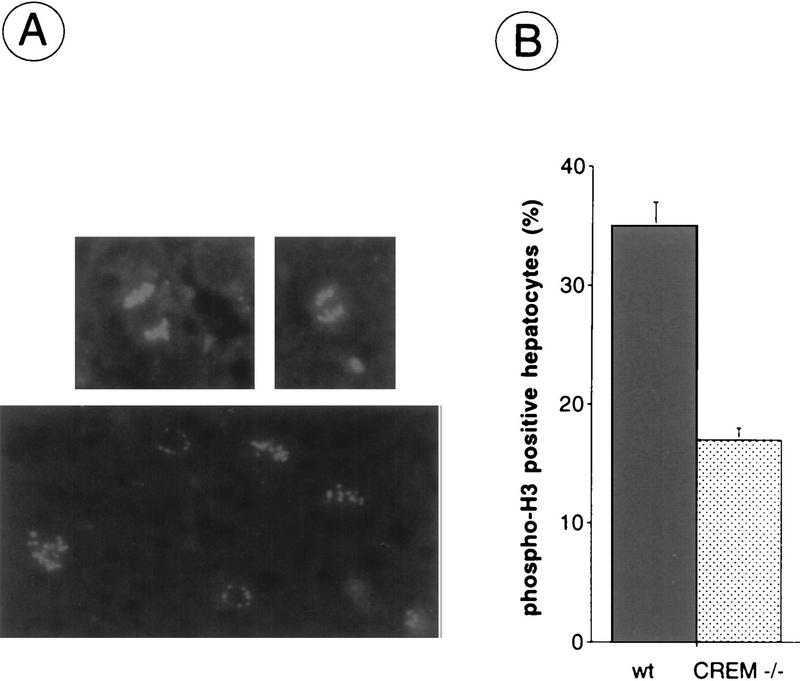
Mitotic waves are characterized by a cyclic, highly specific phosphorylation of histone H3, which is thought to represent a key step in chromatin remodeling during the cell division (Hendzel et al. 1997). We have used antibodies that specifically recognize the phosphorylated form of histone H3 (phospho-H3) and that specifically label mitotic nuclei (Fig. 3A). A comparison between the number of phospho-H3-positive nuclei at 48 hr posthepatectomy revealead a significant decrease in CREM-deficient mice as compared to wild-type littermates (Fig. 3B).
Figure 3.
Labeling of hepatocytes showing phospho-H3 at 48 hr after PH. (A) Representative micrographs of mitotic figures (top panels) and labeled nuclei (bottom panel) designating phospho-H3-positive cells visible during liver regeneration. (B) Number of phospho-H3-positive hepatocytes observed at 48 hr after PH. Values are shown (s.e.m.) collected over 20 fields of observations.
Histological comparative analysis 15 days after PH of wild-type and CREM−/− mice of regenerated hepatic tissue showed no significant difference between the two groups (not shown). Similarly, levels of IL-6 and TNFα, both having a critical role in liver regeneration (Cressman et al. 1996; Yamada et al. 1997), are also similar during the first 48 hr after PH (not shown). Thus, the CREM mutant animals demonstrate a significant delay in the timing of the first wave of DNA synthesis that follows PH, whereas hepatocyte morphology and the subsequent regeneration of the tissue appear normal.
Expression of genes involved in glucogenesis, such as TAT and phoshoenolpyruvate carboxykinase (PEPCK), is known to be induced in the liver during the first hours after PH (Mohn et al. 1990; Della Fazia et al. 1992). Kinetics of TAT expression following PH is similar in both wild-type and mutant mice, but the peak level in the CREM−/− mice is significantly lower than in the wild type. An equivalent effect is observed on PEPCK (Fig. 4A). Thus, whereas CREM mutation leads to a significant delay in the first wave of hepatocyte division (Figs. 1 and 2), not the timing, but the amplitude of the early TAT and PEPCK induction is significantly affected. This effect is compatible with the presence of CREs within the TAT and PEPCK promoters and their responsiveness to cAMP (Nichols et al. 1992).
Figure 4.
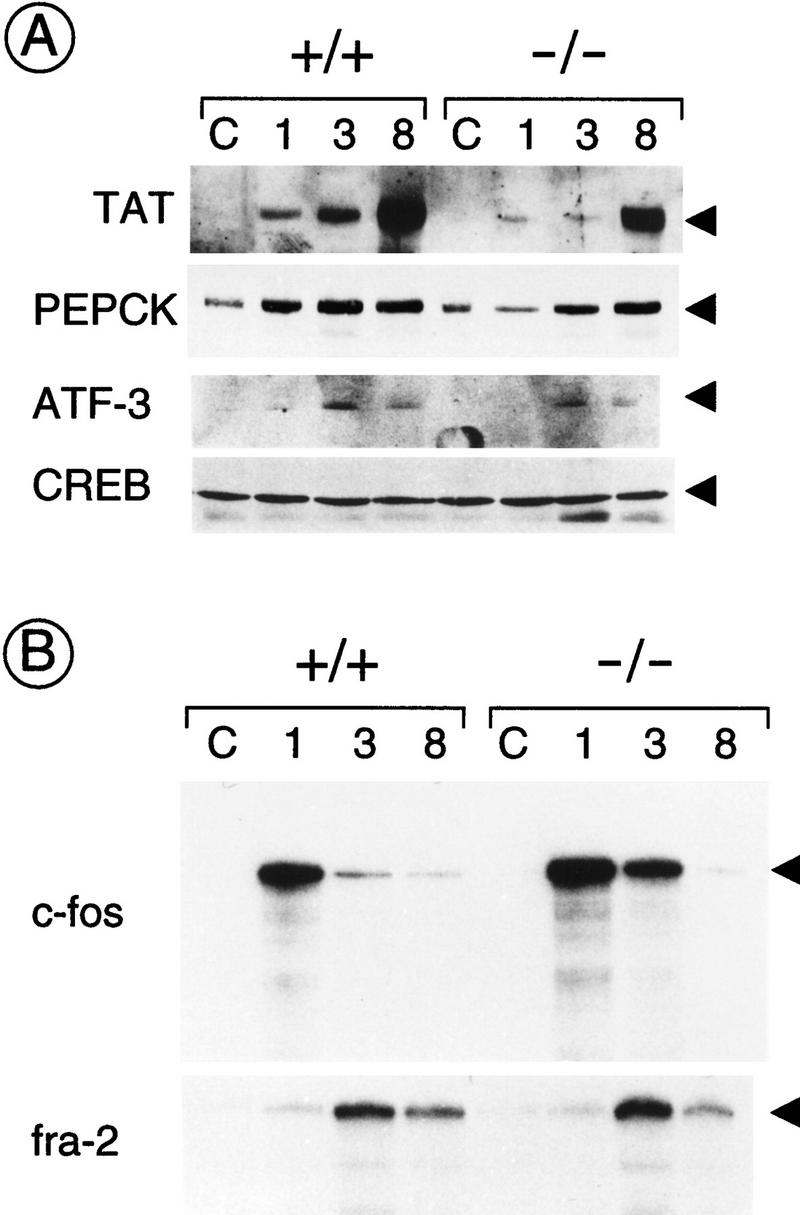
Gene expression in the first hours of liver regeneration after PH. (A) Western blot analysis using anti-TAT and anti-PEPCK antibodies of mice liver extracts from animals at various times after PH (1, 3, and 8 hr). Western blot analysis of lysates using an anti-CREB antibody confirms that the same amount of total protein has been loaded in each lane (bottom panel). (B) RNase protection analysis of c-fos and fra-2 expression using total RNA from regenerating liver at various times after PH (1, 3, and 8 hr). This experiment was performed several times with consistent results. Expression of c-fos at the 3 hr time point is fivefold higher (±0.5) in CREM mutant mice vs. wild type, as established after scanning various autoradiographs.
Induction of the early response gene c-fos upon PH has been well documented (Mohn et al. 1990). We observe that the kinetics of c-fos inducibility upon PH in CREM−/− mice is altered, as the transcriptional attenuation that follows the peak of inducibility is diminished (Fig. 4). This observation supports a scenario in which CREM contributes to the transcriptional attenuation of cAMP-induced genes (Foulkes et al. 1991b; Lamas et al. 1997). Importantly, the kinetics of fra-2 inducibility are identical in wild-type and mutant animals (Fig. 4B). Constitutive CREB expression is not altered during liver regeneration, and there is no significant difference between mutant and wild-type mice (Fig. 4A). A similar situation was observed for ATF-1 (not shown). ATF-3, a cAMP-unresponsive CRE-binding protein (Sassone-Corsi 1995), has been documented to be induced upon PH with the kinetics of an early response gene (Chen et al. 1996). ATF-3 expression is equivalent in wild-type and CREM-deficient animals (Fig. 4A). These results indicate that there are no major alterations in the expression of other CRE-binding factors in the liver of CREM mutant mice.
Deregulation of cyclins
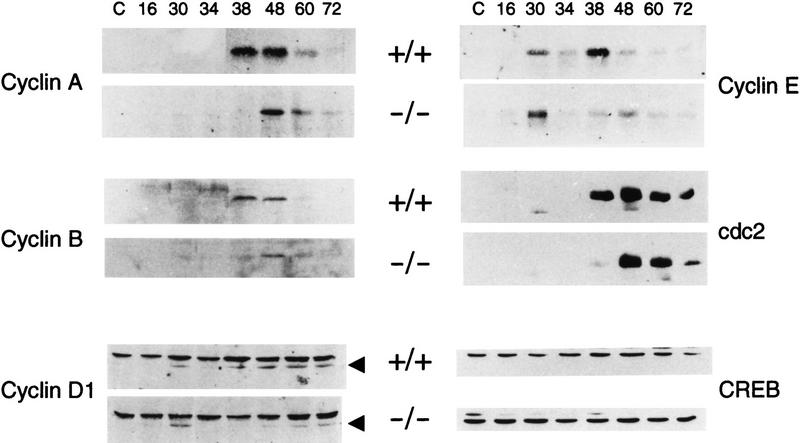
The coordinated rounds of cell division following PH constitute an in vivo system to study the role played by cyclins at specific checkpoints of the cell cycle (Reed 1991; Pines 1994; Sherr 1994). The expression of cyclins in the regenerating liver has been studied extensively (Lu et al. 1992; Albrecht et al. 1993; Loyer et al. 1994; Michalopoulos and De Frances 1997). The delay in hepatocyte proliferation seen in CREM-deficient mice (Fig. 1) and the direct regulation of cyclin A expression by CREM (Desdouets et al. 1995; Lamas et al. 1997) prompted us to analyze the expression of cyclins A, B, D1, E, and cdc2 following PH. Cyclin A expression is undetectable in normal liver or during the G1 phase; it is strongly induced during the hepatocyte S phase and decreases to normal levels 3 days after PH (Verges et al. 1997). Expression of cyclin A increases rapidly at 38 hr after PH in wild-type mice, corresponding to the peak of [3H]thymidine incorporation, to then decrease progressively. In CREM-deficient mice the peak of cyclin A is delayed until 48 hr following PH and is significantly lower than in wild-type animals (Fig. 5). A similar situation is observed for cyclin B (Trembley et al. 1994), whose peak of expression is delayed and reduced in CREM mutant mice (Fig. 5). Cyclin D1 rise in expression is known to occur 38 hr after PH during the hepatocyte S phase and to persist until 72 hr (Albrecht et al. 1995). In CREM mutant mice the rise in expression is delayed to 48 hr, with levels much lower than the wild-type animal (Fig. 5). Cyclin E shows two peaks of expression in normal mice, at 30 and 38 hr. In CREM mutant mice the 30-hr peak is conserved, whereas the 38-hr peak is delayed and weakened (Fig. 5). Finally, expression of cdc2 is also altered drastically in CREM-deficient mice. The rise in cdc2 levels is again delayed as compared to wild-type mice (Fig. 5). Together, these results are consistent with the notion that in CREM mutant animals the cell cycle progresses normally through G1 phase but that the entry into S phase is delayed, causing a desynchronization in proliferation.
Figure 5.
Aberrant cyclin expression in the regenerating liver of CREM-deficient mice. Western blot analysis of mice liver extracts at different times after PH (hours) using antibodies against cyclins A, B1, D1, E, and cdc2. Analysis using an anti-CREB antibody shows that the same amount of total protein is loaded in each lane.
Conclusion
Our results address the role of a cAMP-responsive transcription factor in a cellular proliferation process in vivo. Liver regeneration following PH has proved a powerful model system to understand the signals initiating and controlling cellular proliferation. cAMP fluxes are well documented to accompany the first rounds of hepatocyte cell division (Diehl et al. 1992; Della Fazia et al. 1997), but the cellular mechanism by which this second messenger operates has remained elusive. The powerful induction in CREM expression following hepatectomy that we have documented recently (Servillo et al. 1997) suggests that it may play an important regulatory role. The results reported here provide evidence that this cAMP-responsive transcription factor acts as a nuclear effector in regulating hepatocyte proliferation. Loss of CREM function results in a significant delay in the first round of mitosis. The inherent synchronization of the first round of cell division upon PH reveals that CREM is involved in the entry into S phase. Expression of TAT, PEPCK, and c-fos is affected, whereas drastic changes in the levels of cyclins point to a normal passage of the hepatocytes through the G1 phase but an altered synchronization of cells undergoing division and a remarkable delay in the entry into S phase. It is interesting to note that TAT, PEPCK, c-fos and several cyclin genes contain CRE elements within their promoter regulatory regions. This notion and the results reported here place CREM in a central position in the orchestration of the molecular events regulating hepatocyte proliferation and cell cycle during the process of liver regeneration.
Materials and methods
Animals
The generation of CREM−/− mice has been described previously. The mutagenesis of the CREM locus was designed to abolish the generation of all isoforms encoding transcriptional activators and repressors (Nantel et al. 1996). The CREM−/− animals and wild-type controls were maintained in a 12:12-hr light/dark cycle, and food and water were provided ad libitum. Adult mice (25–32 grams) were used for PH. Liver resection of the left lateral and median lobes was performed after a midventral laparatomy (Higgins and Anderson 1931). Surgery was performed between 8 a.m. and 12 a.m. under ether anesthesia. The mortality of the animals following PH was <5%. Liver tissue was rinsed in situ with PBS by perfusion through the portal vein for 10 sec to eliminate blood cells. Livers were then minced and divided into aliquots for further processing. Four wild-type and CREM−/− animals were analyzed for each time point, and experiments were repeated at least three times.
[3H]Thymidine incorporation
[3H]Thymidine (NEN, DuPont 15 mCi/mmole) was injected intraperitoneally 2 hr before sacrifice (0.5 μCi/gram of body weight). Biopsies were homogenized in PBS by sonication to a final concentration of 40 mg/ml tissue. Aliquots of each sample were used for protein determination (Bio-Rad). Incorporation of [3H]thymidine into de novo synthesized DNA was assayed by precipitation of nucleic acid with TCA and successive washes with 10% and 5% TCA (Loyer et al. 1994). DNA synthesis was expressed as counts per minute in 5-mg aliquots of protein.
Histological and autoradiographic analyses
Fragments of liver were fixed immediately in Bouin’s solution. After 2 days, fixed tissues were embedded in paraffin, and 5-μm slices were microtome sectioned and mounted on slides. For histological analysis sections were stained with hematoxylin–eosin; for autoradiographic analysis sections were unstained. Mitotic figures in hepatocytes were counted in 10 high-power fields and expressed as a percentage of the total number of hepatocytes by two investigators. The slides for autoradiographic analysis were coated in NTB-2 emulsion and than stored in the dark at 4°C. After 28 days the slides were developed and counterstained with hematoxylin–eosin. Analysis of [3H]thymidine incorporation was performed by counting positive dark-staining hepatocyte nuclei on each slide in 10 low-power fields. Histological analysis of nuclei positive for the phosphorylated form of histone H3 was performed as described (Hendzel et al. 1997). Anti phospho-H3 antibodies were a generous gift of Dr. C.D. Allis (University of Virginia, Charlottesville).
RNA analysis
Liver RNA was obtained by homogenizing the tissue in guanidinium thiocyanate solution followed by CsCl step gradient centrifugation. Approximately 20 μg of liver RNA was analyzed by RNase protection using c-fos and fra-2 riboprobes. The c-fos riboprobe encompasses the first exon of the specific mRNA; the fra-2 riboprobe has been described previously (Foulkes et al. 1996). RNase protection analyses were performed several times with consistent results.
Immunoblot analysis
Liver tissue was homogenized in Laemmli sample buffer, boiled, and sonicated. Protein extracts were normalized by SDS-PAGE followed by Coomassie blue staining. Subsequently, liver extracts were analyzed by Western blot using specific antibodies and then visualized by ECL chemiluminescence (Amersham). Anti-TAT and anti-PEPCK polyclonal antibodies were a kind gift of Dr. D.K. Granner (Vanderbilt University, Nashville, TN); antibodies against ATF-3, cyclins A, B1, D1, E, and cdc2 were purchased from Santa Cruz Biotechnology; the anti-CREB polyclonal antibody was obtained from Bio-Labs.
Acknowledgments
We are grateful to C.D. Allis for the generous gift of the anti-phospho-H3 antibodies. We thank D.K. Granner, N. Fausto, G.M. Fimia, C.D. Allis, M. Viola-Magni, and all the members of the Sassone-Corsi laboratory for help, discussions, and gifts of material. We are grateful for the excellent technical assistance of G. Duval, E. Heitz, and B. Boulay. G.S. is supported by fellowships from Fondation de la Recherche Médicale (France) and the Consiglio Nazionale delle Ricerche (Italy). M.A.D.F. is supported by INSERM. This work was supported by grants from CNRS, INSERM, Hôpital Universitaire de Strasbourg, Fondation de la Recherche Médicale, ULP, and Association pour la Recherche sur le Cancer.
The publication costs of this article were defrayed in part by payment of page charges. This article must therefore be hereby marked ‘advertisement’ in accordance with 18 USC section 1734 solely to indicate this fact.
Footnotes
E-MAIL paolosc@igbmc.u-strasbg.fr; FAX 33 388 653246.
References
- Albrecht JH, Hoffman JS, Kren BT, Steer CJ. Cyclin and cyclin-dependent kinase 1 mRNA expression in models of regenerating liver and human liver diseases. Am J Physiol. 1993;265:G857–G864. doi: 10.1152/ajpgi.1993.265.5.G857. [DOI] [PubMed] [Google Scholar]
- Albrecht JH, Hu MY, Cerra FB. Distinct patterns of cyclin D1 regulation in models of liver regeneration and human liver. Biochem Biophys Res Commun. 1995;209:648–655. doi: 10.1006/bbrc.1995.1548. [DOI] [PubMed] [Google Scholar]
- Bucher NLR. Regeneration of mammalian liver. Int Rev Cytol. 1963;15:245–300. doi: 10.1016/s0074-7696(08)61119-5. [DOI] [PubMed] [Google Scholar]
- Chen BP, Wolfgang CD, Hai T. Analysis of ATF3, a transcription factor induced by physiological stresses and modulated by gadd153/Chop10. Mol Cell Biol. 1996;16:1157–1168. doi: 10.1128/mcb.16.3.1157. [DOI] [PMC free article] [PubMed] [Google Scholar]
- Cressman DE, Greenbaum LE, De Angelis RA, Ciliberto G, Furth EE, Poli V, Taub R. Liver failure and defective hepatocyte regeneration in interleukin-6-deficient mice. Science. 1996;274:1379–1383. doi: 10.1126/science.274.5291.1379. [DOI] [PubMed] [Google Scholar]
- De Groot RP, den Hertog J, Vandenheede JR, Goris J, Sassone-Corsi P. Multiple and cooperative phosphorylation events regulate the CREM activator function. EMBO J. 1993;12:3903–3911. doi: 10.1002/j.1460-2075.1993.tb06068.x. [DOI] [PMC free article] [PubMed] [Google Scholar]
- Della Fazia MA, Servillo G, Viola Magni M. Different expression of tyrosine aminotransferase and serine deydratase in rat livers after partial hepatectomy. Biochem Biophys Res Commun. 1992;182:753–759. doi: 10.1016/0006-291x(92)91796-s. [DOI] [PubMed] [Google Scholar]
- Della Fazia MA, Servillo G, Sassone-Corsi P. Cyclic AMP signalling and cellular proliferation: Regulation of CREB and CREM. FEBS Lett. 1997;410:22–24. doi: 10.1016/s0014-5793(97)00445-6. [DOI] [PubMed] [Google Scholar]
- Desdouets C, Matesic G, Molina C, Foulkes NS, Sassone-Corsi P, Brechot C, Sobczak-Thepot J. Cell cycle regulation of cyclin A gene expression by the cyclic AMP-responsive transcription factors CREB and CREM. Mol Cell Biol. 1995;15:3301–3309. doi: 10.1128/mcb.15.6.3301. [DOI] [PMC free article] [PubMed] [Google Scholar]
- Diehl AM, Rai RM. Regulation of signal transduction during liver regeneration. FASEB J. 1996;10:215–227. doi: 10.1096/fasebj.10.2.8641555. [DOI] [PubMed] [Google Scholar]
- Diehl AM, Yang SQ, Wolfgang D, Wand G. Differential expression of guanine nucleotide-binding proteins enhances cAMP synthesis in regenerating rat liver. J Clin Invest. 1992;89:1706–1712. doi: 10.1172/JCI115771. [DOI] [PMC free article] [PubMed] [Google Scholar]
- Fausto N. Liver regeneration. In: Arias IM, Boyer JL, Jakoby WB, Fausto N, Schachter D, Shafritz DA, editors. The liver: Biology and pathobiology. New York, NY: Raven Press; 1994. pp. 1059–1084. [Google Scholar]
- Fausto N, Laird AD, Webber EM. Role of growth factors and cytokines in hepatic regeneration. FASEB J. 1995;9:1527–1536. doi: 10.1096/fasebj.9.15.8529831. [DOI] [PubMed] [Google Scholar]
- Foulkes NS, Borrelli E, Sassone-Corsi P. CREM gene: Use of alternative DNA-binding domains generates multiple antagonists of cAMP-induced transcription. Cell. 1991a;64:739–749. doi: 10.1016/0092-8674(91)90503-q. [DOI] [PubMed] [Google Scholar]
- Foulkes NS, Laoide B, Schlotter F, Sassone-Corsi P. Transcriptional antagonist CREM down-regulates c-fos cAMP-induced expression. Proc Natl Acad Sci. 1991b;88:5448–5452. doi: 10.1073/pnas.88.12.5448. [DOI] [PMC free article] [PubMed] [Google Scholar]
- Foulkes NS, Borjigin J, Snyder SH, Sassone-Corsi P. Transcriptional control of circadian hormone synthesis via the CREM feedback loop. Proc Natl Acad Sci. 1996;93:14140–14145. doi: 10.1073/pnas.93.24.14140. [DOI] [PMC free article] [PubMed] [Google Scholar]
- Gonzalez GA, Montminy MR. Cyclic AMP stimulates somatostatin gene transcription by phosphorylation of CREB at Ser133. Cell. 1989;59:675–680. doi: 10.1016/0092-8674(89)90013-5. [DOI] [PubMed] [Google Scholar]
- Hendzel MJ, Wei Y, Mancini MA, Van Hooser A, Ranalli T, Brinkley BR, Bazett Jones DP, Allis CD. Mitosis-specific phosphorylation of histone H3 initiates primarily within pericentromeric heterochromatin during G2 and spreads in an ordered fashion coincident with mitotic chromosome condensation. Chromosoma. 1997;106:348–360. doi: 10.1007/s004120050256. [DOI] [PubMed] [Google Scholar]
- Higgins GM, Anderson RM. Experimental pathology of liver: Restoration of liver in white rat following partial surgical removal. Arch Pathology. 1931;12:186–202. [Google Scholar]
- Lalli E, Sassone-Corsi P. Thyroid-stimulating hormone (TSH)-directed induction of the CREM gene in the thyroid gland participates in the long-term desensitization of the TSH receptor. Proc Natl Acad Sci. 1995;92:9633–9637. doi: 10.1073/pnas.92.21.9633. [DOI] [PMC free article] [PubMed] [Google Scholar]
- Lamas M, Molina C, Foulkes NS, Jansen E, Sassone-Corsi P. Ectopic ICER expression in pituitary corticotroph AtT20 cells: Effects on morphology, cell cycle, and hormonal production. Mol Endocrinol. 1997;11:1425–1434. doi: 10.1210/mend.11.10.9987. [DOI] [PubMed] [Google Scholar]
- Loyer P, Glaise D, Cariou S, Baffet G, Meijer L, Guguen-Guillouzo C. Expression and activation of cdks (1 and 2) and cyclins in the cell cycle progression during liver regeneration. J Biol Chem. 1994;269:2491–500. [PubMed] [Google Scholar]
- Lu XP, Koch KS, Lew DJ, Dulic V, Pines J, Reed SI, Hunter T, Leffert HL. Induction of cyclin mRNA and cyclin-associated histone H1 kinase during liver regeneration. J Biol Chem. 1992;267:2841–2844. [PubMed] [Google Scholar]
- Michalopoulos GK. Liver regeneration: Molecular mechanisms of growth control. FASEB J. 1990;4:176–187. [PubMed] [Google Scholar]
- Michalopoulos GK, De Frances M. Liver regeneration. Science. 1997;276:60–66. doi: 10.1126/science.276.5309.60. [DOI] [PubMed] [Google Scholar]
- Mohn KL, Laz TM, Melby AE, Taub R. Immediate-early gene expression differs between regenerating liver, insulin-stimulated H-35 cells, and mitogen-stimulated Balb/c 3T3 cells. Liver-specific induction patterns of gene 33, phosphoenolpyruvate carboxykinase, and the jun, fos, and egr families. J Biol Chem. 1990;265:21914–21921. [PubMed] [Google Scholar]
- Molina C, Foulkes NS, Lalli E, Sassone-Corsi P. Inducibility and negative autoregulation of CREM: An alternative promoter directs the expression of ICER, an early response repressor. Cell. 1993;75:875–886. doi: 10.1016/0092-8674(93)90532-u. [DOI] [PubMed] [Google Scholar]
- Monaco L, Foulkes NS, Sassone-Corsi P. Pituitary follicle-stimulating hormone (FSH) induces CREM gene expression in Sertoli cells: Involvement in long-term desensitization of the FSH receptor. Proc Natl Acad Sci. 1995;92:10673–10677. doi: 10.1073/pnas.92.23.10673. [DOI] [PMC free article] [PubMed] [Google Scholar]
- Montminy MR. Transcriptional regulation by cyclic AMP. Annu Rev Biochem. 1997;66:807–822. doi: 10.1146/annurev.biochem.66.1.807. [DOI] [PubMed] [Google Scholar]
- Nantel F, Monaco L, Foulkes NS, Masquilier D, Le Meur M, Henriksen K, Dierich A, Parvinen M, Sassone-Corsi P. Spermiogenesis deficiency and germ-cell apoptosis in CREM-mutant mice. Nature. 1996;380:159–162. doi: 10.1038/380159a0. [DOI] [PubMed] [Google Scholar]
- Nichols M, Weih F, Schmid W, De Vack C, Kowenz-Leutz E, Luckow B, Boshart M, Schutz G. Phosphorylation of CREB affects its binding to high and low affinity sites: implications for cAMP induced gene transcription. EMBO J. 1992;11:3337–3346. doi: 10.1002/j.1460-2075.1992.tb05412.x. [DOI] [PMC free article] [PubMed] [Google Scholar]
- Pines J. The cell cycle kinases. Semin Cancer Biol. 1994;5:305–313. [PubMed] [Google Scholar]
- Reed SI. G1-specific cyclins: In search of an S-phase promoting factor. Trends Genet. 1991;7:95–99. doi: 10.1016/0168-9525(91)90279-Y. [DOI] [PubMed] [Google Scholar]
- Sassone-Corsi P. Transcription factors responsive to cAMP. Annu Rev Cell Dev Biol. 1995;11:355–377. doi: 10.1146/annurev.cb.11.110195.002035. [DOI] [PubMed] [Google Scholar]
- Servillo G, Penna L, Foulkes NS, Viola Magni M, Della Fazia MA, Sassone-Corsi P. Cyclic AMP signalling pathway and cellular proliferation: Induction of CREM during liver regeneration. Oncogene. 1997;14:1601–1606. doi: 10.1038/sj.onc.1200996. [DOI] [PubMed] [Google Scholar]
- Sherr CJ. G1 phase progression: Cycling on cue. Cell. 1994;79:551–555. doi: 10.1016/0092-8674(94)90540-1. [DOI] [PubMed] [Google Scholar]
- Stehle JH, Foulkes NS, Molina C, Simonneaux V, Pevet P, Sassone-Corsi P. Adrenergic signals direct rhythmic expression of transcriptional repressor CREM in the pineal gland. Nature. 1993;365:314–320. doi: 10.1038/365314a0. [DOI] [PubMed] [Google Scholar]
- Taub R. Transcriptional control of liver regeneration. FASEB J. 1996;10:413–427. [PubMed] [Google Scholar]
- Trembley JH, Kren BT, Steer CJ. Posttranscriptional regulation of cyclin B messenger RNA expression in the regenerating rat liver. Cell Growth Differ. 1994;5:99–108. [PubMed] [Google Scholar]
- Verges M, Castro A, Jaumot M, Bachs O, Enrich C. Cyclin A is present in the endocytic compartment of rat liver cells and increases during liver regeneration. Biochem Biophys Res Commun. 1997;230:49–53. doi: 10.1006/bbrc.1996.5851. [DOI] [PubMed] [Google Scholar]
- Yamada Y, Kirillova I, Peschon JJ, Fausto N. Initiation of liver growth by tumor necrosis factor: Deficient liver regeneration in mice lacking type I tumor necrosis factor receptor. Proc Natl Acad Sci. 1997;94:1441–1446. doi: 10.1073/pnas.94.4.1441. [DOI] [PMC free article] [PubMed] [Google Scholar]


